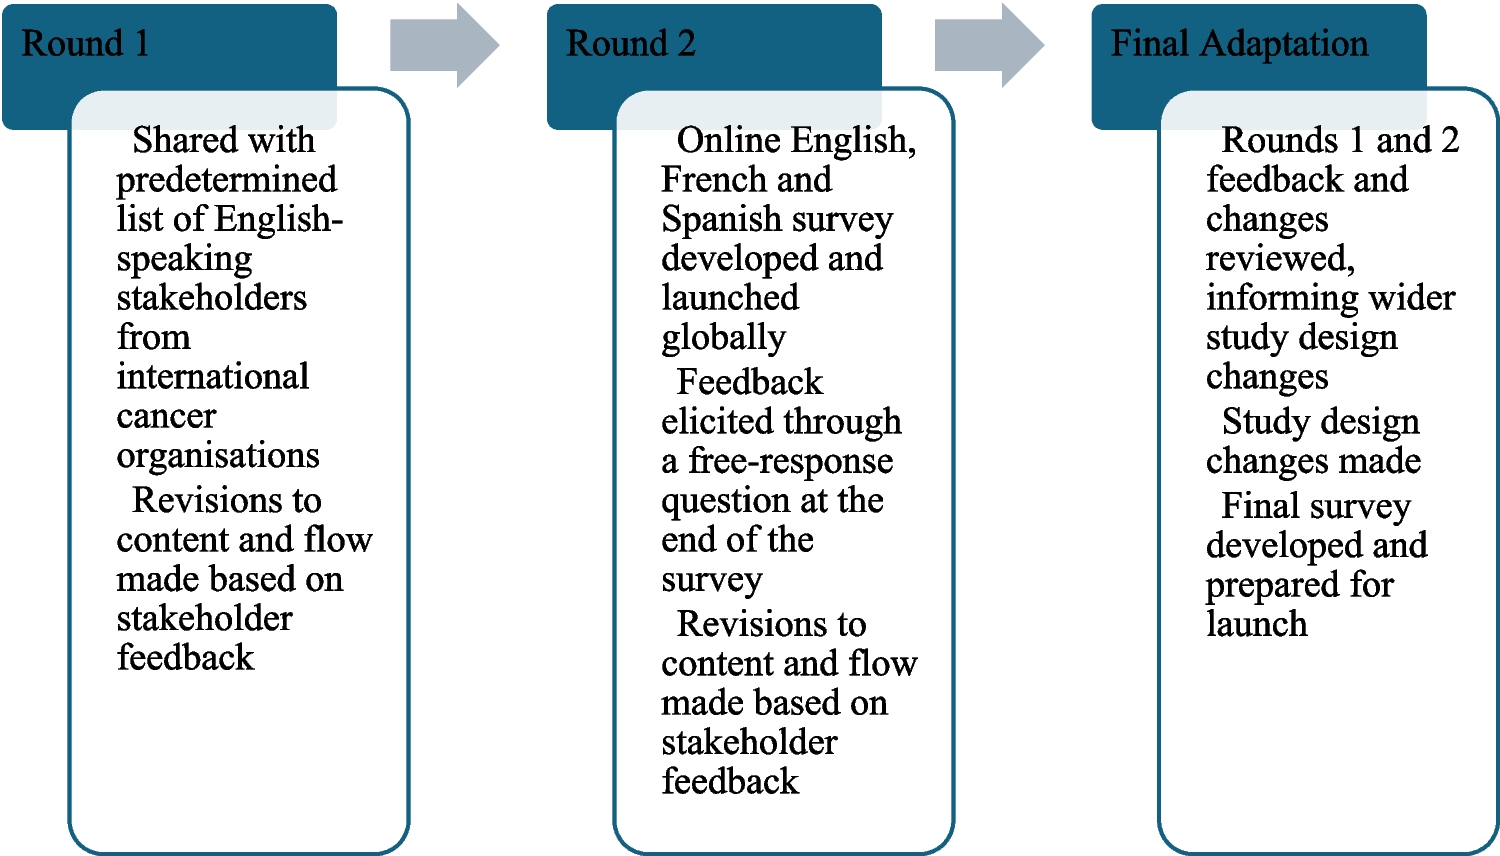
Aim 1: acceptability of the survey from the perspective of people affected by cancer internationallyPilot round one
An email requesting feedback on the feasibility and acceptability of the survey was sent to 33 stakeholders who spoke English and could review the English version of the survey. A total of 23 stakeholders from across HIC and LMIC completed the survey: including 3 from low-income, 7 from middle-income, and 13 from high-income countries. Stakeholders included 9 cancer survivors, 9 clinicians and/or researchers (including 5 psychologists, 2 public health researchers, and 1 nurse), 3 cancer advocates (health administration or non-profit organisation professionals) without direct relation to someone who had cancer, 2 caregivers of cancer survivors, and 1 cancer survivor who is also a bereaved caregiver of someone who died from cancer. In terms of representation across WHO regions, 3 stakeholders were from the African Region, 12 from the Americas, 4 from Europe, 1 from the Eastern Mediterranean, and 3 from the Western Pacific. No stakeholders were from the South-East Asian Region.
Feedback was generally positive, with more than half of stakeholders (n = 14, 61%) reporting the survey length was appropriate and most (n = 19, 83%) reporting there were no topics missing. However, 11 (48%) reported it would be “somewhat difficult” or “extremely difficult” to complete the survey, while 8 (35%) reported it would be “somewhat easy” or “neither easy nor difficult”. All 23 stakeholders provided one or more suggestions for improving the survey. These included improving the readability and international applicability of the survey questions, recommending simplification of wording and removal of any medical jargon, and removal of questions about survivorship care plans as models of survivorship care are too variable internationally.
Survey revision: pilot round 1
Based on the feedback from pilot round 1, the survey was adapted, with some items removed, others added, and some questions being reformulated. Specific changes to survey items as well as the addition of items in response to the feedback described are summarised in Table 2.
Table 2 Pilot round 1 feedback
Items that were removed to improve the flow, reduce the length of the survey, and ensure applicability to all healthcare contexts included: items on the perceived quality of care and support received during and after treatment, specific items on family members’ cancer treatment, and some caregiving questions. Questions relating to survivorship care and feelings experienced by survivors in this regard as well as some of the perceived professional qualities in follow-up care were also removed, given the variability of access to survivorship care globally. Changes were made to language to simplify or define medical terminology (e.g.: “metastatic”, “hereditary cancer syndrome”, definitions of certain medical specialists).
Pilot round two
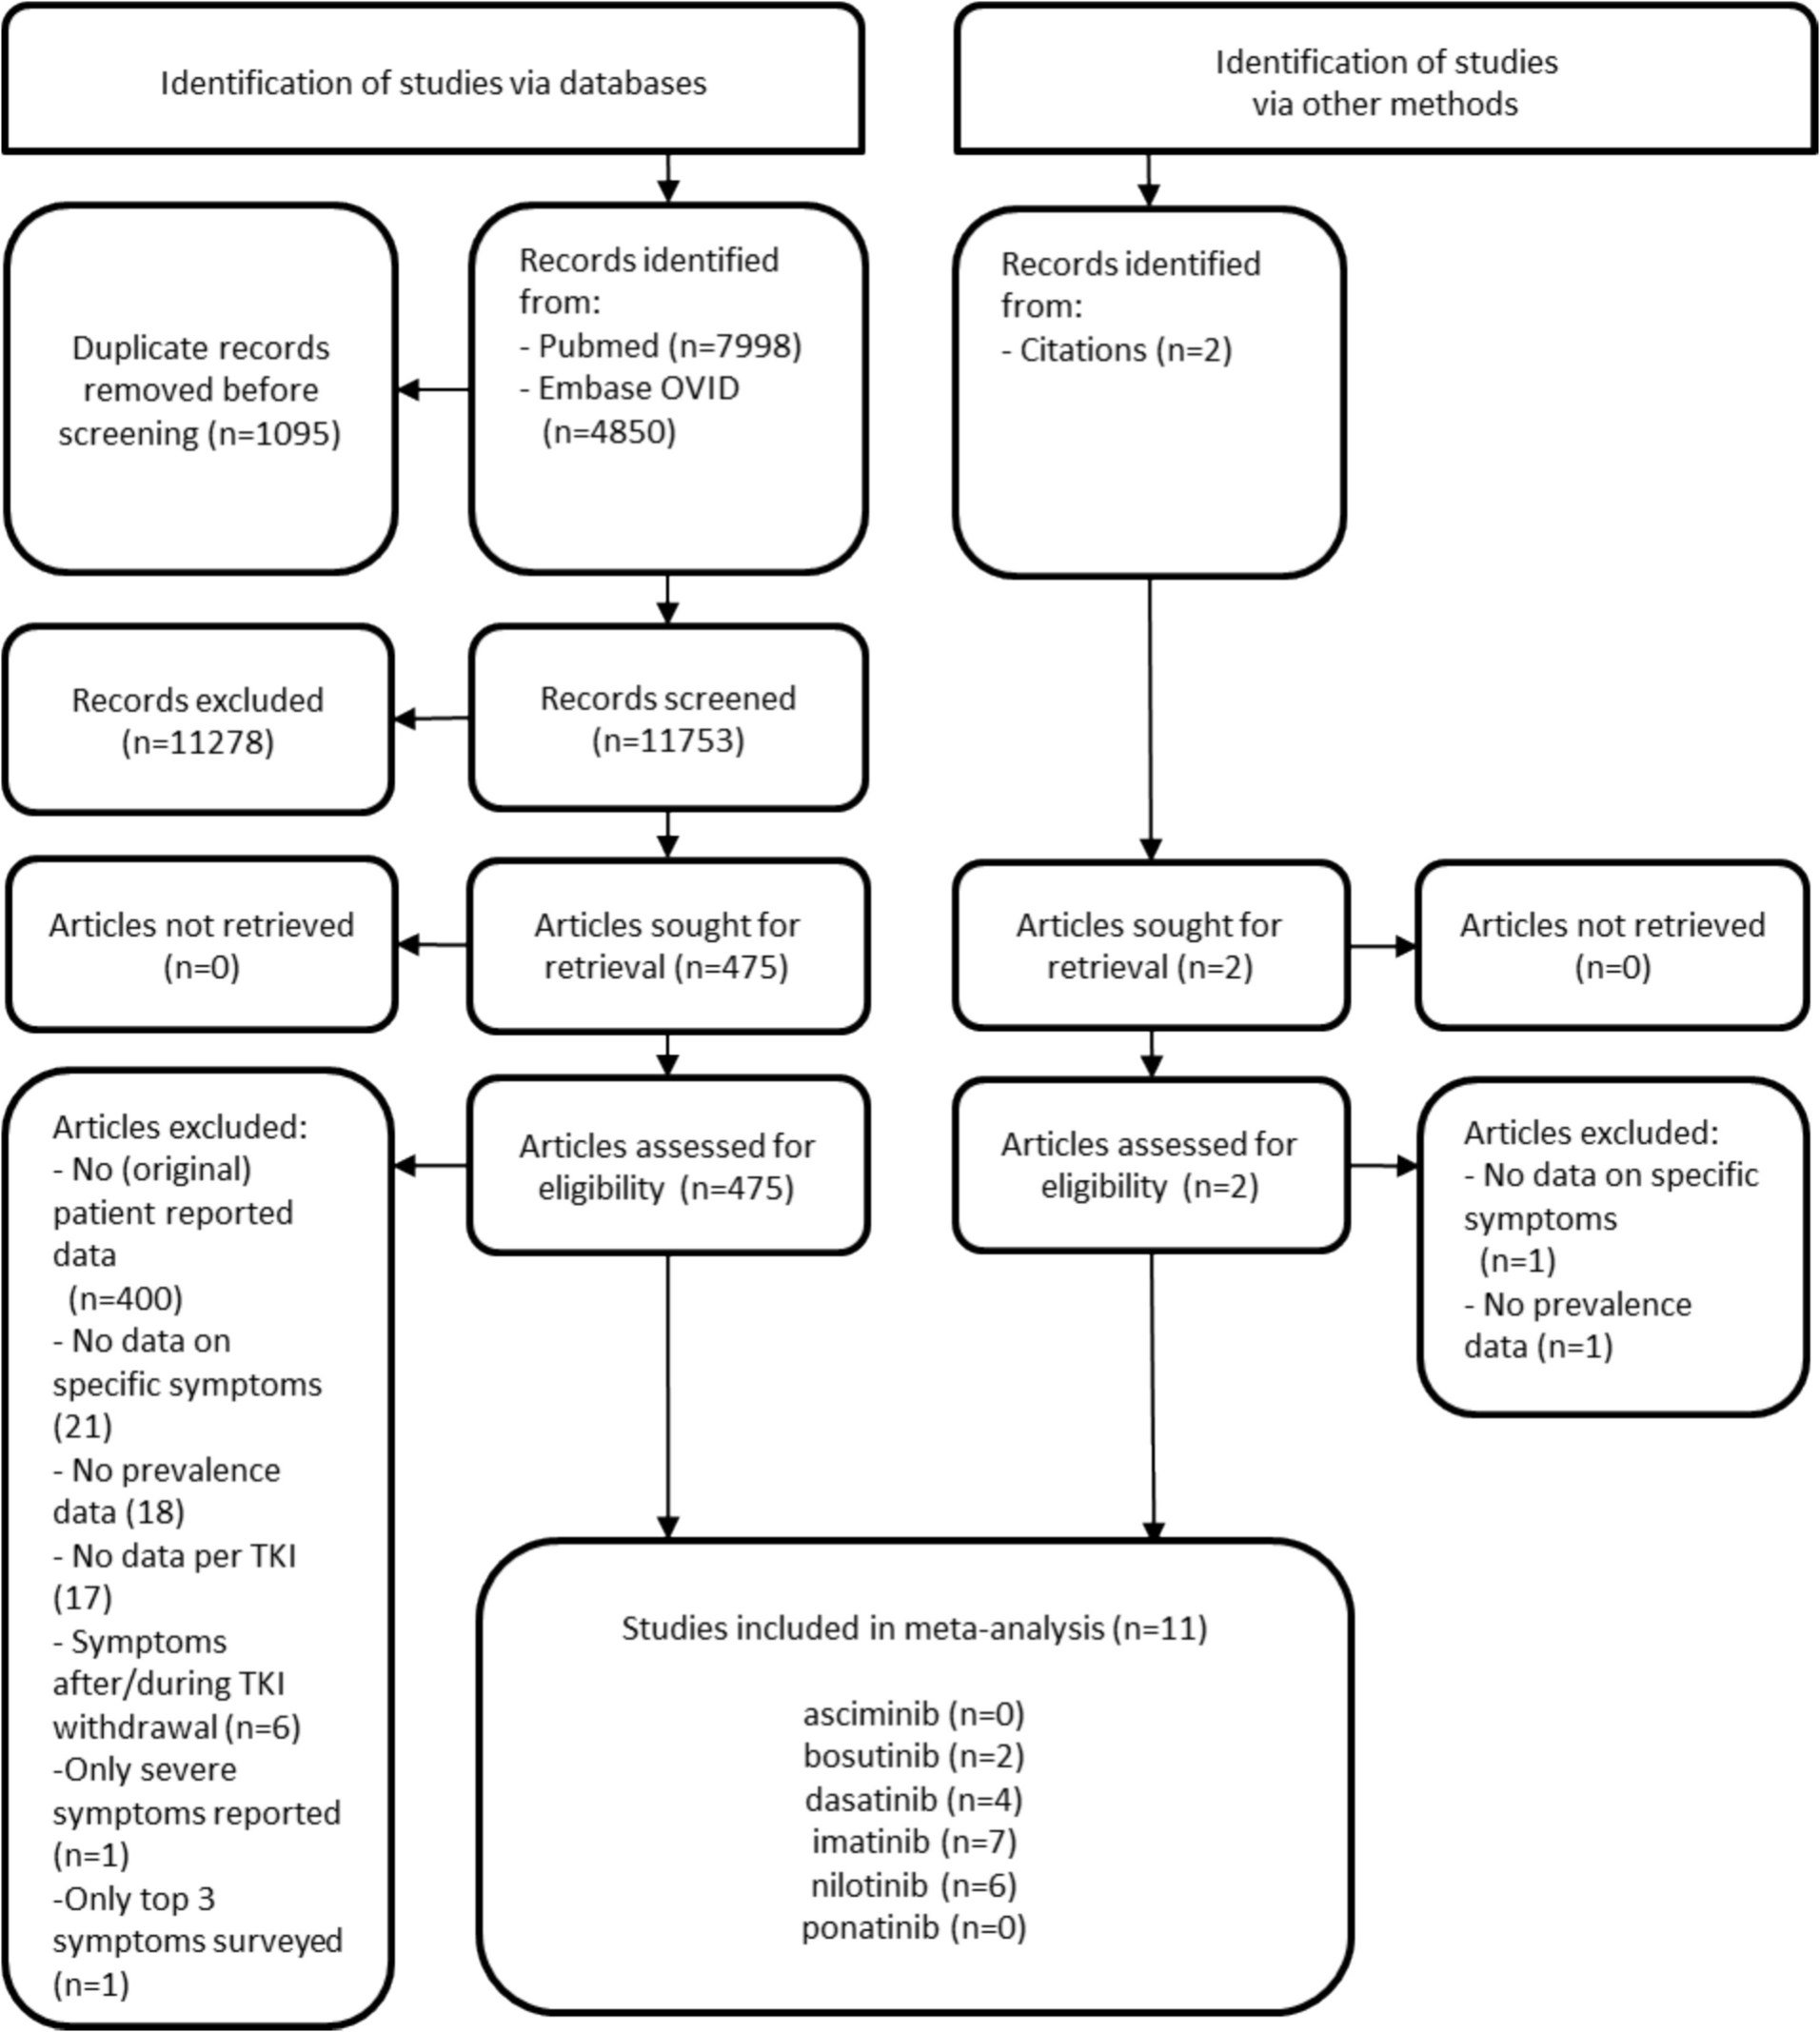
We received responses from 607 individuals, but excluded responses that were entirely incomplete (i.e. blank, n = 100) or appeared suspicious with odd language/statements (i.e. incoherent text, content not related to cancer or the survey; n = 2). This resulted in a total of 505 responses included for analysis. Given the anonymous nature of the survey, we were not able to verify individuals’ identities or responses.
Participant characteristics
Of the 505 included responses, participants were primarily female (419/505, 83%), identified as being a cancer survivor (301/505, 60%), and spoke English as a first language (379/505, 75%) (Table 2). Of the 301 who identified as a cancer survivor, 240 chose to respond to the survey as a cancer survivor and 61 chose to respond to the survey as a family member of someone who had cancer. Most participants were from high-income, English-speaking countries (368/505, 73%) (Table 3).
Table 3 Participant characteristics (n = 505)Free-text feedback on the survey
Feedback was provided by 177/505 (35%) participants, while 333/505 (66%) left the feedback field blank or indicated N/A in the feedback field, and 5/505 (0.9%) indicated that they were happy with the survey as it was. Categories derived from review of the feedback are described in Table 4. Of the 177 participants who entered a response, 112 (112/177, 63%) provided more general comments relating to their personal lived experiences of cancer not applicable to the survey. Sixty-five participants (65/177; 38%) provided feedback on the survey itself, which we were able to use to directly inform improvements to the survey content and flow.
Table 4 Feedback from participantsMost participants in pilot round 2 did not provide feedback, or indicated they were happy with the survey as it was (Table 4), sharing statements such as “Thanks for the questions. Felt good to answer as if someone was listening.” Constructive feedback in pilot round 2 centred around aspects of lived experiences that the survey did not account for, such as impacts of cancer on employment, responses based on different or multiple cancer experiences, impact of childhood cancer on siblings, and experiences of people living with metastatic or advanced cancer where treatment status as identification as a “survivor” may be less clear. For example, a parent of a childhood cancer survivor shared the challenging impact of the death of their child with cancer, on their sibling: “My child who is living has suffered from extreme anxiety, PTSD, and lots of issues as a result of the death of her younger sister…I wasn’t prepared for the amount of trauma that she had endured.” And a person living with metastatic cancer shared: “I hope that WHO might consider including the needs of people with metastatic or advanced cancer…who are now living much longer with what remains an incurable cancer.” Other perspectives participants felt were missing included recent versus long ago loss of a family member, change in marital relationships over time, impact of other chronic illnesses on the cancer experience, impact of mental health conditions on people’s long-term lived experience, and how responses to certain questions may change over time. Technical feedback was provided by a subset of participants as well (30/505, 6%), including requests for improvement to response layouts and survey flow (grouping of similar types of questions).
While we collated and considered all suggested additional topic areas, we did not include some topics in the final version of the survey because they were not aligned with the study focus, or they would significantly increase the survey length. Additionally, following pilot round two, the research team was contacted directly by more than 10 cancer organisations and partners, requesting that people currently living with cancer and their family members be included, to capture their voices and experiences. Together, these challenges required revision to our study design across recruitment approaches, stakeholder engagement, and accessibility of the survey (Table 5).
Table 5 Changes to survey design based on pilot roundsAim 2: achieve broad representation of people diagnosed with cancer across sex, cancer type, and country income level (high, middle, or low, according to World Bank country income classifications)
Compared with international normative data on people with cancer [3], our sample of 240 cancer survivors included significantly more females (83% in our sample compared to 48% internationally, X2 (1) = 71.3, p < 0.001), a higher proportion of individuals from high-income countries (88% vs. 21%, X2 (1) = 47.1, p < 0.001), and a higher proportion of individuals from the Americas (40% vs. 13%, X2 (1) = 151, p < 0.001). Our sample included significantly fewer survivors with a solid tumour diagnosis (69% vs. 80%, X2 (1) = 17.6, p < 0.001) and more survivors with a haematological diagnosis (leukaemia, lymphoma, or myeloma) (18% vs. 6.1%, X2 (1) = 64, p < 0.001). However, the proportion of CNS tumour diagnosis (1.2% vs. 1.6%, X2 (1) = 2.28, p = 0.13) in our sample did not significantly differ from international data.


Comments (0)