
Remember me


Between 14 November 2016 and 10 February 2020, 78 patients were enrolled at eight study sites in the USA: 32 patients in phase 1b and 46 patients in phase 2. The median duration of study treatment was 1.7 (range 0–14.5) months; no patients remained on study treatment as of the cutoff date (10 February 2020). All 78 patients (100%) discontinued magrolimab, and 76 (97.4%) discontinued cetuximab, mainly owing to progressive disease (PD; magrolimab, 80.8%; cetuximab, 79.5%) and treatment-emergent AEs (TEAEs; magrolimab, 5.1%; cetuximab, 7.7%). In phase 2, three (3.8%) patients received only the magrolimab priming dose. Two (2.6%) patients did not receive cetuximab treatment.
Demographics and baseline characteristics are summarized in Table 1. Overall, the median age of patients was 59 (range 20–83) years; the majority of patients were white (70.5%) and male (65.4%). In total, 74 (94.9%) patients had CRC; 42 had KRASmt tumors and 32 had KRASwt tumors. Nearly all patients (96.2%) had stage IV disease at screening, and the median time from diagnosis to the first dose of study treatment was 41.8 (range 8.6–144.8) months. The median number of prior therapies received was five (range 1–14).
Table 1 Patient demographics and baseline characteristics3.2 Dose Levels and DLTsThe number of DLT-evaluable patients and those who experienced a DLT during the phase 1b dose-escalation is summarized by cohort in Supplementary Table 2. No MTD was identified, and two RP2Ds were selected for phase 2 (Supplementary Table 1). The first RP2D was selected for phase 2 cohort 1 (KRASwt CRC) and cohort 2 (KRASmt CRC) and consisted of maintenance doses of magrolimab at 30 mg/kg and cetuximab at 250 mg/m2. The second RP2D selected for phase 2 cohort 3 (KRASmt CRC) and consisted of maintenance doses of magrolimab 45 mg/kg and cetuximab 250 mg/m2. No DLTs were reported in the nine evaluable patients of the phase 2 cohort 1 safety run-in (KRASwt CRC). Subsequently, patient accrual continued for phase 2 cohort 1, and patient enrollment began for phase 2 cohort 2 (KRASmt CRC) and phase 2 cohort 3 (KRASmt CRC).
In total, two patients experienced DLTs during the DLT evaluation period of this study. The first patient enrolled in phase 1b cohort 1 (magrolimab 10 mg/kg and cetuximab 200 mg/m2), experienced grade 3 decreased platelet count on day 22, and discontinued study treatment. The event resolved on day 36 and was considered by the investigator to be related to magrolimab but not to cetuximab treatment. The second patient who experienced a DLT enrolled in phase 1b cohort 4 (magrolimab at 30 mg/kg and cetuximab at 250 mg/m2) and experienced grade 3 diarrhea on day 18. Study treatment was not suspended or discontinued. The event was not resolved by the end of this study and was deemed related to magrolimab treatment but not to cetuximab treatment by the investigator.
3.3 Safety and TolerabilityAll patients (100%) experienced at least one TEAE, and 66.7% of patients experienced a grade ≥ 3 TEAE (Table 2). Treatment-related AEs (TRAEs) were reported in 96.2% of patients, and grade ≥ 3 TRAEs were reported in 42.3% of patients (Table 3). Discontinuation of any study treatment owing to TRAEs occurred in 3.8% of patients (grade 3 decreased platelet count, grade 2 and 3 infusion-related reactions, and grade 2 maculopapular rash [patients may have discontinued owing to > 1 TRAE]).
Table 2 Treatment-emergent adverse events by magrolimab dose levelTable 3 Adverse effects related to either magrolimab or cetuximab treatment by magrolimab dose levelThe most commonly reported TRAEs were dermatitis acneiform (35.9%), infusion-related reactions (33.3%), dry skin (32.1%), fatigue (32.1%), and headache (29.5%). The most common Grade ≥ 3 TRAEs were anemia (11.5%), increased blood bilirubin (9.0%), and decreased lymphocyte count (9.0%).
Serious AEs (SAEs) were reported in 32.1% of patients. Two of these SAEs were fatal (grade 5 sepsis and grade 5 respiratory infection) and were considered unrelated to study treatment. There were no other deaths owing to TEAEs in the study.
Overall, two patients (2.6%), both in phase 1b cohort 4 (magrolimab at 30 mg/kg and cetuximab at 250 mg/m2), had dose reductions of magrolimab, and four patients had dose reductions of cetuximab (5.1%; two patients each in phase 1b cohort 4 [magrolimab at 30 mg/kg and cetuximab at 250 mg/m2] and phase 2 cohort 3 [magrolimab at 45 mg/kg and cetuximab at 250 mg/m2]). Missed/delayed doses of magrolimab owing to TEAEs occurred in six patients (7.7%; two each in phase 1b cohort 2 [magrolimab at 10 mg/kg and cetuximab at 250 mg/m2] and cohort 4 [magrolimab at 30 mg/kg and cetuximab at 250 mg/m2], and one each in phase 2 cohorts 1 [magrolimab at 30 mg/kg and cetuximab at 250 mg/m2] and 3 [magrolimab at 45 mg/kg and cetuximab at 250 mg/m2]). Missed/delayed doses of cetuximab owing to TEAEs occurred in seven patients (9.0%; two in phase 1b cohort 2 [magrolimab at 10 mg/kg and cetuximab at 250 mg/m2], three in phase 1b cohort 4 [magrolimab at 30 mg/kg and cetuximab at 250 mg/m2], and one each in phase 2 cohort 1 [magrolimab at 30 mg/kg and cetuximab at 250 mg/m2] and cohort 3 [magrolimab at 45 mg/kg and cetuximab at 250 mg/m2]).
3.4 Efficacy3.4.1 KRASwtIn patients with KRASwt CRC, two patients achieved a partial response resulting in an ORR of 6.3% (Fig. 1). One responder (three prior lines of systemic therapy) received maintenance doses of magrolimab at 10 mg/kg and cetuximab at 250 mg/m2, and the other responder (nine prior lines of systemic therapy; partial response to prior cetuximab-containing treatment) received magrolimab at 30 mg/kg and cetuximab at 250 mg/m2. The median DOR was 9.7 months (95% CI 7.0–12.5), and the DCR was 50.0% (95% CI 31.9–68.1).
Fig. 1
Change in tumor size by best response (RECIST 1.1) and KRAS status. CI, confidence interval; DCR, disease control rate; DOR, duration of response; KRASmt, KRAS mutant; KRASwt, KRAS wild-type; NA, not applicable; ORR, objective response rate; OS, overall survival; PD, progressive disease; PFS, progression-free survival; PR, partial response; RECIST, Response Evaluation Criteria in Solid Tumors; SD, stable disease. aPost-baseline tumor assessment data not available
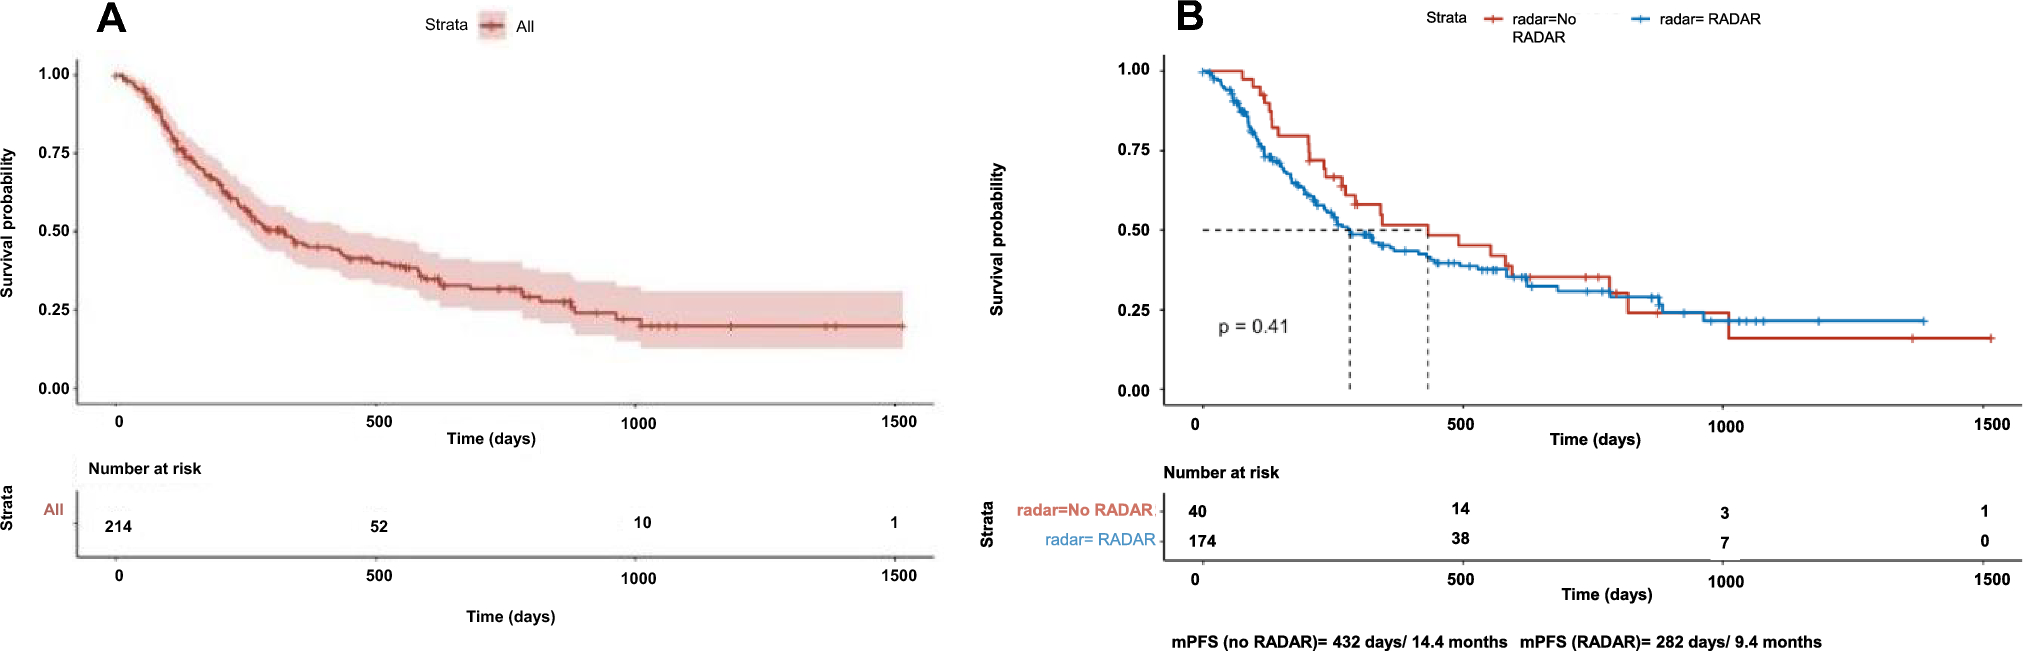
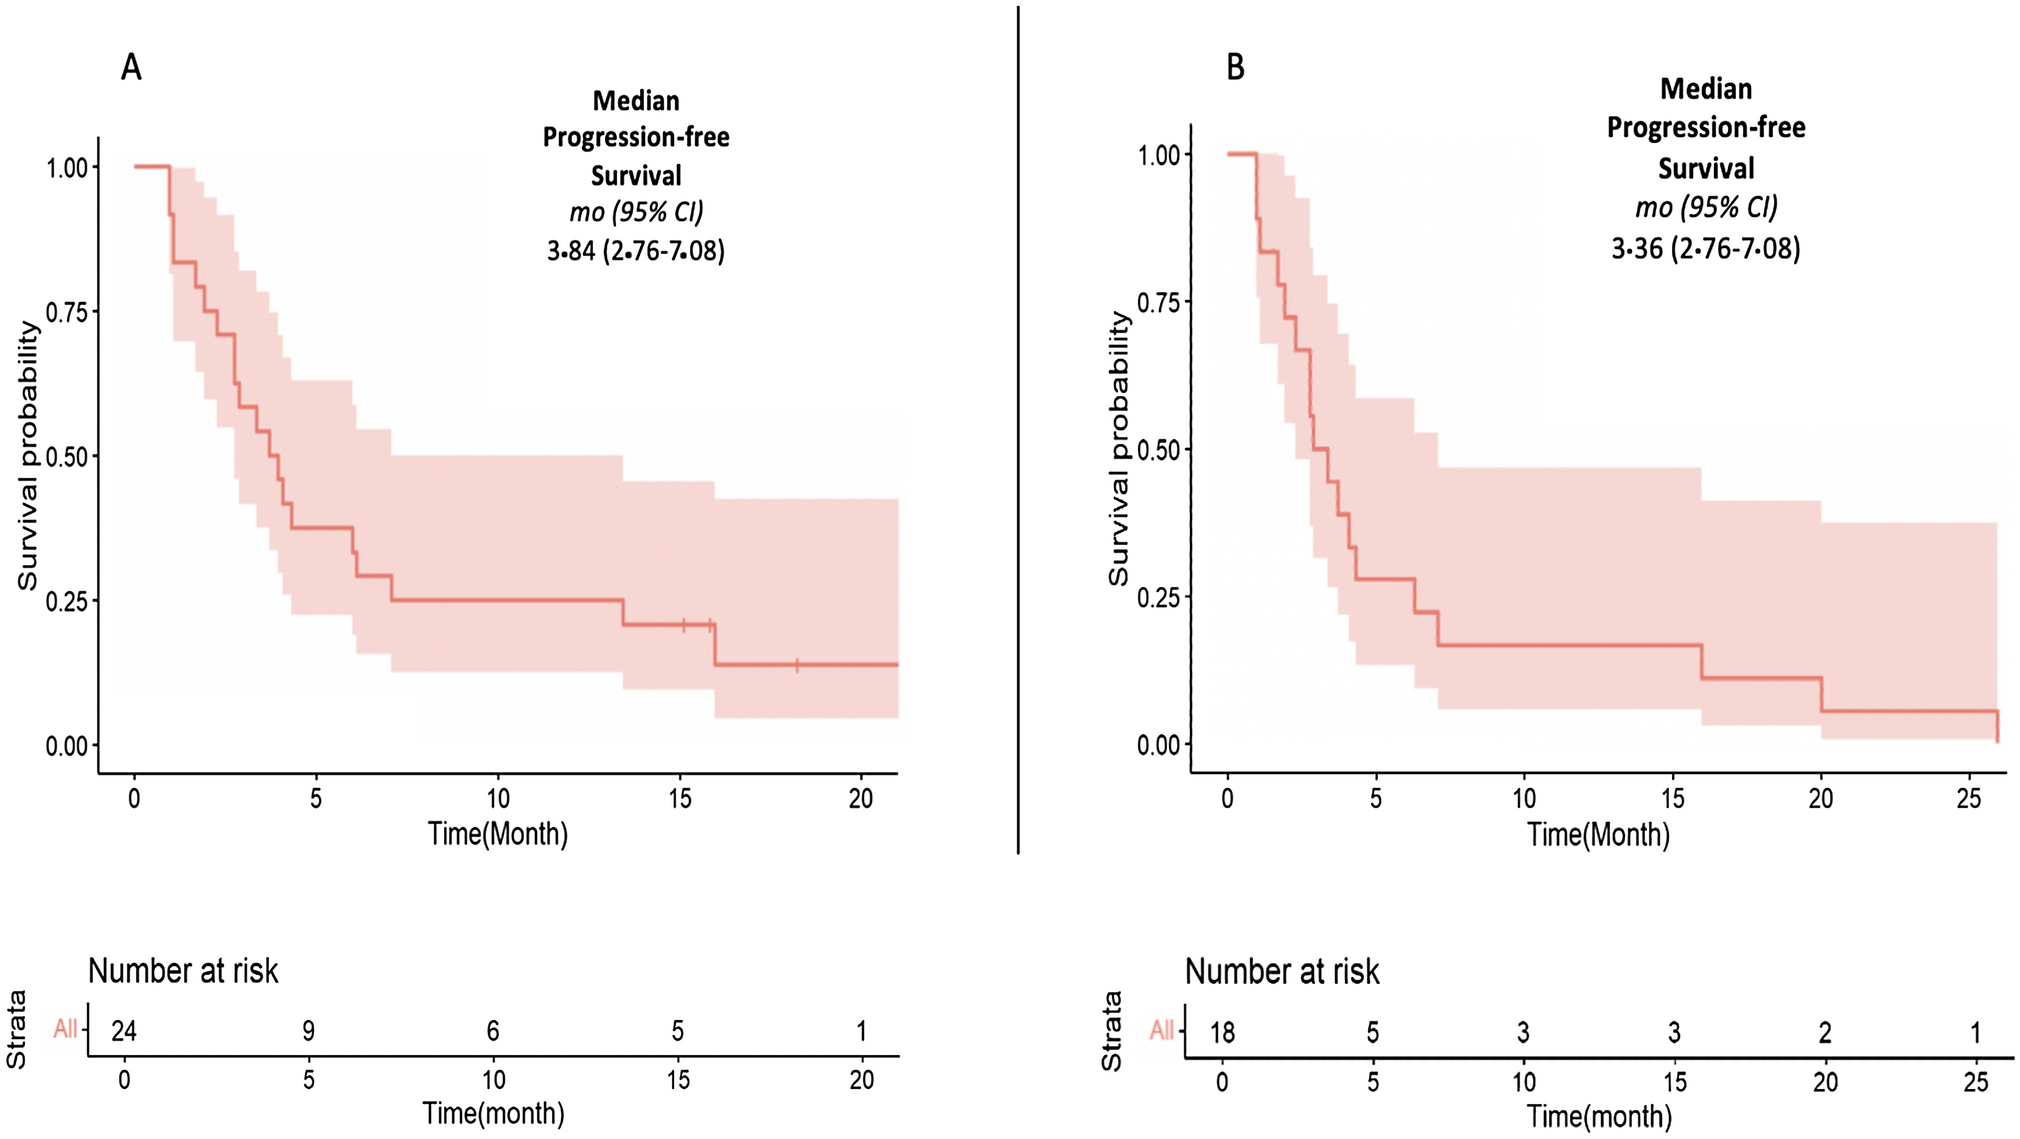
The median PFS was 3.6 months (95% CI 1.8–5.4; Supplementary Fig.2). All patients had either progressed or died at the time of cutoff. The median OS was 9.5 months (95% CI 5.9–12.6; Fig. 2); as of the cutoff date, 81.3% of patients had died.
Fig. 2
Kaplan–Meier curves for overall survival by KRAS type. CI, confidence interval; KRASmt, KRAS mutant; KRASwt, KRAS wild-type; OS, overall survival
3.4.2 KRASmtNo patients with KRASmt CRC achieved an objective response, but 38.1% achieved stable disease (SD), resulting in a DCR of 38.1% (95% CI 23.6–54.4). The median PFS was 1.9 months (95% CI 1.8–3.5; Supplementary Fig. 2), and 95.2% of patients either experienced PD or died as of the cutoff date. The median OS was 7.6 months (95% CI 5.4–11.7; Fig. 2), and 78.6% of patients died as of the cutoff date.
3.5 PK and ImmunogenicityThe PK analysis set included 1237 concentration values from 78 patients who received at least one dose of magrolimab and had at least one measurable concentration of magrolimab post-dose (Supplementary Fig. 3, Supplementary Table 3). After the magrolimab priming dose of 1 mg/kg on day 1, the mean Cmax was 0.496–1.02 μg/mL across all the doses and typically returned to below the quantifiable limit before the second dose (maintenance dose) was administered. Following IV infusion of 10–45 mg/kg, the mean serum magrolimab concentration showed a prolonged elimination phase after reaching Cmax.
Magrolimab exposure (measured by Cmax, AUClast, and AUCτ) increased in a dose-proportional manner over the dose range of 10–45 mg/kg. After the day 29 dosing, the Cmax, AUClast, and AUCτ increased by 6.3-, 5.0-, and 5.5-fold, respectively, over the 10–45-mg/kg magrolimab dose range. Magrolimab exposure generally increased by approximately twofold as measured by Cmax, AUClast, and AUCτ across dose levels between days 8 and 29, indicating minimal accumulation. PK parameters were similar in cohorts receiving the same magrolimab dose.
In the ADA analysis set, 77 of 78 patients had ADA-evaluable samples at baseline. Overall, 9.0% (7/78) of patients had at least one positive ADA result. Two patients tested positive for pretreatment ADAs to magrolimab, and 5 of 77 patients (6.5%) had treatment-induced ADAs to magrolimab. Of the five patients with treatment-emergent ADAs, three had persistent ADAs and two had transient ADAs. ADA incidence was not dose dependent and did not impact magrolimab PK or safety (Supplementary Table 4).
3.6 ImmunohistochemistryWe assessed T cell (CD3 and CD8) and macrophage (CD68) infiltration in the tumor microenvironment (TME) patients with mCRC who received magrolimab in combination with cetuximab (immunohistochemistry [IHC] analysis set). The paired biopsies (screen [pre-treatment] and cycle 2 day 8) from 19 patients were tested with IHC assays; however, only 15 patients were included in the IHC analysis (small tumor area during biopsy excluded four patients).
In total, 13 of the 15 patients in the IHC analysis set had KRASmt CRC (Supplementary Table 5). Overall, 4 patients had the best overall response of SD, and 10 patients had PD (response data were unavailable for one patient). Similar baseline percentages of CD3 T cells, CD8 T cells, and CD68 macrophages were observed between patients who achieved SD or PD (Supplementary Fig. 4C), indicating that baseline immune cell infiltrations were not associated with clinical response. No trend was observed for the effect of treatment on immune cell infiltrations overall and within each response category (Supplementary Fig. 4D).
Comments (0)