
Remember me

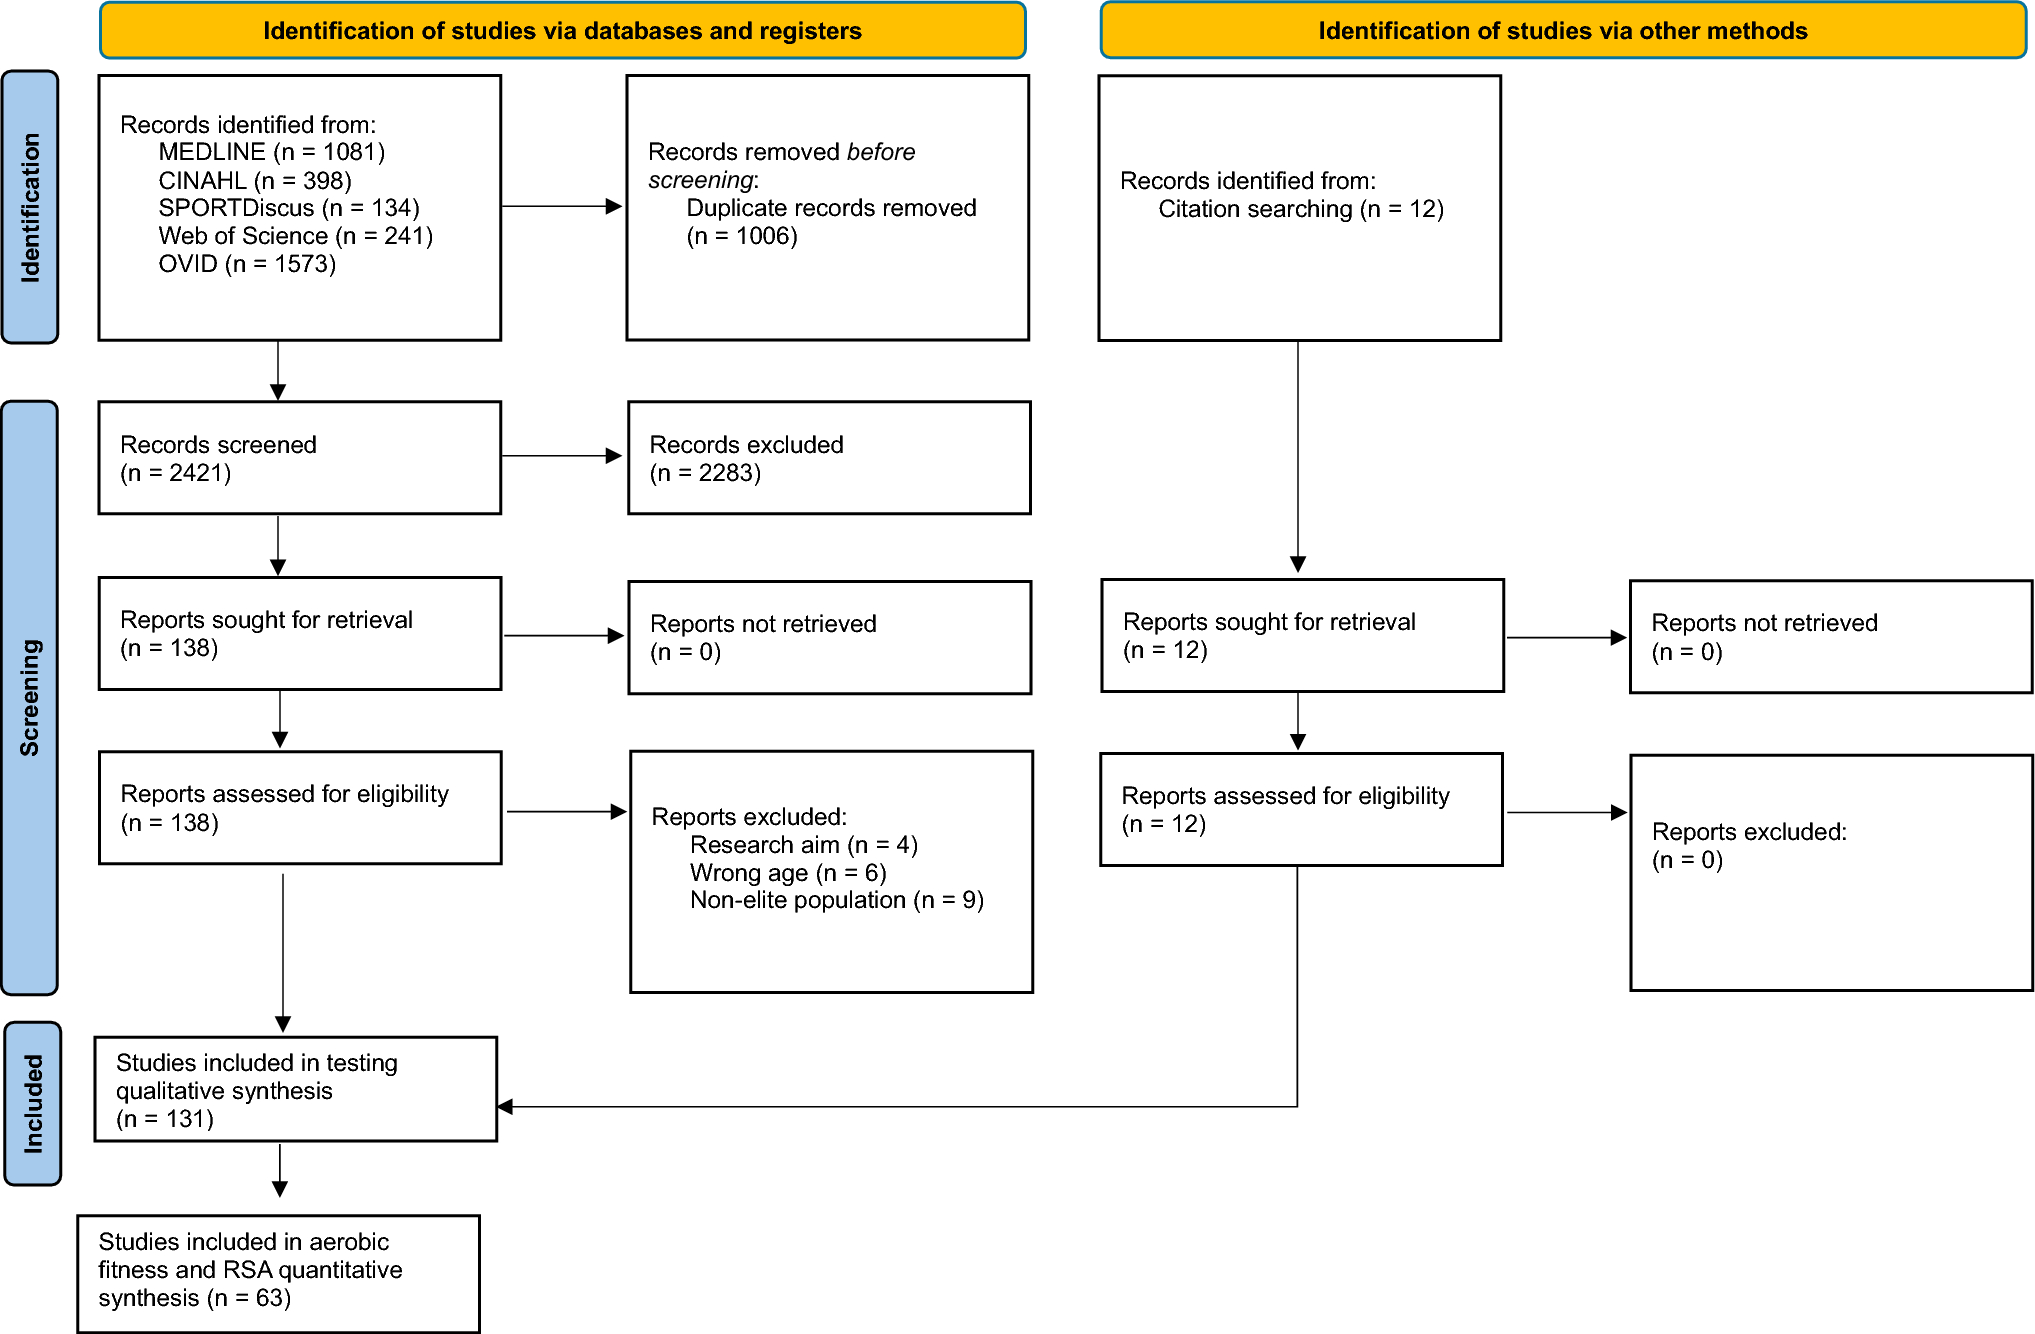


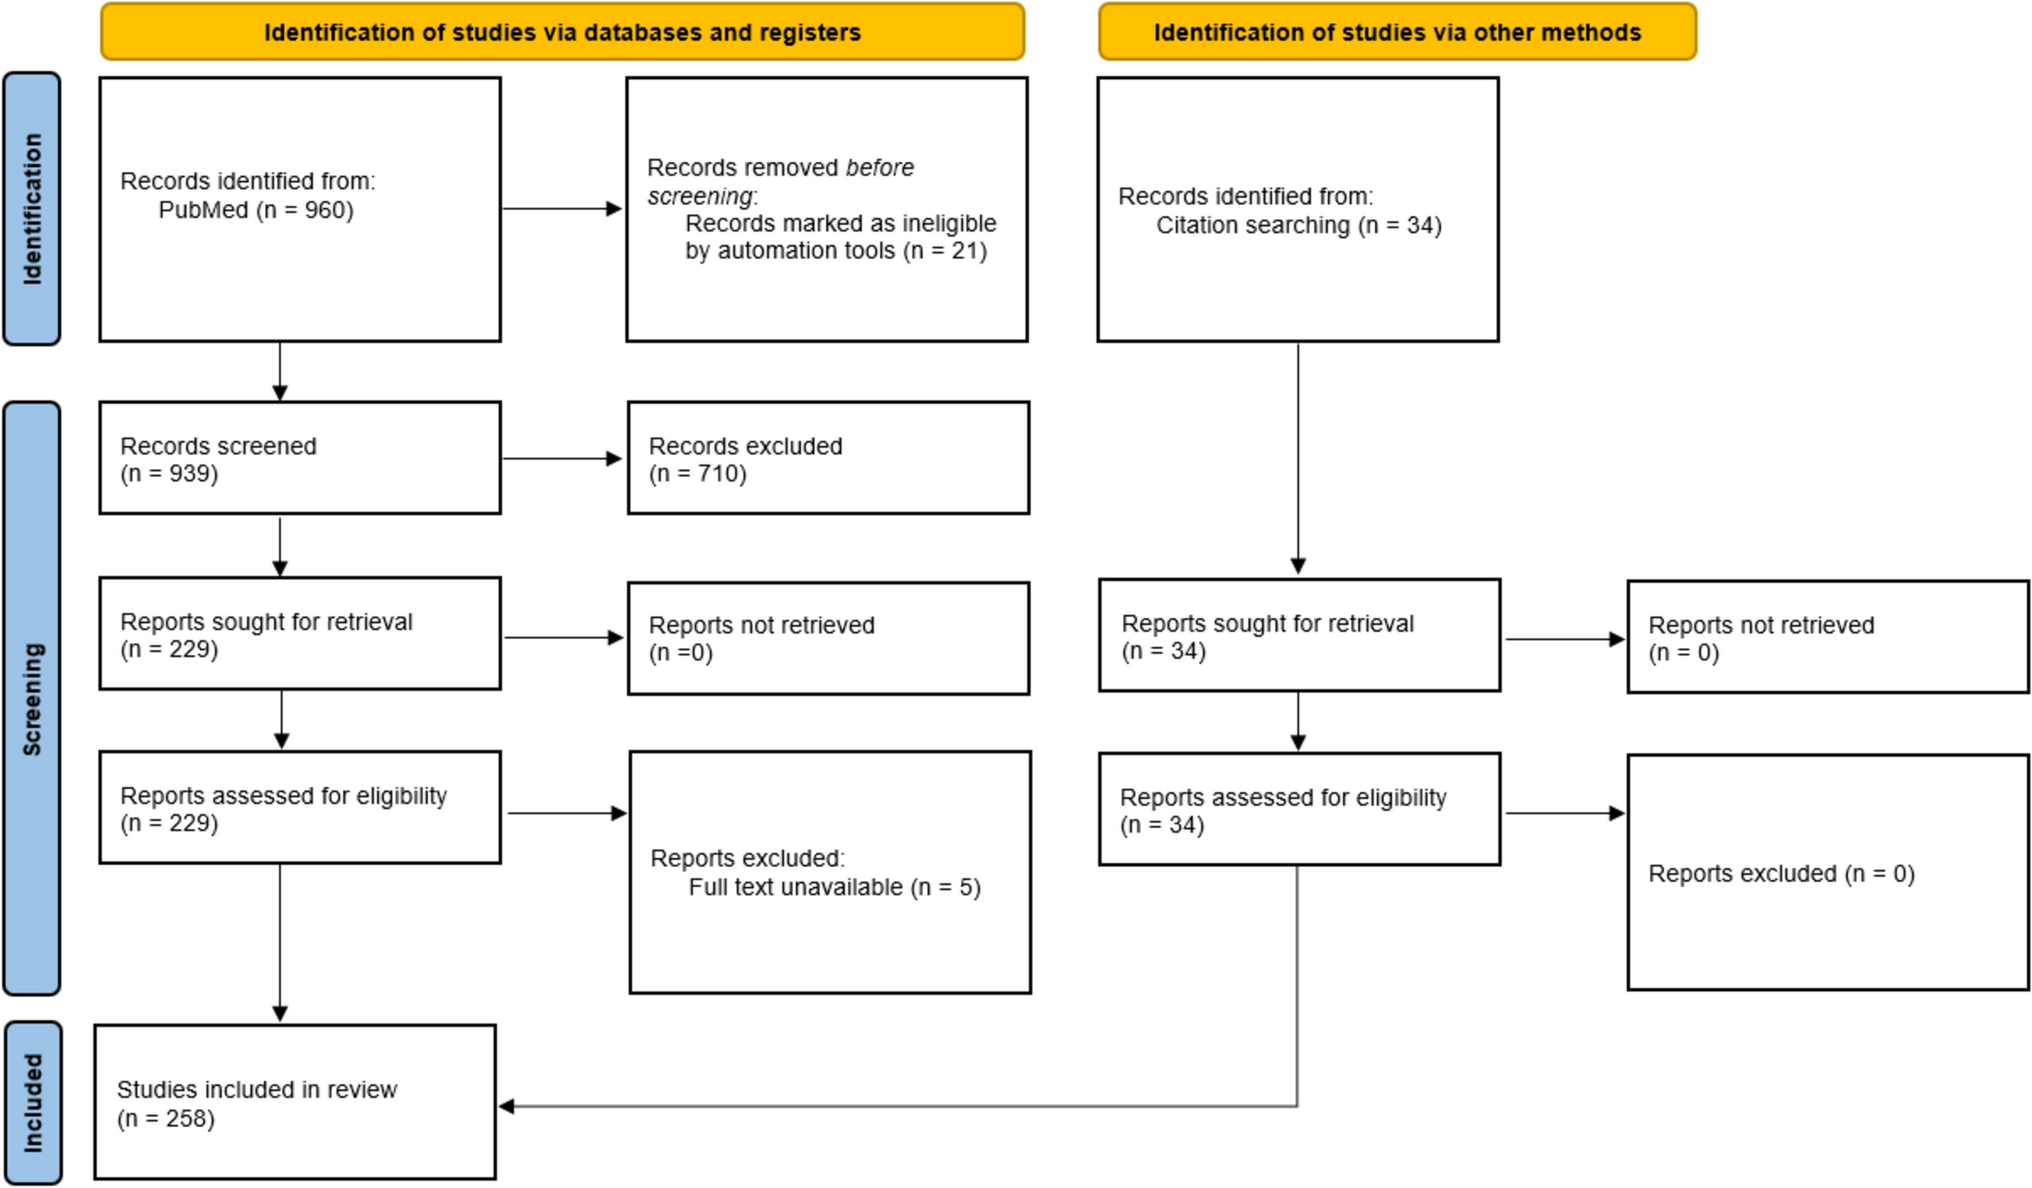
In total, 60 papers were included in the review (Fig. 1). There was excellent agreement between the two reviewers (R.B. and G.F.), with 1.8% of citations being ‘conflict’ cases for title/abstract screening and 29 papers at the full-text screening stage. All conflicts were resolved with discussion. Of the 169 records deemed eligible for full text screening, 4 full-text papers [36,37,38,39] were unable to be located and 4 [40,41,42,43] were embargoed theses. Reasons for exclusion at the full-text stage can be seen in Fig. 1. Reference list and citation review of included articles located one further paper for inclusion, and re-running the search on each main database prior to final analysis located ten further papers. Meta-analyses were not possible owing to the heterogeneity of the study designs, independent and dependent variables (such as methods of ball delivery), head acceleration measurement methods and locations of the head/mouthguard mounted accelerometers without consistent transformation to a frame of reference. One author was contacted regarding a suspected transcription error in the results table. The correct value was provided by the author on reviewing the results table for reporting in this review. No non-English papers meeting the inclusion criteria were found. A total of six studies [44,45,46,47,48,49] were included that did not specifically differentiate between purposeful headers and other ball-to-head impacts. These studies were included on the basis of defining ball-to-head impacts separately to other head impacts (head-to-ground or player-to-player) and/or as the vast majority (89–95%) of the impacts recorded were headers. The very small number of incidental ball-to-head impacts (~ 10% or less) included in those studies would be unlikely to change the results. In cases where a range of different head impacts were included and differentiated, only the data for header impacts were extracted.
Fig. 1 3.2 Risk of Bias and Quality Assessments
Results are presented in Figs. 2 and 3 and in Tables 4 and 5. Figure 4 shows the results of RoB and quality assessment grouped for each of the different independent variables. Considerable variability for RoB and quality assessment scoring across the papers was identified. All initial conflicts were resolved with discussion between the two independent reviewers (R.B. and A.Z.). The four RCT papers [17, 50,51,52] were all scored as ‘some concerns’, with bias around the randomisation and selection of the reported results being common issues. Of the seven studies assessed using the ROBINS-I tool, three studies [53,54,55] were considered at serious RoB, commonly owing to confounding factors, while the remaining five studies were all at moderate RoB [56,57,58,59,60].
Fig. 2
Risk of bias (ROB)2 assessments of RCTs [103]
Fig. 3
Risk of bias in non-randomised studies of interventions (ROBINS-I) assessments of non-randomised intervention studies [103]
Table 4 AXIS tool scores of cross-sectional studiesTable 5 Modified Downs and Black scores of cohort and one-off measurement with variables studiesFig. 4
Risk of bias/quality assessment results shown grouped for the different variables explored. Numbers within the bars represent the number of studies
The seven cross-sectional studies assessed using the AXIS tool showed varying levels of quality. In total, two [61, 62] were scored as ‘excellent’ quality, four [63,64,65,66] were ‘good’ quality, and one [67] was ‘fair’ quality. The two most common questions answered as ‘no’ or ‘not reported’ related to the justification of sample size (only completed in one cross-sectional study [61]) and the selection of participants being representative of the target population. Most (n = 41, 68%) studies were assessed using the modified Downs and Black tool, with results ranging from 39 to 90%. In total, 19 studies (46%) were ‘good’ quality [44, 45, 68,69,70,71,72,73,74,75,76,77,78,79,80,81,82,83,84], 20 studies (49%) were ‘fair’ quality [46,47,48,49, 85,86,87,88,89,90,91,92,93,94,95,96,97,98,99,100] and two studies (5%) were ‘poor’ quality [101, 102]. The accuracy of the measurement of head acceleration, the representativeness of the sample, the reporting of potential adverse events and the presence of sufficient power to detect relationships were items that were commonly scored as ‘no’ on this tool.
3.3 Study Characteristics/Methods of Included StudiesThe 60 studies had various study designs, participant demographics and data collection methods (Fig. 5, Appendix V). The methods of delivering heading trials and measuring head acceleration varied. The most common methods of ball delivery were live games/trainings (35%), ball launching devices (31%) and hand-thrown balls (19%). Head acceleration was mostly measured using a head mounted inertial measurement unit (IMU), usually consisting of a tri-axial accelerometer with or without a gyroscope (52%). Following this, 27% of studies used an instrumented mouthguard (iMG) or biteplate, usually consisting of a tri-axial accelerometer with or without a gyroscope, with one paper using a combination of a head mounted IMU and an iMG. The remaining studies used a skin-mounted accelerometer over the mastoid process, three-dimensional (3D) motion capture/video analysis or an ear-plug accelerometer. Of the 60 studies included, only 18 studies transformed accelerometer data to a frame of reference (mainly centre of gravity of the skull), which is necessary to standardise data to account for different locations of accelerometer devices [104]. Finally, included studies reported varying measures of head acceleration from three possible variables (LA, RA/AA and RV/AV). In total, 20 studies reported LA only, 16 studies reported LA and RA/AA, 5 studies reported LA and RV/AV and 11 studies reported all three variables.
Fig. 5
Study design, participants and methods. The figure represents the number of studies for each variable. one study used combined instrumented mouthguard and head mounted IMU; therefore, the HA measurement device section of this graph sums to 61 rather than 60 as all other sections. HA head acceleration, IMU inertial measurement unit
3.4 Factors Affecting Head AccelerationThe results are grouped in categories of factors affecting head acceleration. Tables 6, 7, 8, 9, 10, 11, 12 review the results of each study. The narrative review accompanies this to outline key findings, agreement in the literature and where conflicting evidence is present. Several studies are included in more than one table where the study investigated more than one independent variable. Of note, no studies were identified that investigated sensorimotor factors such as cervical spine proprioception, oculomotor control and vestibular function and their relationship to head acceleration when performing a header.
3.4.1 Ball Characteristics and SpeedIn total, 16 studies investigated the effect of ball speed and ball characteristics (Table 6) [52, 63, 78,79,80, 85,86,87, 91, 93,94,95, 97,98,99,100]. Agreement was seen across studies that head acceleration increased with increasing ball speed/velocity, with only 2 [80, 97] of the 12 studies rejecting this trend. Across the 12 studies that investigated the effect of ball speed, 6 [80, 85,86,87, 91, 97] undertook statistical analysis to investigate the relationship between ball speeds/velocities and resulting head acceleration (LA and/or RA/AA and/or RV/AA), while the remaining 6 [52, 63,
Comments (0)