
Remember me

In August 2023, a 61-year-old female patient presented to her general physician with right-side abdominal pain that had persisted for more than 2 weeks. Plain computed tomography (CT) revealed a liver mass; therefore, the patient was referred to our hospital. The patient did not have a relevant medical history. Laboratory findings at the initial presentation indicated slight liver dysfunction (aspartate aminotransferase, 34 IU/L; alanine aminotransferase, 33 IU/L; gamma-glutamyl transferase, 46 mg/dL) and increased tumor marker levels (carcinoembryonic antigen, 5.7 mg/dL; carbohydrate antigen 19–9, 55.9 mg/dL).
Abdominal contrast-enhanced CT (CECT) revealed multiple liver lesions. The largest lesion, which was located in liver segment 6, had a 60-mm diameter and exhibited ring enhancement in the arterial phase and delayed contrast enhancement in the equilibrium phase. In addition, multiple enlarged abdominal lymph nodes were observed, suggesting lymph node metastases. Chest CT revealed multiple lung lesions consistent with metastatic disease (Fig. 1a–c). Positron emission tomography (PET) with 2-deoxy-2-[fluorine-18] fluoro-D-glucose combined with CT (18F-FDG PET/CT) revealed hypermetabolic lesions in the liver, lungs, and lymph nodes (Fig. 2a–c). To establish a definitive diagnosis, a percutaneous ultrasound-guided biopsy of the liver tumor was performed. Pathological examination (Fig. 3 a–d) confirmed the diagnosis of moderately to poorly differentiated ICC. The tumor was positive for CA19-9 and negative for Hep-par1 (Fig. 3d).
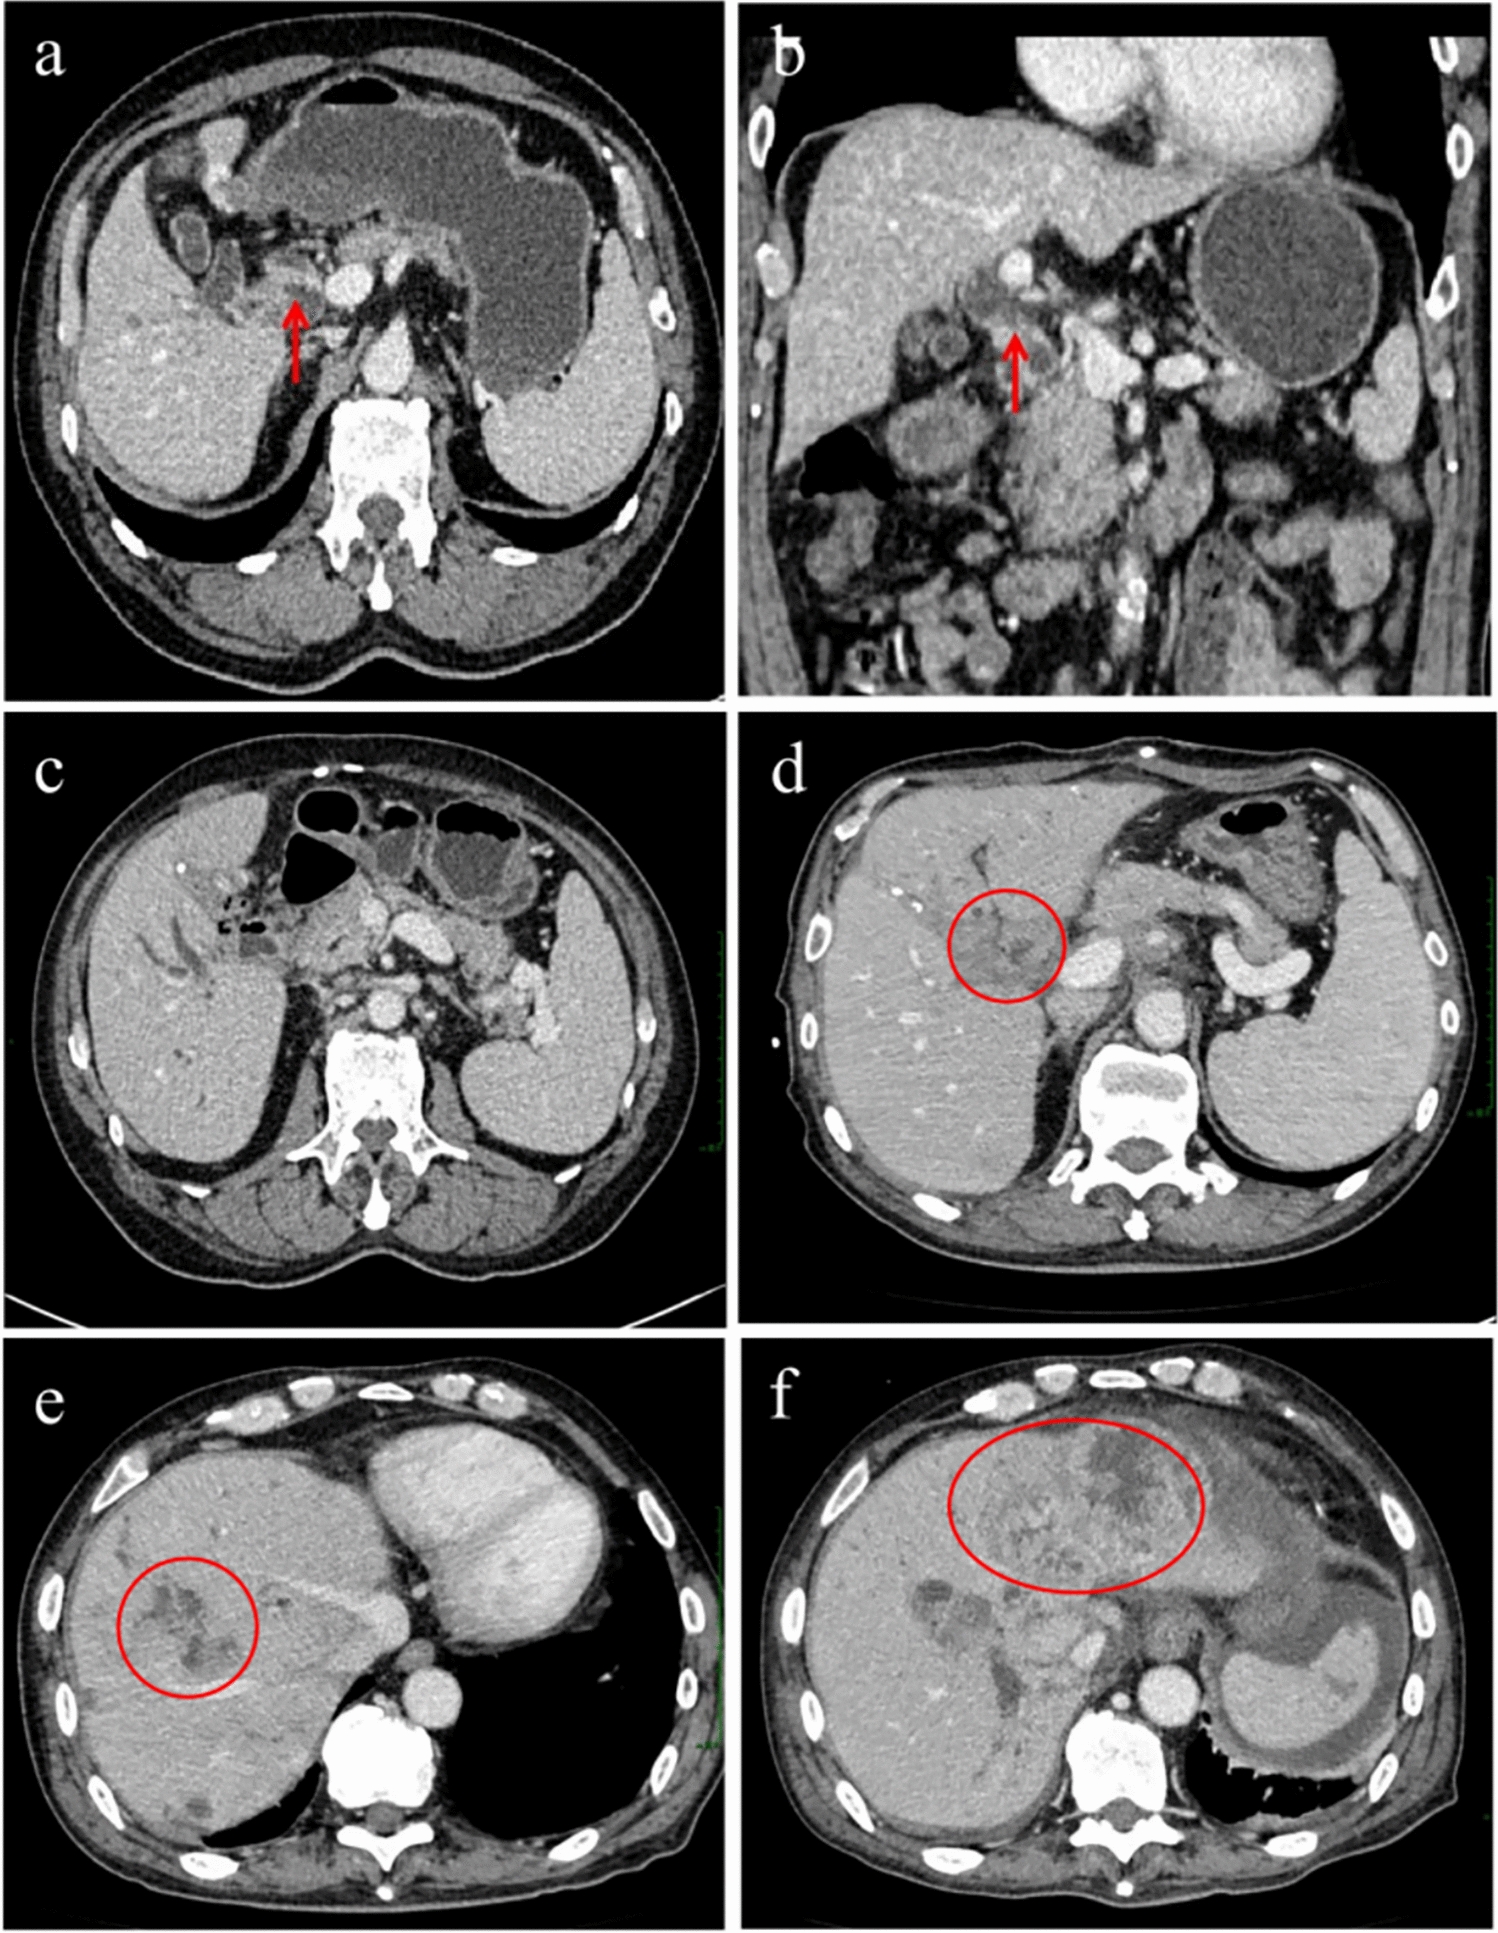
Fig. 1
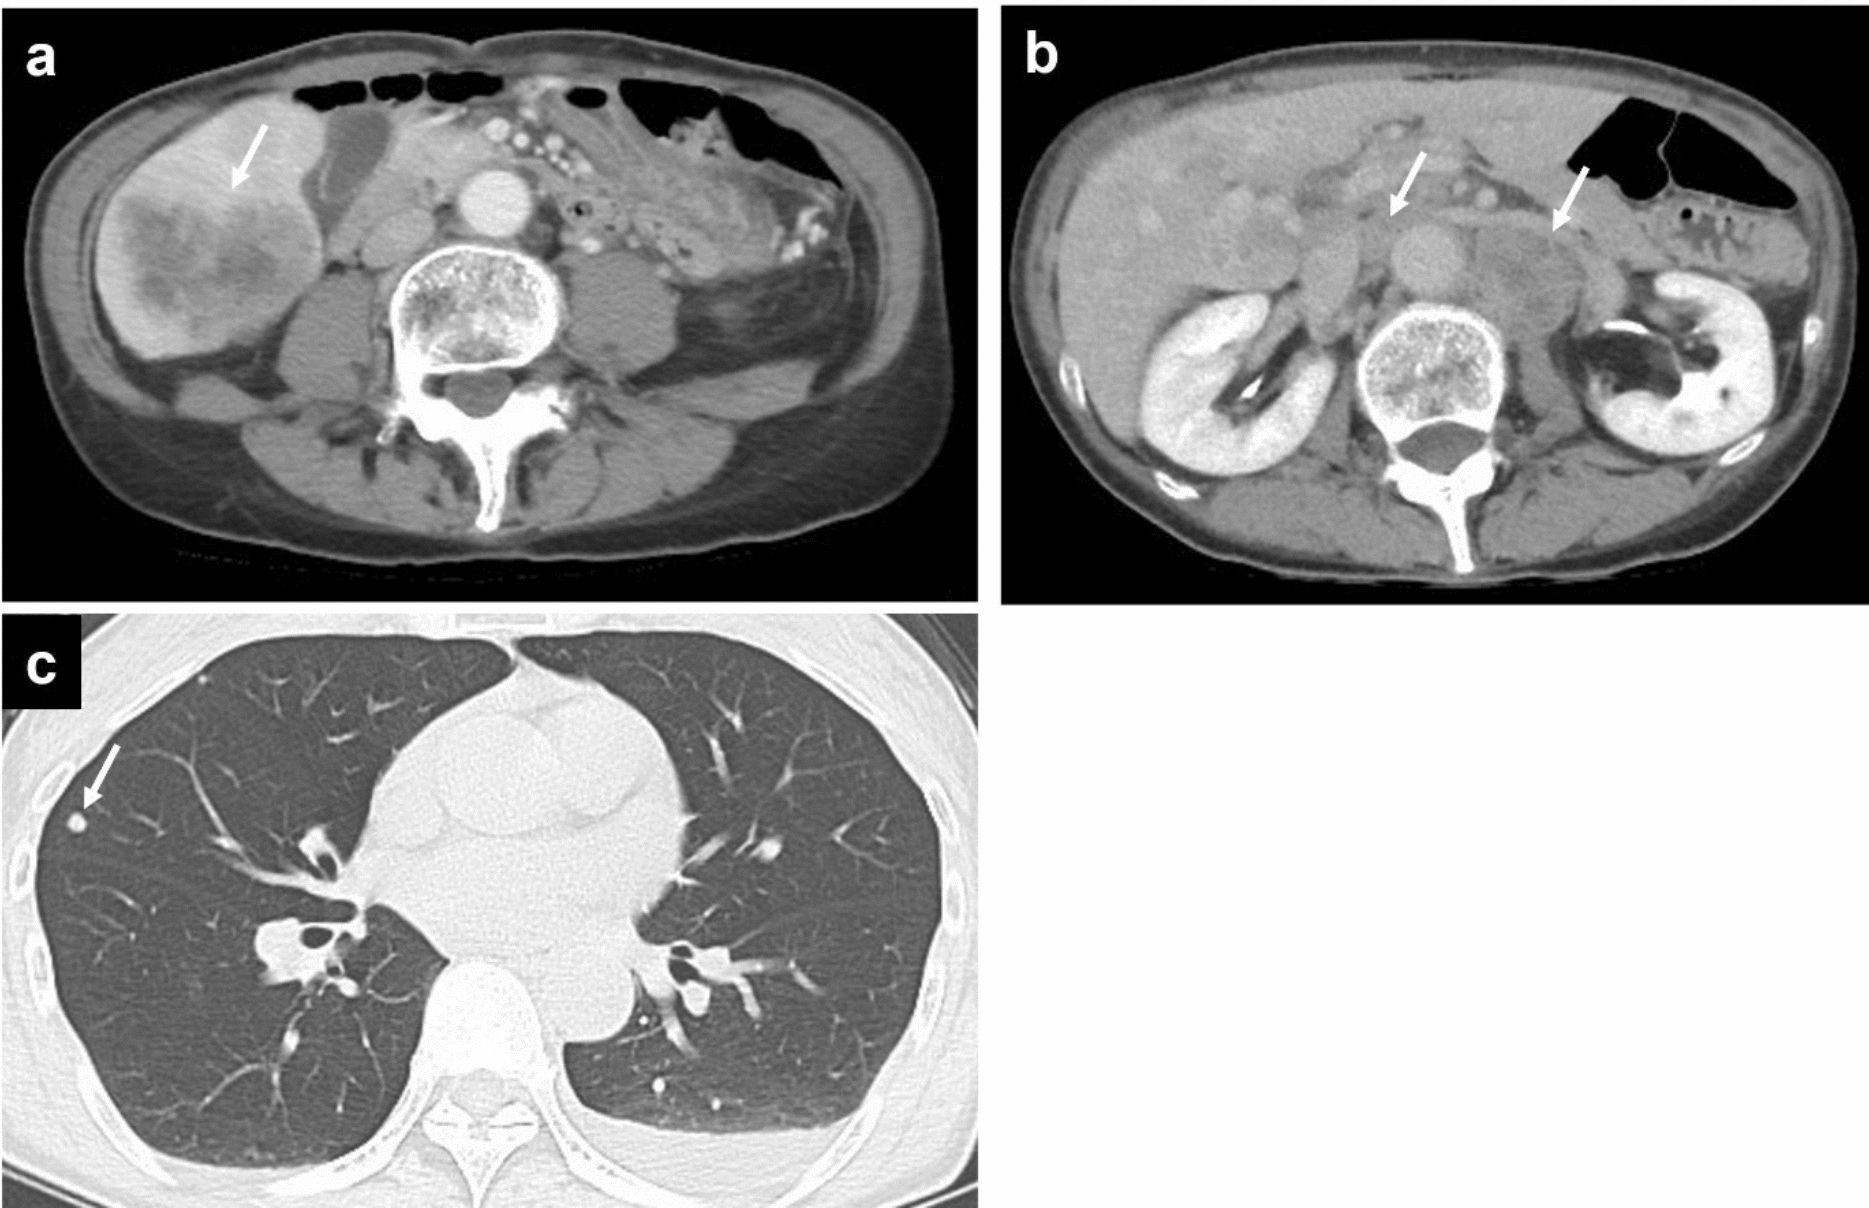
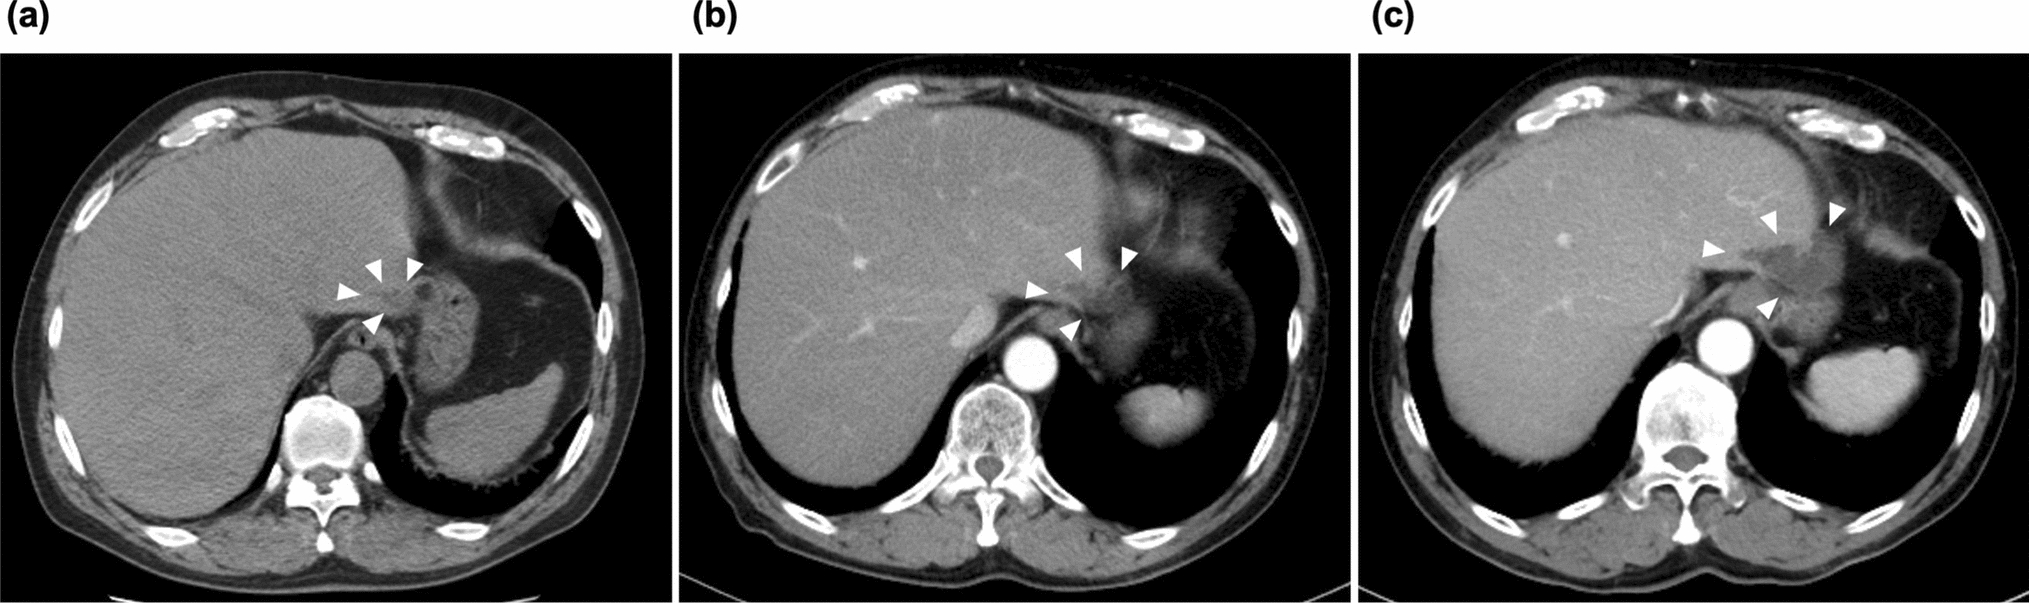
Abdominal and chest contrast-enhanced computed tomography (CT). a A 6-cm-diameter liver tumor in segment 6 is observed in the portal venous phase with contrast-enhanced CT (arrow). b A swollen para-aorta lymph node is observed in the equilibrium phase with contrast-enhanced CT (arrows). c Lung metastases are observed with chest CT (arrow)
Fig. 2
Whole-body positron emission tomography with 2-deoxy-2-[fluorine-18] fluoro-D-glucose combined with computed tomography (18F-FDG PET/CT). Hypermetabolic lesions in the liver (a: arrow), lungs (b: arrow), and lymph nodes (b: arrowheads; c: arrows) are observed
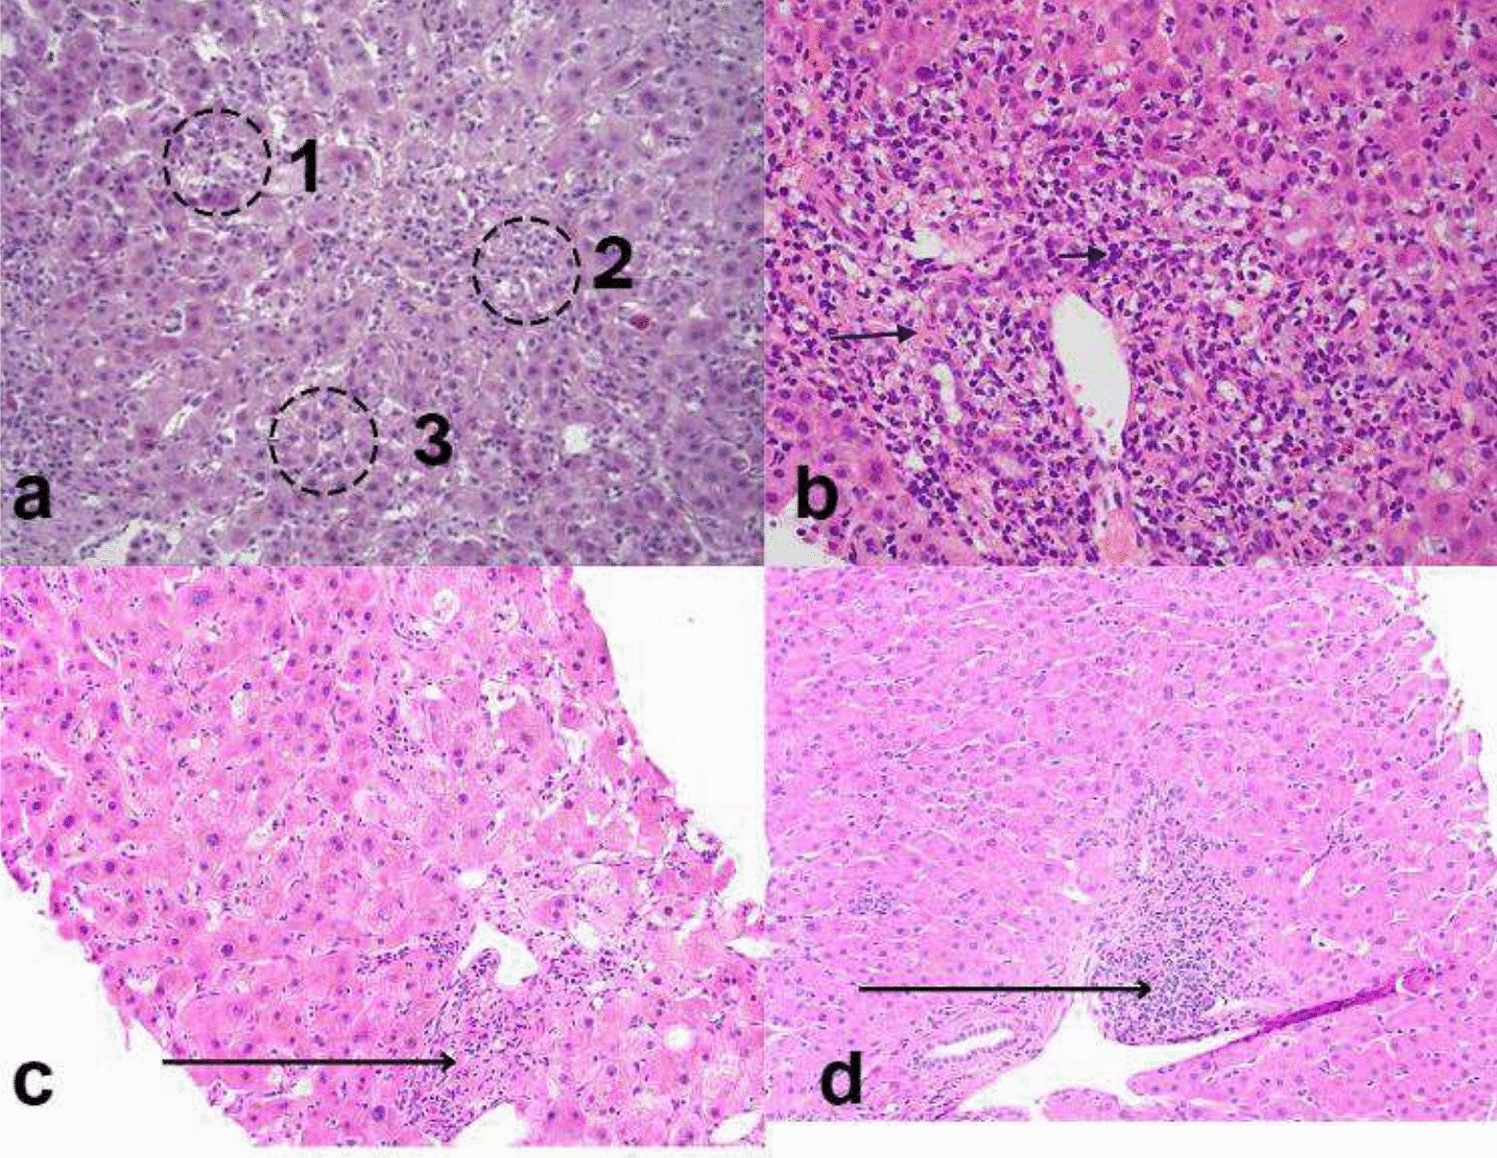
Fig. 3
Histopathology and tumor immune microenvironment of the tumor specimen before treatment. a Loupe image of the biopsy specimen. Scale bar: 1 mm. The specimen contains an area of (b) moderately to poorly differentiated adenocarcinoma proliferating in a cribriform pattern and solid nests with higher increased T-cell infiltration (area 1, total T cell: 929 cells/mm2, CD8 T cell: 687 cells/mm2, Treg/CD8 ratio: 0.27) and an area of (c) moderately differentiated tubular adenocarcinoma associated with fibrotic stroma and lower lymphocytic infiltration (area 2, total T cell: 372 cells/mm2, CD8 T cell: 230 cells/mm2, Treg/CD8 ratio: 0.35). Scale bar: 100 μm. Arrow heads indicate Foxp3+CD3+CD8− Treg cells. d Inset of (b) is shown. Infiltrating T cells are mainly comprised CD8 T cells. Scale bar: 50 μm. e Immunohistochemistry for Hep-par1 and CA19-9. Scale bar: 100 μm
Genomic profiling using next-generation sequencing identified mutations in TP53 and DNMT, encoding DNA methyltransferase, as actionable genetic abnormalities. However, no druggable genetic abnormalities, including microsatellite instability-high (MSI-H), were detected. The tumor mutation burden was calculated as 1.26 mutations per megabase, indicating a relatively low tumor mutational burden.
TIME status in pre-treatment tumor biopsy: The immune microenvironment of tumor was examined by multiplex immunohistochemistry as we had previously reported with hepatocellular carcinoma (HCC) samples [4]. Since the T-cell infiltration data are not currently available for advanced ICC, we provisionally compared the results with data from advanced HCC [4]. The tumor contained areas of moderately to poorly differentiated adenocarcinoma proliferating in a cribriform pattern and solid nests with higher lymphocytic infiltration (area 1, Fig. 3b), moderately differentiated tubular adenocarcinoma with fibrotic stroma and lower lymphocytic infiltration (area 2, Fig. 3c), and necrosis. The infiltrating T cells were mainly CD8 T cells (total T cell: 929 cells/mm2, CD8 T cell: 687 cells/mm2 in area 1, and total T cell: 372 cells/mm2, CD8 T cell: 230 cells/mm2 in area 2), which were much higher the median of those observed in advanced HCC cases (median of total T cell: 118 cells/mm2, median of CD8 T cell: 70 cells/mm2) (4). The frequency of regulatory T cells (Treg) evaluated as Treg/CD8 ratio (0.27 in area 1 and 0.32 in area 2) was around the median of Treg/CD8 ratio (0.30) that we have observed in a cohort of advanced HCC (4) (Fig. 3e).
Based on the findings, GCD therapy (gemcitabine, 1000 mg/m2, intravenous [IV] infusion, days 1 and 8; cisplatin, 25 mg/m2, IV infusion, days 1 and 8; and durvalumab, 1500 mg/body, IV infusion, day 1) was initiated (Fig. 4). After three cycles of GCD therapy, CECT revealed a marked reduction in the tumor size and loss of contrast enhancement, and lung and lymph node metastases completely disappeared. After six cycles, CECT demonstrated further tumor shrinkage, and lung and lymph node metastases still completely disappeared. After eight cycles, 18F-FDG PET/CT revealed slight residual metabolic activity in the liver tumor, and lung and lymph node metastases did not exhibit FDG uptake.
Fig. 4
Clinical course including combined immunotherapy, surgery, and radiological examination schedules and tumor marker findings. CA19-9, carbohydrate antigen 19–9; CEA, carcinoembryonic antigen; GCD, gemcitabine, cisplatin, and durvalumab; G-GSF, granulocyte colony-stimulating factor
After completing eight cycles of GCD therapy, maintenance therapy with durvalumab monotherapy was initiated according to the manufacturer’s recommendations. After two cycles of maintenance therapy, the tumor marker levels returned to normal limits, and a partial treatment response was observed. Although grade 3 neutropenia developed after five cycles of GCD therapy, no immune-related adverse event was observed. This treatment-related adverse event was managed by reducing the gemcitabine dose to 80% and administering granulocyte colony-stimulating factor, thus enabling treatment continuation. 18F-FDG PET–CT images in pretreatment and post eight cycles of GCD therapy showed no viable lesions except in the liver (Fig. 5).
Fig. 5
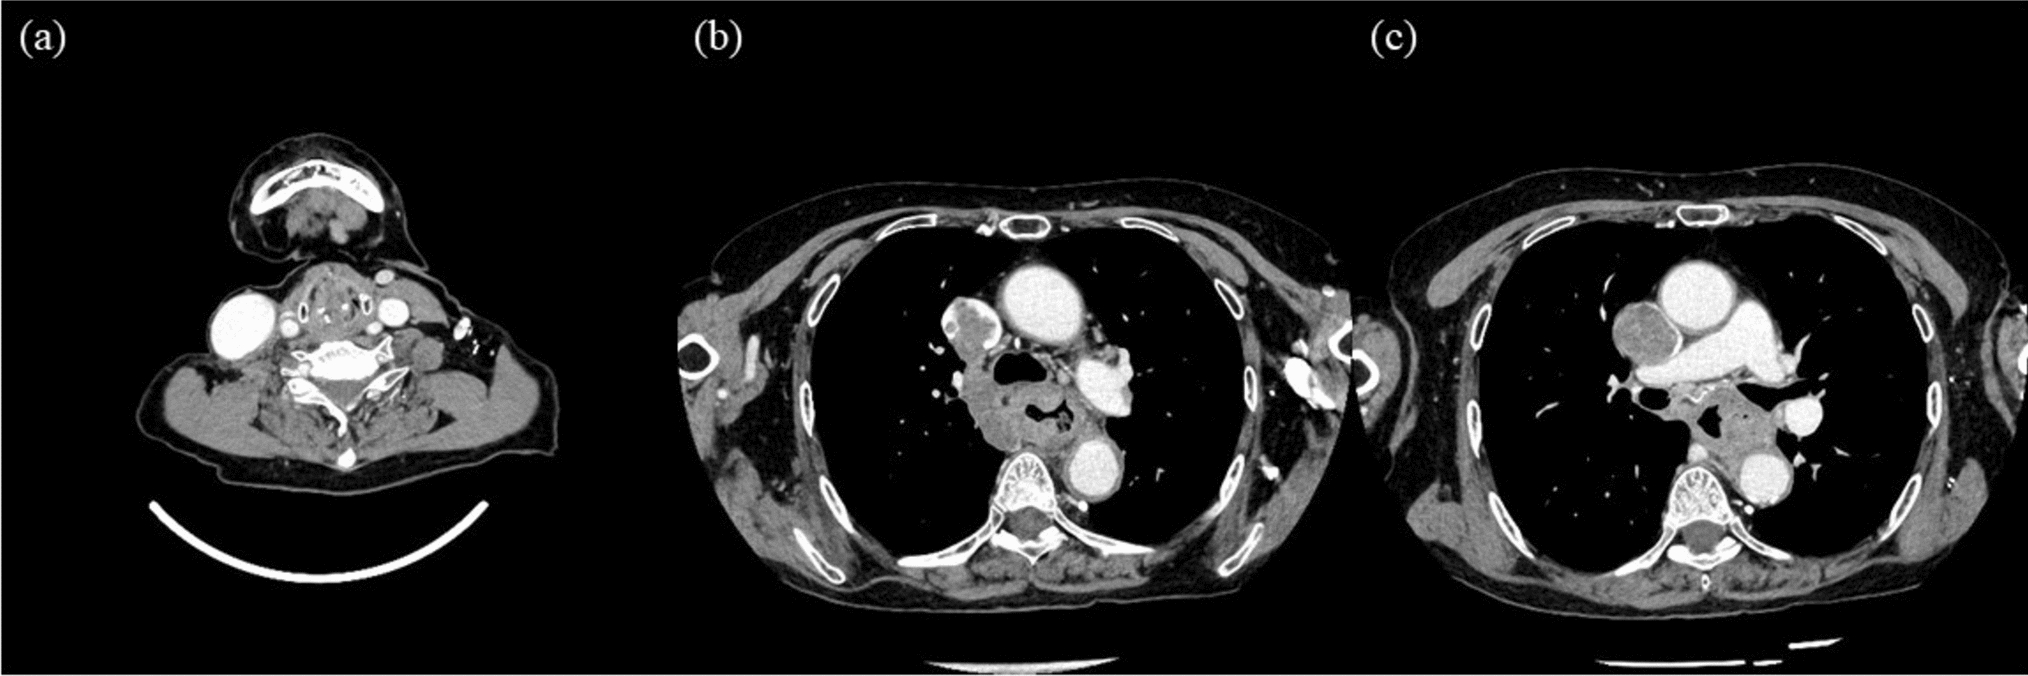
Temporal changes of PET–CT images in lesions before and after gemcitabine plus cisplatin combined with durvalumab (GCD) therapy. (a–c) pretreatment PET–CT images, (d–f) posttreatment (after 8 cycles) PET–CT images. a Hypermetabolic lesions in lung (arrow) and mediastinum lymph nodes (arrow heads) are identified. b Hypermetabolic lesions in abdominal lymph nodes (arrows) are identified. c Hypermetabolic lesion in liver (SUV-max value: 12.73) is identified. d No hypermetabolic lesions in lung and mediastinum lymph nodes are identified. e No hypermetabolic lesions in abdominal lymph nodes are identified. f Slight hypermetabolic lesion in liver (SUV-max value: 3.33) is identified (arrow)
After two cycles of maintenance durvalumab therapy, the patient underwent partial hepatectomy of liver segment 6. A postoperative pathological examination (Fig. 6a–d) confirmed poorly differentiated carcinoma with negative surgical margins (R0 resection). The resected tumor was composed of tumor cells with increased cellular atypia compared to those observed in the pretreatment tumor biopsy, and differentiated component characterized by tubule formation was not observed. Immunohistochemistry revealed that the tumor cells were diffusely positive for CK19 and EMA, focally and weakly positive for HepPar-1, and negative for arginase-1, thus supporting its cholangiocytic phenotype.
Fig. 6
Histopathology and tumor immune microenvironment of the resected tumor after treatment. a Loupe image of the resected tumor. The regression bed (double arrow), tertiary lymphoid structure (arrowhead), and band-like lymphocytic infiltration are shown. Scale bar: 2 cm. b Tumor is composed of poorly differentiated carcinoma with increased T-cell infiltration (total T cell: 1426 cells/mm2, CD8 T cell: 1393 cells/mm2, Treg/CD8 ratio: 0.016). Scale bar: 100 μm. c Immunohistochemistry results of CK19, EMA, HepPar-1, arginase-1, and CA19-9. Scale bar: 100 μm. d Inset of (b) is shown. Infiltrating T cells are mainly composed of CD8 T cells with a low ratio of regulatory T cells to CD8 T cells. Scale bar: 50 μm. Arrow heads indicate Foxp3+CD3+CD8− Treg cells
TIME status of resected tumor: We further analyzed the TIME of post-treatment tumor. A regression bed characterized by dense fibrosis was observed around the residual viable tumors and associated with the formation of tertiary lymphoid structure (TLS). Increased infiltration of T cells was observed within the viable tumor tissue (total T cell: 1426 cells/mm2, CD8 T cell: 1393 cells/mm2). These infiltrating T cells were mainly CD8 T cells, and the Treg/CD8 ratio was quite low (Treg/CD8 ratio: 0.016) (Fig. 6d) when compared to the pre-treatment biopsy.
The patient was discharged 7 days postoperatively. No additional adjuvant therapy was administered, and follow-up evaluations at 3-month intervals were scheduled. Since that time, the patient has remained free of tumor recurrence.
Comments (0)