
Remember me


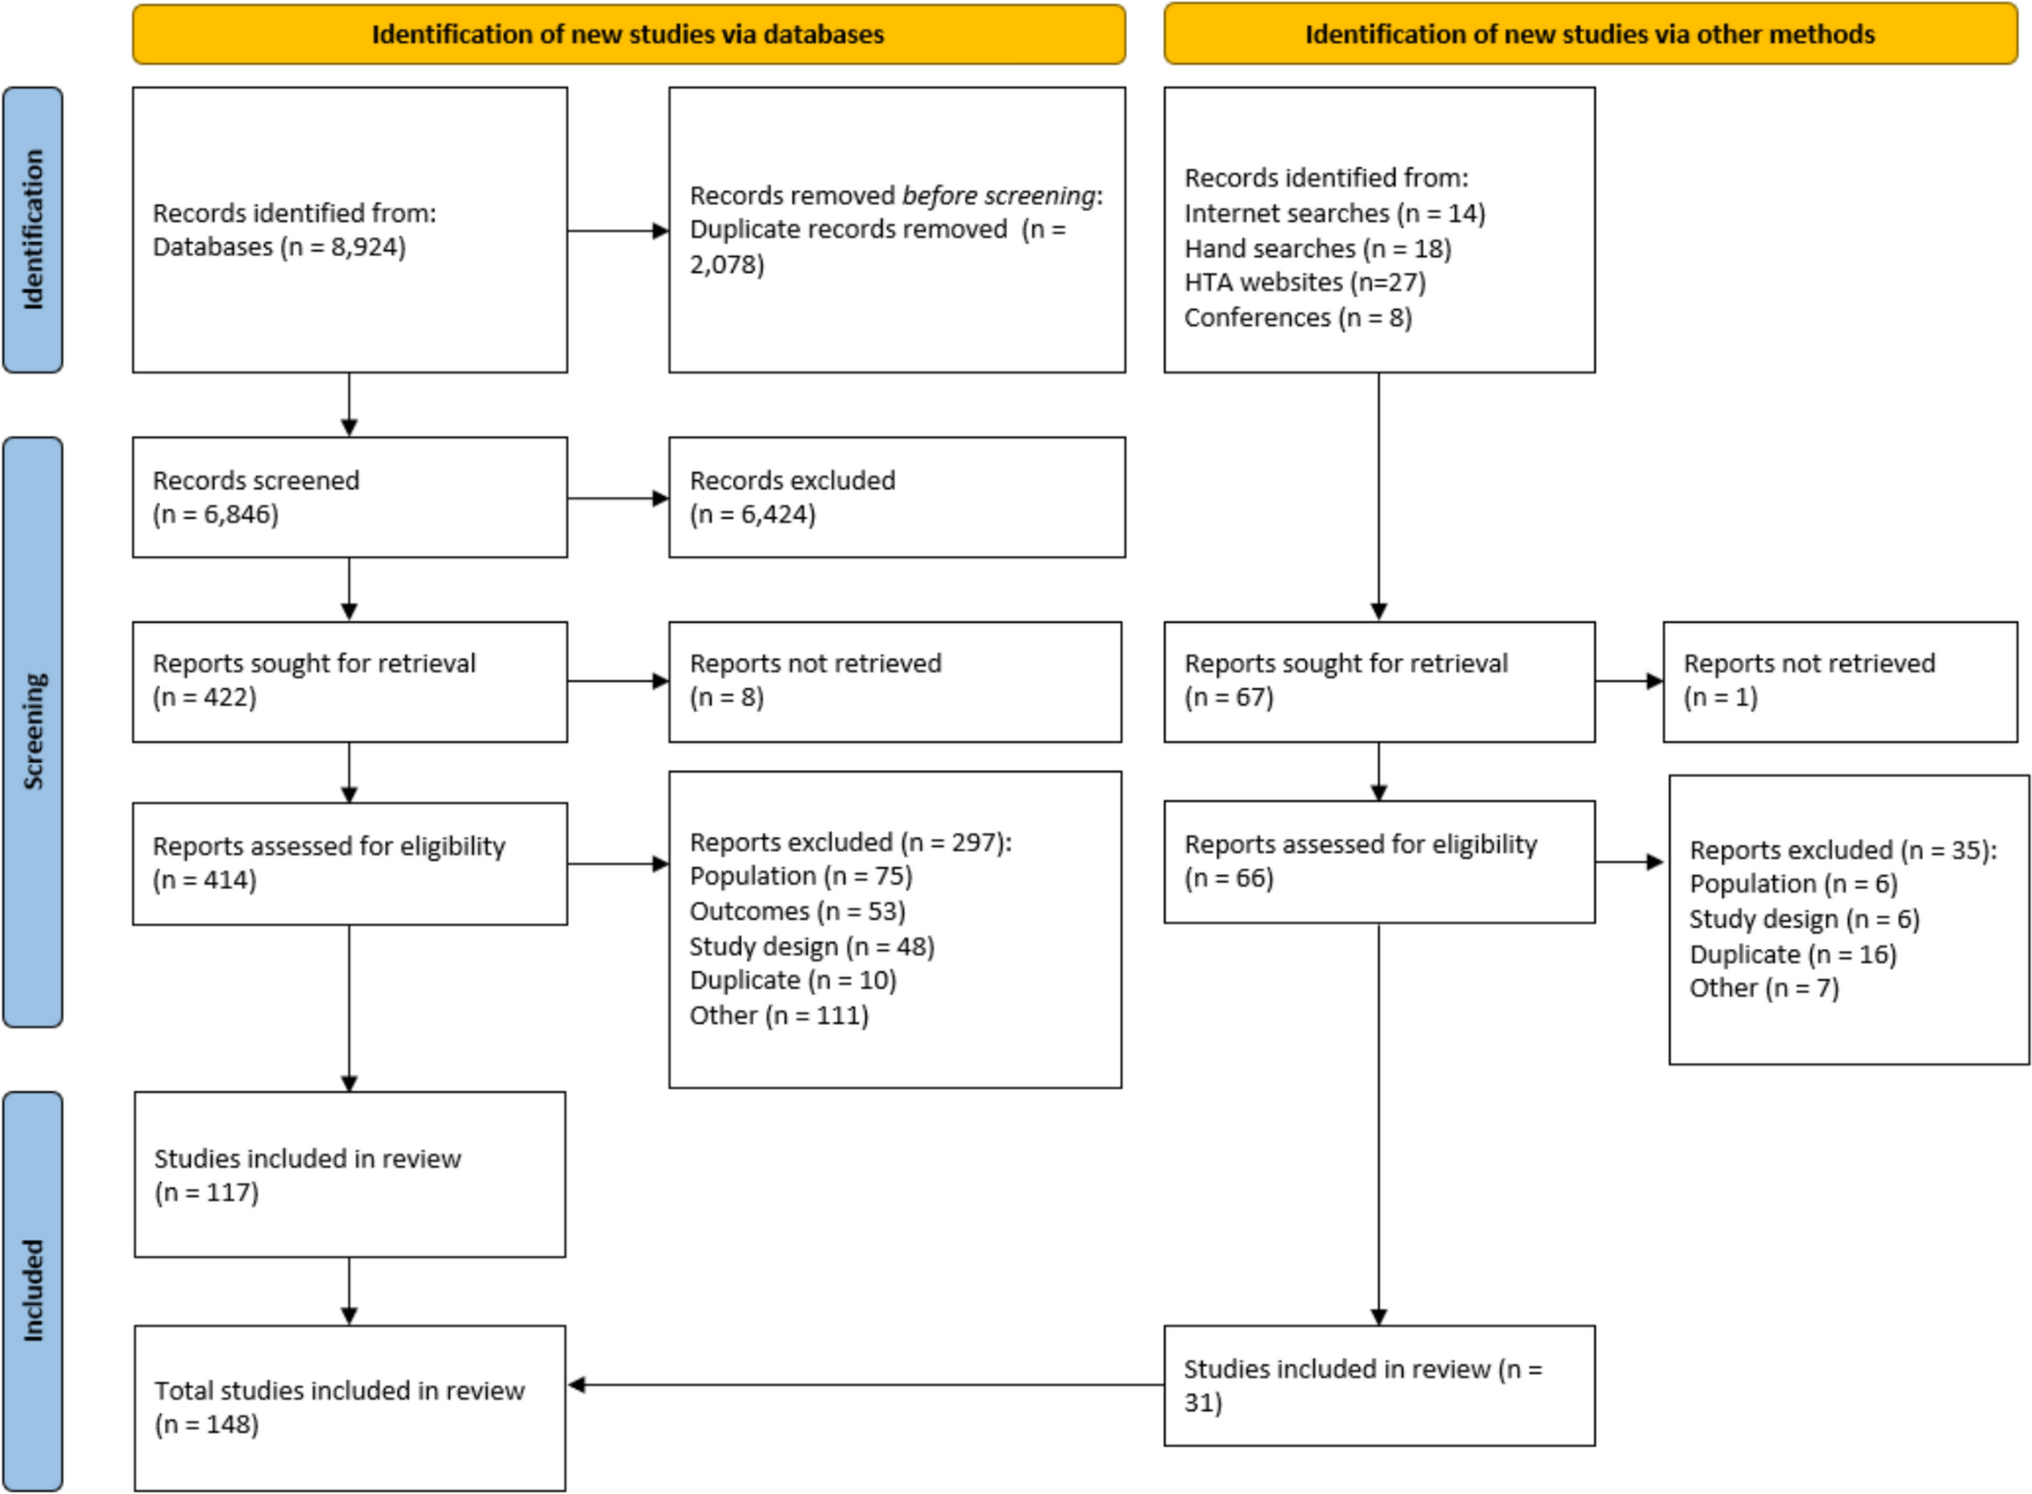

Across the database searches, 8924 studies were identified, and 2078 of these were removed owing to their being duplicates. Additionally, 67 studies were identified during the gray literature search. Following abstract and full-text screening, 148 studies were included in the SLR (Fig. 1). Of the included studies, 14 were economic evaluations, 24 were HTAs, and 110 were observational studies (Supplementary Tables 9–11). Of these studies, 34 reported total costs, 65 reported direct costs, and 7 reported indirect costs. Most of the studies were conducted in the USA; however, there were also multinational studies and studies from South America, Europe, and Asia–Pacific (Supplementary Tables 9–11). Studies that were comparative typically explored outcomes for different PAH subtypes or outcomes of different treatments. Less common comparators were WHO FC and risk scores. Outcomes were reported over a variety of timespans including monthly, annually, and over multiple years. Owing to the variety of outcomes, comparators, and timespans, the potential for direct comparisons across studies was limited.
Fig. 1.
PRISMA diagram showing overview of the SLR study selection
3.2 HCRU and Associated Direct CostsThe literature search identified a large number of observational studies (n = 110) reporting on the economic burden of PAH, including HCRU (n = 89) and costs (n = 65) (Supplementary Table 9).
Across the studies identified, HCRU included the number of hospital admissions and length of stay (LOS) for both general and PAH-related reasons. The median annual number of hospitalizations was reported to be as high as 2.2 for the overall PAH population in a South Korean study [27] and a mean of 4.4 for patients with PAH-systemic sclerosis (SSc) in an Australian study [28]. The hospital LOS was reported to be as high as 7.6 days per hospitalization for the overall PAH population in a US study [29]. A subset of studies also reported more granular data, such as inpatient, ED, and ICU admissions. Data were also reported on physician and outpatient visits, enabling an overview of the impact of PAH on the entire HCRU spectrum, the specifics of which are discussed in relevant sections within this article.
There were 35 studies that reported total healthcare costs, with annual total costs per patient with PAH as high as $160,335 (converted to USD 2024) in one US study [30]. Further, hospitalization costs were identified as a substantial contributor of total costs in DuBrock et al., a US study, constituting up to 50% of total costs (hospitalization cost versus total costs per patient per month (PPPM) for patients with a < 12 month diagnosis delay, 12–24 month diagnosis delay, and > 24 month diagnosis delay were $6303 versus $14,643, $9005 versus $17,958, and $9431 versus $18,506, respectively) [31]. This was supported by findings from Tsang et al., a US study, which reported mean per person per annum (PPPA) hospitalization costs versus total medical costs (not including pharmacy costs) for patients receiving selexipag and for patients not receiving any prostacyclin treatment ($13,686 versus $31,623 and $31,064 versus $58,073) [32]. A Spanish study reported mean PPPA hospitalization costs, accounting for a substantially lower proportion; however, these data were not directly measured and instead were calculated using PAH hospitalization data from literature and median hospitalization cost across differing communities [14].
Key comparisons of note across the SLR were PAH-specific treatment intervention and differing WHO FCs. Higher WHO FC was associated with higher economic burden [14, 33], and treatment with PAH-specific therapies was generally associated with reduced economic burden, particularly with reduced HCRU [32, 34,35,36,37].
3.3 Increased Economic Burden with Increased Disease SeverityIncreasing economic burden for patients in higher WHO FCs (i.e., worse disease severity) was reported for total healthcare costs and HCRU. The total healthcare costs for PAH were stratified by WHO FC in four studies (Table 2) [14, 28, 33, 38], all of which reported a general increase in costs for patients in higher WHO FCs [14, 28, 33, 38]. Mean annual costs for WHO FC I versus WHO FC IV patients in the USA were $73,443 versus $175,368 (converted from monthly to annual for comparison) [38], and $6432 versus $8966 among Australian patients with PAH [28]. Further, within a cohort of Spanish patients with PAH, the annual mean total cost for WHO FC I–II versus WHO FC IV was $30,427 versus $112,845 for prevalent patients and $77,333 versus $247,556 for incident patients (Table 2) [39].
Table 2 Economic burden stratified by disease severity in patients with PAHTwo studies reported hospitalization costs stratified by WHO FC (Table 2) [14, 28], with mean annual hospitalization costs for WHO FC I versus WHO FC IV of $2652 versus $4314 in an Australian cohort and $10,174 versus $25,106 for Spanish patients with prevalent PAH (Table 2).
Upon examining granular HCRU types, such as hospitalization, pharmacy costs, ED admission, and outpatient visits, the trend remained the same, with higher costs associated with higher WHO FCs (Table 2) [38, 39]. Alvarez-Albarran et al., a study from Mexico, was the only study that reported inconsistent data on the correlation between higher WHO FCs and higher HCRU. However, this publication was only a conference abstract, with no full-text publication available [40].
In addition, there were two studies identified in the SLR that reported economic burden data stratified by multicomponent risk score (an alternative measure of PAH severity). These studies were in agreement with those reporting WHO FC, with higher risk scores also corresponding to an increased number of hospitalizations and a longer LOS (22 versus 8 mean days per hospitalization for high- versus intermediate-risk patients) (Table 2) [41, 42].
3.4 Impact of Treatment on Economic Burden in Patients with PAHIn line with treatment escalation being an integral approach to PAH management, 28 studies across the SLR reported pharmacy costs or drug costs as contributors to overall direct costs, highlighting medication costs as an important aspect of the economic burden of PAH [13, 14, 17, 27, 28, 30, 31, 34, 38, 40, 43,44,45,46,47,48,49,50,51,52,53,54,55,56,57,58,59,60]. Furthermore, 21 studies reported comparative HCRU data for patients receiving treatment [15, 32, 35, 36, 46, 49, 51, 54, 58, 61,62,63,64,65,66,67,68,69,70,71,72], 8 of which reported comparative total cost data [32, 49, 51, 54, 58, 62, 64, 69]. Comparative data included subgroups of patients pre- and post-treatment initiation, patients receiving a specific PAH treatment on top of background therapy compared with only background therapy, and patients receiving different treatments. The SLR also identified 14 economic evaluations and 24 HTAs that examined the cost-effectiveness of differing PAH treatments (Supplementary Tables 10 and 11).
3.4.1 Economic Burden Pre- and Post-treatment InitiationSeveral studies reported on costs before and after treatment initiation (Table 3) [34, 50, 51, 56, 57]. In line with an expected increase in drug costs with PAH disease management, two studies by Runheim et al. [56, 57] quantified the increase in drug costs, moving from an average of $4481 per patient over the 5-year period before PAH diagnosis to $143,506 for the 5-year period after diagnosis, with the total sum of drug costs over 5 years considerably higher post- compared with pre-diagnosis (Table 3) [56]. As patients diagnosed with PAH are likely to initiate PAH-specific therapies, this increase is likely due to the high costs of these therapies, as well as the fact that, once initiated, PAH therapies will be continued for a patient’s lifetime.
Table 3 Economic burden for patients pre- and post-treatment initiationThe studies captured by the review indicate that the high cost of PAH therapies can be balanced by a reduction of other costs following proper disease management. For example, Burger et al., a US study, reported an increase in total costs posttreatment initiation with prostacyclin from $78,909 to $153,691 per patient per 6 months, which was largely driven by an increase in medication costs, from $25,648 to $101,672 (Table 3) [34]. However, this study reported a decrease in the total healthcare contact costs from $46,200 to $41,623, indicating that the decrease in HCRU can offset the increased pharmacy costs to a degree [34]. These findings were supported by two other US-based studies that demonstrated statistically significant reductions in costs associated with inpatient admissions post-PAH-specific treatment initiation (average $42,062 to $24,115 and $112,097 to $36,135 per patient per 6 months, respectively) (Table 3) [50, 51]. Meanwhile the Runheim studies, which reported data from Sweden, did not show a decrease in other healthcare costs such as hospitalizations [56,
Comments (0)