2.1 Sample
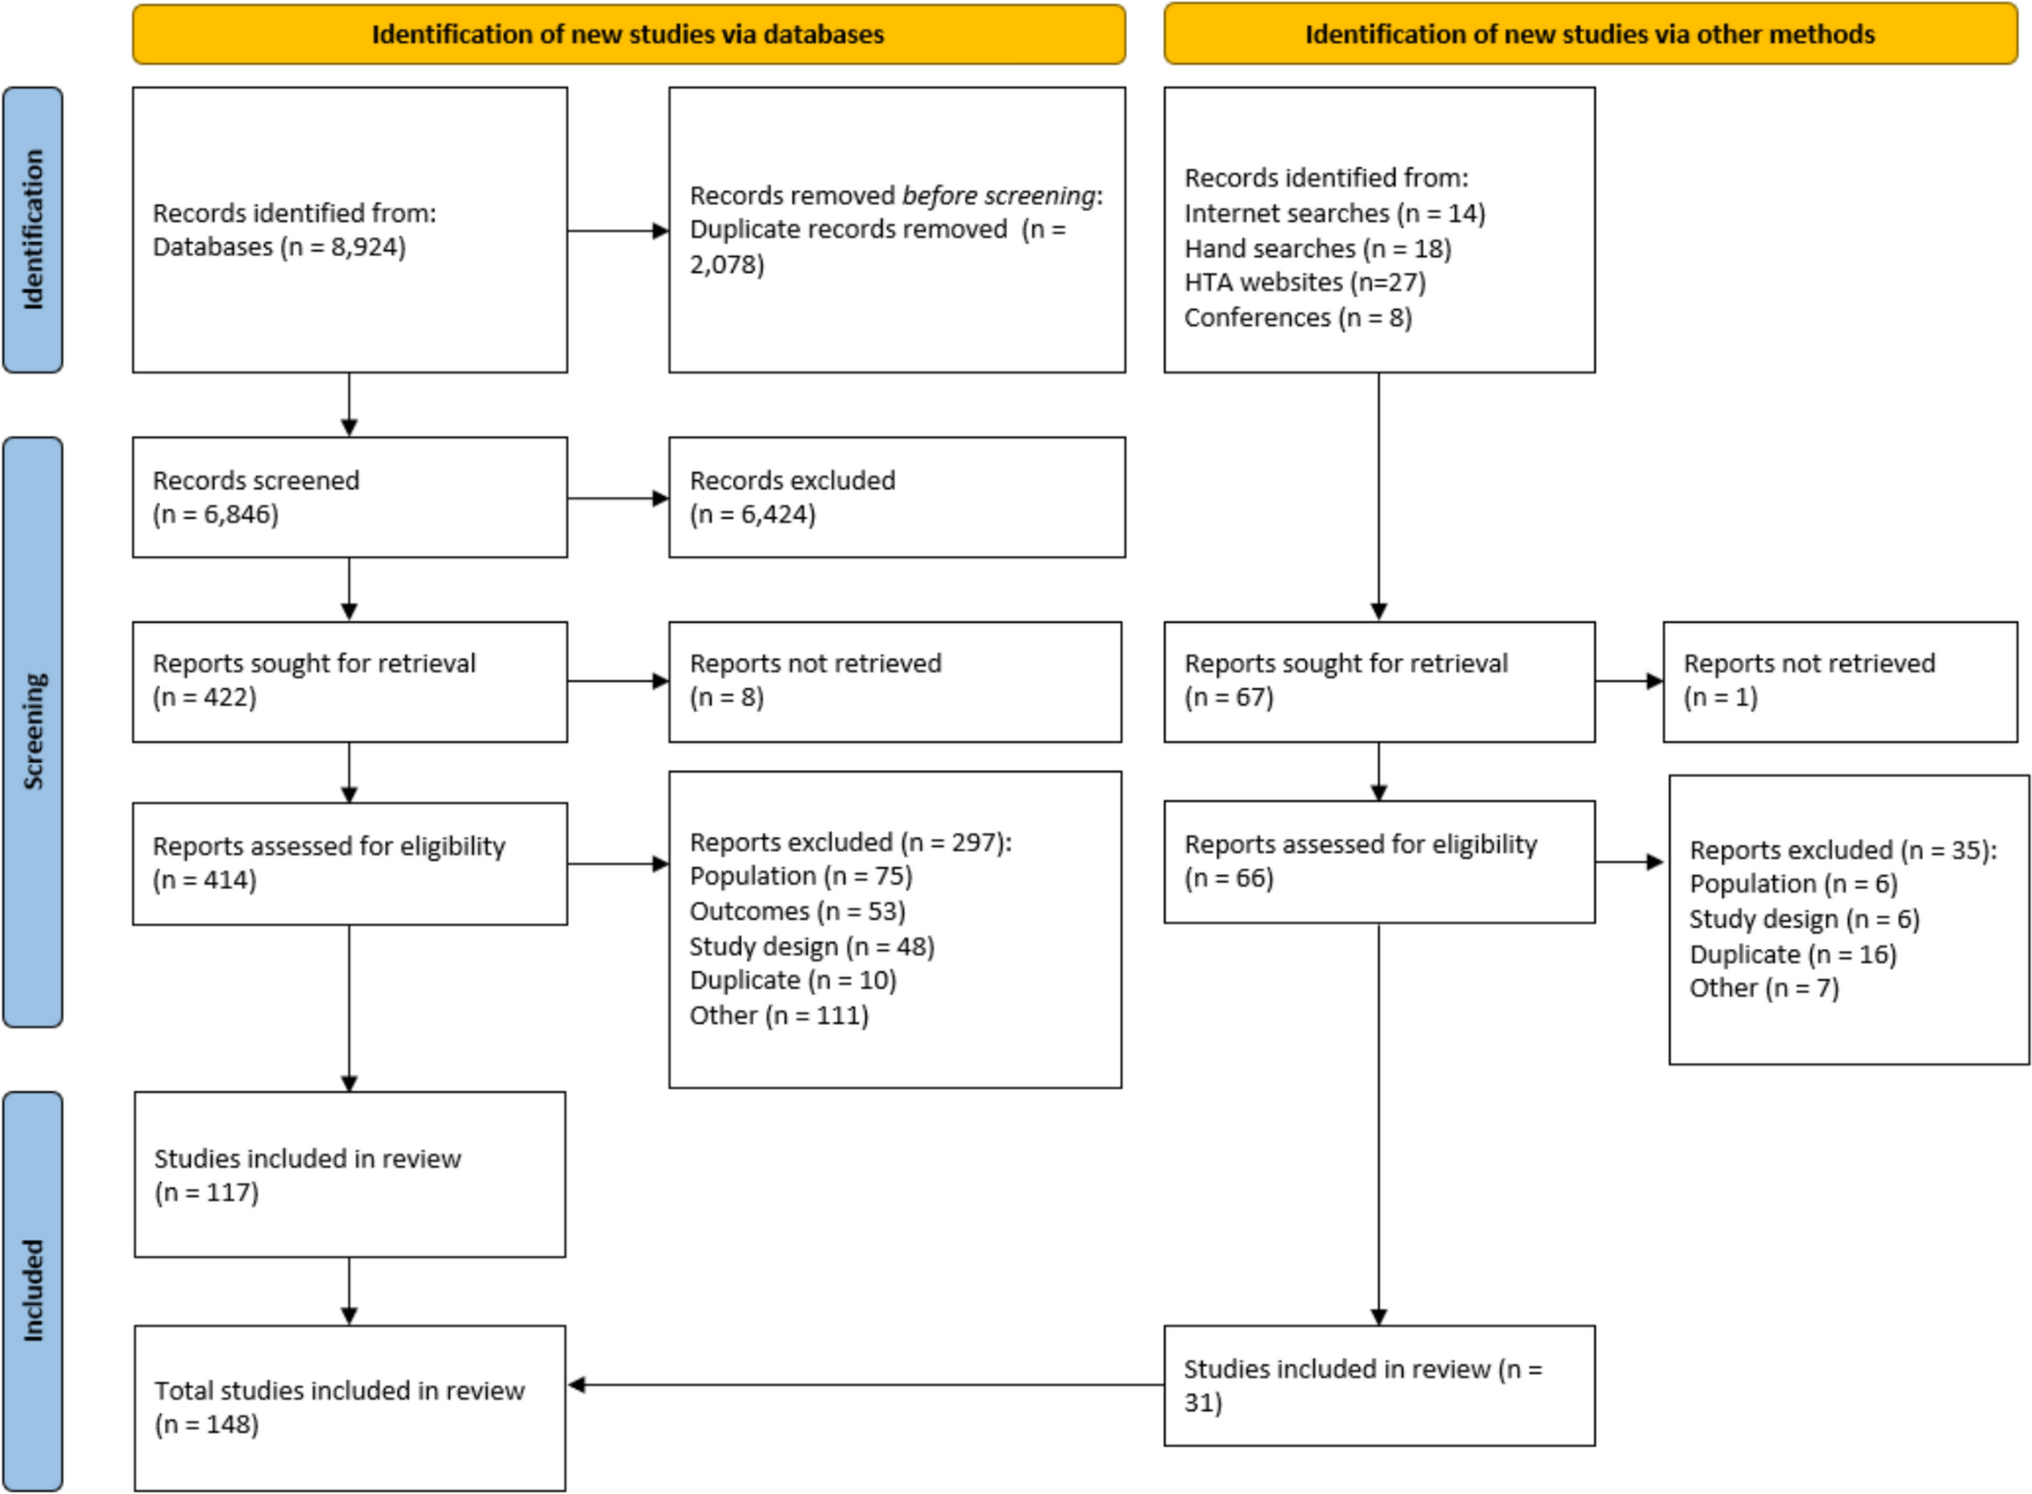
Data were collected from a sample of the general adult population in Australia between September 2023 and March 2024, recruited via an online survey company, Cint. Quotas were implemented to guarantee that the recruited sample represented the general population, with respect to gender, age, and region. The sample was also monitored to ensure the expected population proportions of parents of children aged 0–18 years (20%; ABS 2021) [27]. The sample was randomly allocated to two arms valuing health states for (1) 2–4-year-olds or (2) 10-year-olds.
This study followed the Reporting Inventory Child Health Values (RETRIEVE) checklist for Studies Reporting the Elicitation of Stated Preferences for Child Health-Related Quality of Life [28] (Electronic Supplementary Material).
2.2 Survey
The survey (for full survey see Electronic Supplementary Material) comprised the following elements in this order: an information sheet and informed consent, screening questions (including age, gender, region, and parental status), reported child health using CHU9D, discrete choice experiment (DCE) tasks, a Visual Analogue Scale (VAS) valuation task, debrief questions (DCE task difficulty and whether they think their choice would differ on the basis of different ages of children), and background questions. Logic check questions (for data quality control), such as dominant DCE tasks and repeated questions about the participants’ age, were included. Several criteria, including giving speedy answers (e.g., finishing the survey with less than one-third of the median completion time), inconsistent responses to age questions, dominant task failure, and giving ‘straight-line’ answers (e.g., choosing the first option throughout), were created to guarantee the minimum quality of survey data used for the main analysis, with impacts tested in sensitivity analysis (for more details see Electronic Supplementary Material). The time to complete the survey and individual DCE tasks were recorded. The health descriptions using the CHU9D [29] were identical in the two study arms (2–4 years versus 10 years) except for the optional pop-up guidance notes for the younger age group, which appeared when participants put the cursor to that dimension. The survey was set up using the Qualtrics platform, and data were collected and stored through Qualtrics at the University of Melbourne.
Ten pilot surveys were conducted among colleagues and friends of the authors before formal launch to check the feasibility and face validity of the survey. As a result of feedback, some changes were made to the DCE instructions and survey display, such as the font and shade. A randomly selected 10% sample was part of a soft launch to obtain priors for the DCE Bayesian design.
2.3 DCE2.3.1 Experimental Design
The CHU9D descriptive system consists of nine dimensions (Worried, Sad, Pain, Tired, Annoyed, School work/Homework, Sleep, Daily Routine, and Joining in Activities), with five response levels each within each dimension (for details see Electronic Supplementary Material Table S1), resulting in 59 = 1,953,125 possible health states [30]. In this study, the DCE design utilized 204 choice sets that would facilitate estimation of a predefined regression model, aligning with a previous study [25]. A modified Fedorov algorithm was employed to create a Bayesian D-efficient design [25]. The 204 choice sets were divided into 17 random blocks of 12 choice tasks as per prior studies [25]. In each choice task, respondents were asked to give their own views regarding two health states for a hypothetical child (e.g., “Considering your views about a 2–4-year-old child: which do you prefer?”). To reduce cognitive burden and address attribute nonattendance, a partial design of the DCE was employed [31, 32]. In each choice task, four of the nine dimensions remained at the same severity levels (presented with grey shading) between the two health states, while five dimensions varied (presented in bold font).
2.3.2 Sample Size for DCE
The target sample size of 1200 per study arm was prespecified to be above the estimated minimum (850; for more details see Electronic Supplementary Material) according to several recommendations [17, 30, 33] and consistent with a previous similar study valuing CHU9D, with around 70 responses for each choice set [25].
2.4 Model Specification
The choice data were analyzed using the conditional logit model and a linear additive utility function, which is consistent with the random utility model of choice [34], and the aim of estimation of average general population preferences [25, 35]. The mixed logit model is used in sensitivity analyses. The choice responses were treated as a binary dependent variable (1 and 0 for being chosen or not). Independent variables (dimension levels) were dummy coded, with level 1 for each dimension used as a reference level. All standard errors were cluster-robust, allowing for arbitrary correlation between the error terms at the individual level. Equation 1 describes the model specification.
$$V=\sum_^\left(_}_+_}_+ _}_ + _}_\right).$$
(1)
In Eq. 1, V represents the choice variable (0 or 1), i denotes the nine attributes of CHU9D, and Xi2 represents the level 2 of attribute i. The coefficient \(_\) can be interpreted as the marginal effect associated with attribute i at level 2 relative to the reference level (level 1). In other words, it quantifies the difference in preference for attribute i at level 2 compared with level 1.
2.5 Preference Comparison
Three approaches were adopted to compare the preferences between samples (i.e., considering 2–4-year-olds versus 10-year-olds, and parents of children aged 0–18 years versus people who are not parents of children aged 0–18 years). The first approach used relative attribute importance (RAI) [36]. Attribute-based normalization was used to obtain the RAIs, with attribute importance calculated as a proportion of the reference attribute importance (Eq. 2).
RAIy is the RAI score for attribute Y. Attribute X, the least important dimension, is the reference attribute. βy and βx were the coefficients for level 5 of attribute Y and attribute X, respectively. For example, RAI_worried = β_worried5/β_reference5.
The second approach was to estimate a pooled model with each variable (dimension level) interacting with the interaction variables (e.g., 1 = 2–4 years old; 2 = 10 years old), with the coefficients on the interaction terms representing the change of average health state preference from a 2–4-year-old child to a 10-year-old child. A pooled model with interactions can reveal differences at the level of specific levels within each dimension, whereas RAI only identifies differences between dimensions.
In addition, Swait–Louviere tests [37] (i.e., poolability test) were also used to test for differences in preferences and scale between samples.
2.5.1 Consistent Model
To estimate a value set, a consistent model is needed. The model should ensure that utility either remains the same or decreases when HRQoL deteriorates. Coefficients from the conditional logit model were examined for any logically misordered coefficients. To produce a consistent model, adjacent inconsistent levels were merged or constrained to be equal, as widely used in prior studies [23, 25, 38].
2.5.2 VAS Anchoring
A VAS valuation task asked respondents to rate three health states (the best health state, worst health state, and “dead”) on a scale of 0–100, where 0 indicated the worst health they could imagine, while 100 indicated the best health that they could imagine, as per a prior published study [39].
This study used VAS as the anchoring method, as other anchoring methods such as DCE with duration or time trade-off (TTO) are considered impractical due to the framing of a young child. For example, a child aged 2–4 years old would be an adolescent if a 10-year duration is used in a TTO as is common, which would lead to the health state descriptions no longer pertaining to the age group of interest. A much shorter duration such as 1 year can be used; however, it is likely to encounter unwillingness to trade [40]. In as such, VAS method was used following available literature. The raw VAS valuation of the worst health state defined by the CHU9D descriptive system was anchored to be on a full health = 1, dead = 0 scale using the equation below (Eq. 3):
$$\frac_ - 0}=\frac_-_}_-_}.$$
(3)
The anchored value of the worst health state (555555555) could be below zero if Raw_VAS555555555 was smaller than Raw_VASdead.
The latent preference values estimated from the conditional logit model based on DCE responses were linearly transformed to a 0–1 scale where 0 = dead and 1 = full health according to equation below (Eq. 4):
$$}_=\left(\frac}_}^_}\right)_,$$
(4)
where the left-sided \(}_\) is the rescaled coefficient and the right-sided βk is the original estimates of the conditional logit model. The βj5 are the latent scale level 5 coefficients. \(}_\) is the anchored value for the worst health state obtained from Eq. 3.
Only the logical VAS scores were used. The VAS scores were used if VAS111111111 > VAS555555555 and VAS111111111 > VASdead.
2.6 Comparing Value Sets
We compared the newly generated value sets in this study and the existing Australian CHU9D value set [23] by assessing the values of adjacent states within CHU9D descriptive system. “Adjacent state” means having a one-level difference within one dimension when the other dimensions remain at the same level [41]. Kernel density distribution plots were drawn to display the overall distributions of the “theoretical” values for the value sets [41].


Comments (0)