
Remember me


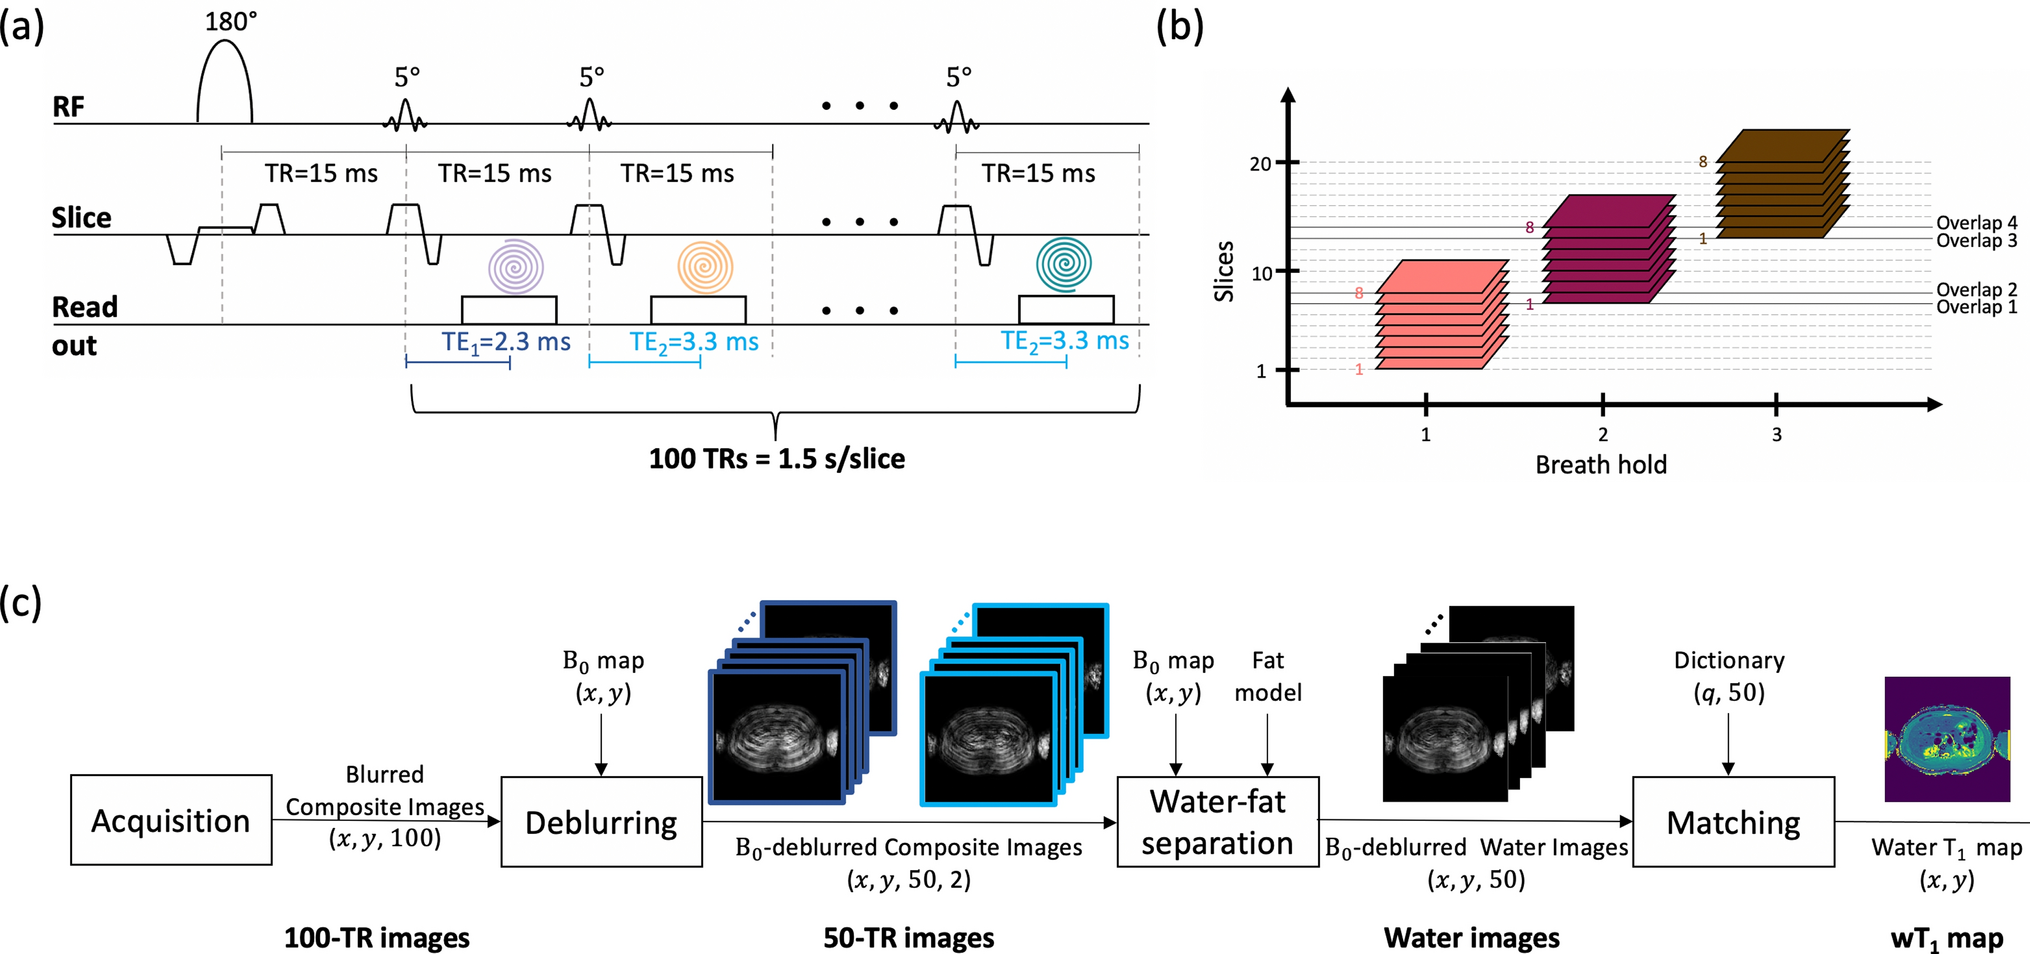


A CIR-LL method for a single slice has been designed based on the \(}_^\)-robust single-shot spoiled gradient echo (GRE) sequence introduced in [18] (Fig. 1a). An adiabatic slice-selective inversion pulse is followed by 5° RF pulses repeated every TR = 15 ms for 100 times. For high sampling efficiency, uniform sampling density spiral readouts are employed. A spiral readout of 9.2 ms is acquired at interleaved TE1/TE2 = 2.3/3.3 ms and is rotated (360/Ns)° every TR for varying spatial encoding. Ns represents the total spiral arms needed for a fully sampled scan. Thus, the sequence allows to acquire a slice of resolution [2 × 2 × 5] mm3 in 1.5 s.
Whole pancreas coverage—multiple slicesFor an in vivo multi-slice acquisition, the CIR-LL sequence is repeated per slice in an interleaved manner. The slices are acquired within a breath-hold with a gap of 1 mm between two neighboring slices, which has been shown to minimize cross-talk effects [18]. Considering the difficulties of patients to hold their breath for a long time, the considered breath-hold was set to 12 s which allows the acquisition of eight slices with the proposed sequence. To cover the whole pancreas, the method was designed to acquire three stacks of eight slices. Given the possibility of organ displacement due to the separate breath-holds, an overlap of 11 mm (two slices of 5 mm thickness + a slice gap of 1 mm) was also considered for adjacent stacks. In this way, the proposed CIR-LL acquisition covers the whole pancreas in three short breath-holds of 12 s each (Fig. 1b).
wT1 quantification methodologyImage reconstruction and main magnetic field (B0) deblurringFigure 1c shows the proposed image reconstruction and wT1 quantification methodology. After the acquisition, the image reconstruction occurs in the scanner using gridding and coil combination techniques and producing 100 blurred composite images (100-TR images), one image per TR. Then, the images dimensions are (x, y, 100) where x, y represents the spatial location. On one hand, the images are composite since water and fat signals are superimposed. On the other hand, the images are blurred because the use of spiral trajectories in the presence of off-resonance leads to significant image blurring [19, 20]. Off-resonance originates from the B0 inhomogeneities or from the chemical shift, as in the case of fat. A B0 map is acquired as a pre-scan and is used together with the vendor software for image B0-deblurring on the scanner. At this point, both water and fat are still part of the total signal but the B0-blurring effects have been removed. The B0-deblurred composite images are grouped according to their TE resulting in two groups of 50 images each (50-TR images). Thus, the images dimensions are (x, y, 50, 2).
Water-fat separationAs a next step, the 50-TR images go through the water-fat separation process which uses a chemical species separation algorithm [21]. For this process, it is considered that every image pixel (x, y) contains two chemical species: water and fat, represented by a multi-peak fat model to account for the spectral complexity of fat [22, 23]. Given the known chemical species and using the previously acquired B0 map, the water-fat separation problem can be solved using signals from two different TEs as TE1 and TE2. \(}_^\) effects were not considered as the proposed TEs are close to each other.
The water-fat separation process is performed for every pixel (x, y) of the 50-TR images using their two TEs. Due to the previous B0-deblurring, the water-fat separation step outputs 50 B0-deblurred water images and 50 B0-deblurred fat images which are still blurred due to the chemical shift. For the purpose of the present work, only the 50 water images of dimensions (x, y, 50) are used for the next step of the processing.
Dictionary calculation and matchingThe final step to estimate the wT1 map of one slice is the dictionary matching. The matching process takes the water images as input to perform a complex matching using a pre-computed dictionary.
Fig. 1
Proposed wT1 method. a Proposed single-shot continuous inversion recovery spiral sequence. b With the proposed sequence, eight slices (one stack) can be acquired in a breath-hold of 12 s. For the whole pancreas coverage, three separate breath-holds and an overlap of 11 mm (two slices of 5 mm thickness + a slice gap of 1 mm) between consecutive stacks is defined. c Block diagram to obtain the wT1 map of one slice. (\(x, y\)) represent the spatial location and 100 is the number of excitations (50 repetitions × 2 TEs). Despite the high under-sampling, the wT1 map presents good quality as displayed by the miniature images
A dictionary is a set of vectors that describe the expected signal evolution for different parameters when the proposed sequence is applied. The Extended Phase Graph method [24,25,26] was used to compute the dictionary. The parameters for the simulation included T1 = [100, 3000] ms in steps of 5 ms, T2 = 50 ms and \(}_}}}^\) = 1. According to [18], a CIR-LL method with a small flip angle does not encode T2, is robust to \(}_^\) inhomogeneities and can be affected by slice profile effects. Therefore, T2 and \(}_^\) were set to specific values and the slice profile effects were modeled for the dictionary calculation [18]. To this extend, the dictionary contains vectors of 100 points because the proposed sequence considers two TEs. Therefore, every second point of the dictionary vectors was removed which is equivalent to averaging TEs. Thus, the dictionary contains complex vectors of length 50.
The matching is performed by computing the inner-product between the 50-length signal of a water pixel (x, y) and all dictionary vectors, both normalized. The T1 of the dictionary vector that obtains the maximum inner-product is assigned as the wT1 value of that specific pixel (x, y). The matching is repeated for every pixel (x, y) of the water images obtaining the wT1 map.
MR measurements and analysisPhantom and in vivo measurements were performed on a 3 T Ingenia Elition X scanner (Philips Healthcare, Best, the Netherlands) with the sequence parameters summarized in Table 1. Manual segmentations were drawn in the different images for evaluation using ITK-SNAP [27].
Table 1 Sequence parameters used in the phantom and in vivo experiments. The sequences included the MRS method as reference, T2-weighted imaging for anatomical guidance, the acquisitions needed for the proposed wT1 method, containing the B0 pre-scan and the proposed CIR-LL method, and the PDFF and T1-MOLLI maps for comparisonPhantom measurementsA phantom with vials of variable PDFF and wT1 values (Calimetrix, Madison, WI, USA) was used to validate the proposed method. The phantom contains emulsions of peanut oil and doped water in agar form in 12 vials distributed as shown in Fig. S1.
The phantom scan started with the PDFF maps acquisition to evaluate the fat fraction in the vials. Afterwards, the T1-MOLLI map was acquired to estimate the T1 value of the emulsions of water and fat in each vial. Then, the B0 maps were acquired and were adapted to the FOV and voxel size of the wT1 map. Finally, the proposed CIR-LL method was executed obtaining the 100-TR images. The 100-TR images were processed with the proposed workflow (Fig. 1c) to estimate the one-slice wT1 map of the phantom using the corresponding B0 map, a 10-peak fat model specific to peanut oil [22] and the previously defined dictionary.
In order to obtain wT1 reference values, single-voxel short-TR multi-TI multi-TE STEAM MRS measurements [28] were performed at the center of every phantom vial. MRS data were processed with a time-domain-based fitting approach using the ALFONSO [29] framework. The MRS processing framework includes coil combination, signal averaging, frequency offset correction, phase correction and signal model fitting to estimate T1. The signal model fitting was performed in the time domain and jointly for the TI series of the water peak of the spectrum using the nonlinear least-squares solver NL2SOL [28, 30]. ROIs were also defined in the T1-MOLLI and wT1 maps for all vials. To evaluate the proposed method and MOLLI with respect to MRS, the average of the ROIs defined on both maps were compared to the wT1-MRS values.
In vivo measurements11 volunteers and four pancreatitis patients participated in the in vivo measurements. The experiments were performed using the scanner’s built-in 12-channel posterior coil and a 16-channel anterior coil. The patient cohort included four individuals diagnosed with necrotizing pancreatitis per documentation in the local hospital information system. In three of the cases, acute pancreatitis was attributed to alcohol consumption, while one case developed in the context of chronic autoimmune pancreatitis. Ethical approval from the local ethics commission was obtained prior to conducting the study and all participants provided informed consent.
For all volunteers, T2-weighted images were acquired first and were used to plan the next pancreas scans. The B0 maps were acquired in free-breathing and were adapted to the FOV and voxel size of the wT1 maps. Then, the proposed CIR-LL acquisition was performed during a 12 s breath-hold covering eight pancreas slices. The acquisition occurred in an interleaved way (slice 1, 4, 7, 2, 5, 8, 3, 6) and without delay between slices. For each slice, the acquired 100-TR images were processed with the proposed pipeline (Fig. 1c) to estimate the wT1 maps using the B0 maps, a 7-peak fat model [23] and the specified dictionary. For the coverage of the whole pancreas, the B0 pre-scan and the proposed CIR-LL acquisition were performed for three consecutive stacks. Each stack comprises eight slices and an overlap of two slices between the consecutive stacks was considered. The three-stack B0 pre-scan and CIR-LL acquisition were performed twice to analyze the repeatability of the present work. Moreover, to evaluate the variation of fat content in the pancreas, the PDFF maps were acquired in a breath-hold. Finally, the T1-MOLLI acquisition of one slice was performed, up to three times, using cardiac synchronization in a breath-hold.
The T2-weighted images were used also as anatomical guidance for the manual segmentation of the pancreas in the volunteers’ wT1, T1-MOLLI and PDFF maps. The kidneys and liver were the main anatomical landmarks to determine the correspondence between the slices of the different maps. In this way, the pancreas was segmented in 2D for all slices of the three-stack wT1 maps, obtaining a 3D whole organ segmentation. For the one-slice T1-MOLLI maps, the pancreas was manually segmented in 2D in the slice. Four cases that depict the PDFF variation were selected. For these cases, the pancreas segmentation was performed on the PDFF maps corresponding to the T1-MOLLI maps, adjusting the contrast when necessary. To evaluate the importance of the water-fat separation step and the dependency of T1 to TE [31], the 50-TR images of the volunteer with the highest PDFF value in the pancreas were analyzed. The 50-TR images corresponding to each TE were used directly for the matching processing, ignoring the water-fat separation step. Thus, a T1 map from the composite signal (T1comp), including water and fat, was estimated for TE1 and TE2. Moreover, T1comp simulations using the proposed method were performed for wT1 in the range [600, 1700] ms and PDFF in the range [5, 40]%, observed as the fat content range including pancreatic diseases [16] and pancreatitis [10]. To evaluate the repeatability, the average wT1 value of the segmented 3D pancreas region in each stack was compared between the first and the second measurement. Furthermore, the wT1 map corresponding anatomically to the T1-MOLLI map was identified in order to compare the average of the 2D segmentations on both maps.
For the patients, T2-weighted images, PDFF, B0 and wT1 maps were performed similar as for the volunteers. However, only one measurement of the three-stack B0 pre-scan and the proposed CIR-LL method was acquired to estimate the wT1 maps. To test clinical applicability, the acquired images were compared to contrast-enhanced CT images at the arterial and portal phase acquired as part of the clinical routine imaging of each patient. To evaluate the PDFF, wT1 and CT values in the presence of pancreatitis, circular ROIs (diameter varying from 6.5 to 17.4 mm according to the anatomy) were defined in the pancreas head, body and tail in the PDFF maps, wT1 maps and in the CT images for all patients. The average wT1 value of the 3D stack segmentations in the volunteers and the wT1 values of the ROIs in the pancreatitis patients were then compared to observe their differences.
Comments (0)