
Remember me
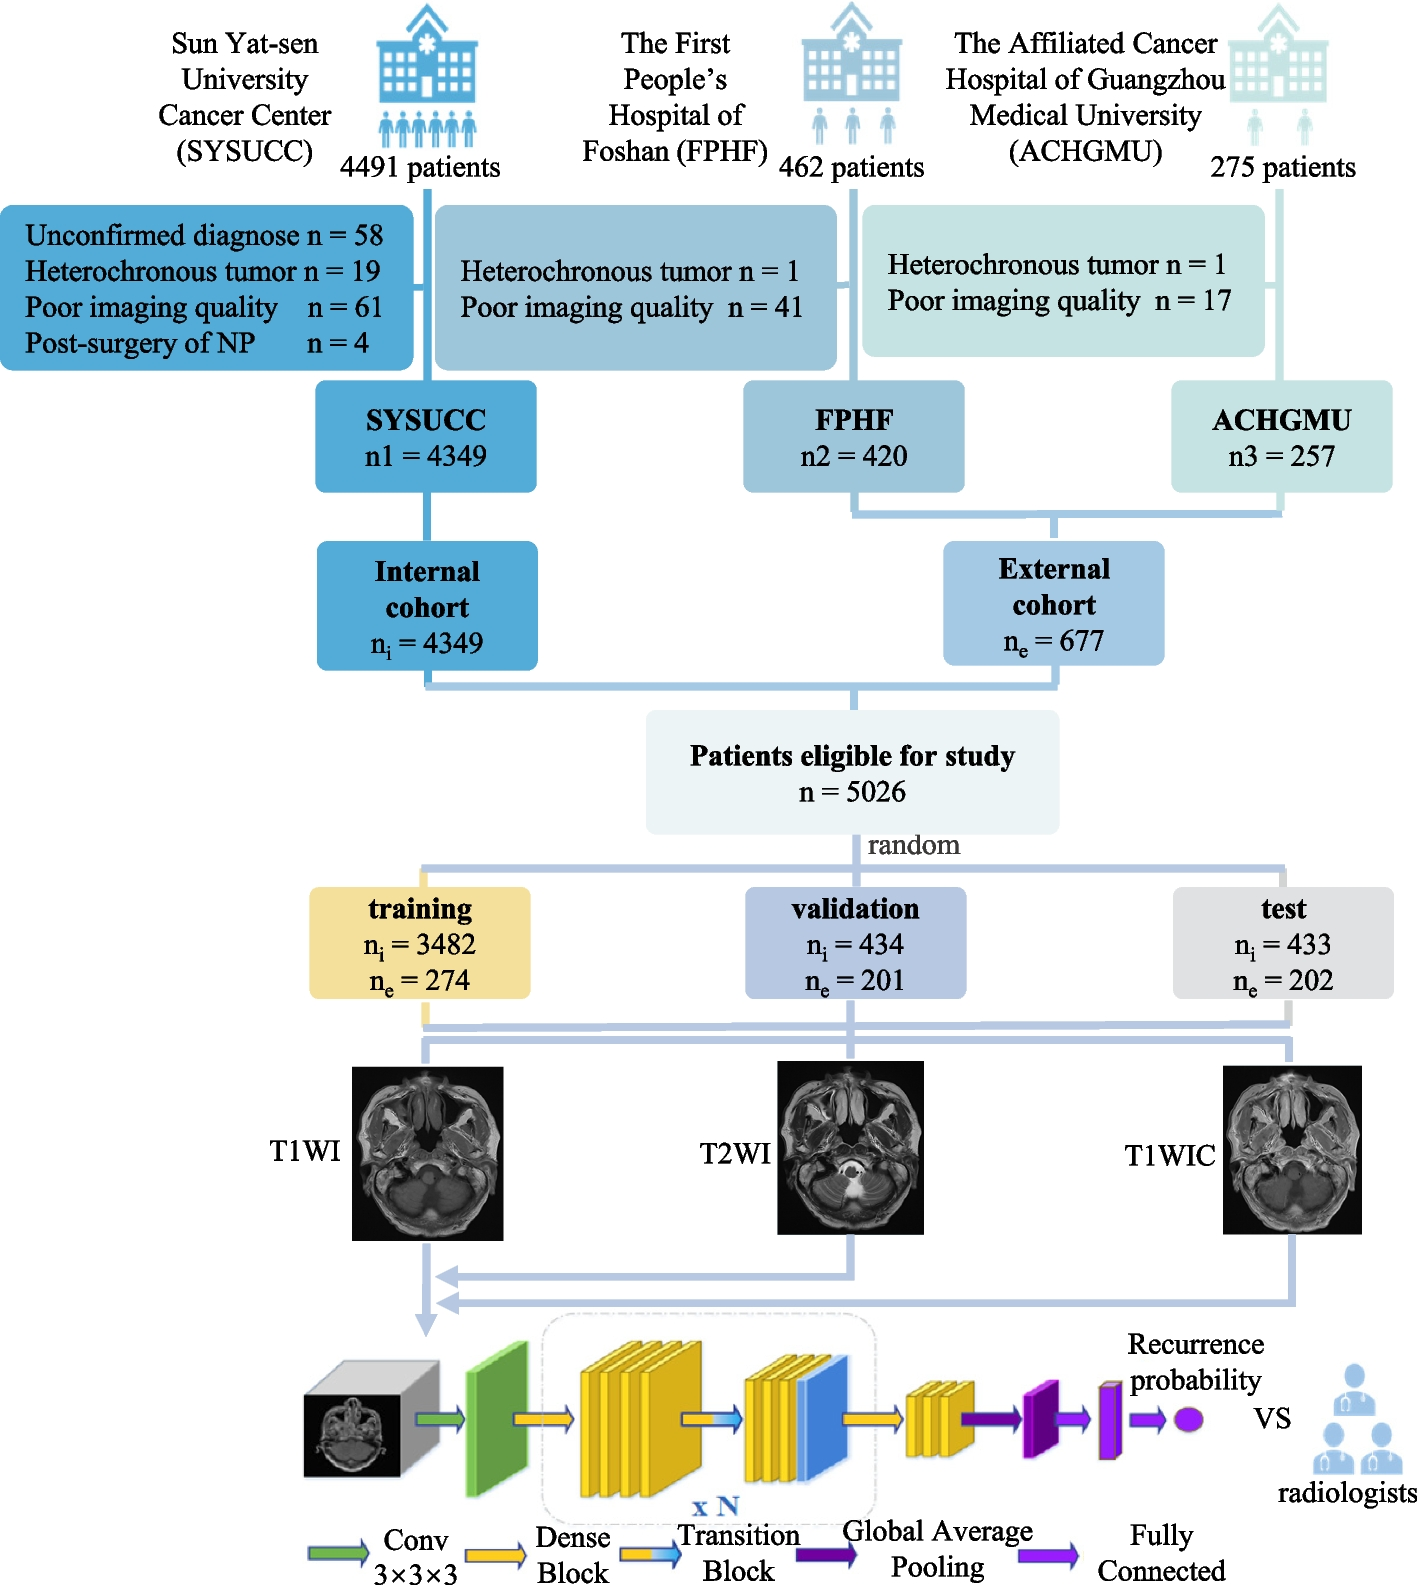


Among the 1993 patients with recurrence in the internal cohort, 1467 (73.61%) and 35 (1.76%) patients had histopathologically confirmed recurrent lesion at nasopharynx and metastatic lymphadenopathy, respectively. 73.40% (138/188) and 69.11% (85/123) of patients had histopathologically confirmed local rNPC in FPHF and ACHGMU. Notably, Submucosal local rNPC accounted for 85.6%, 4.26%, and 9.76%, while lesions with necrotic characteristic accounted for 23.53%, 13.30%, and 21.95% in SYSUCC, FPHF, and ACHGMU cohorts, respectively. Most patients in the three institutions were diagnosed with advanced local rNPC, with 74.86%, 84.04%, and 82.11% in SYSUCC, FPHF, and ACHGMU, respectively. Detailed demographic and clinical information from the three institutions are listed in Supplementary Tables 3-5.
Comparison of diagnostic performance of different models in identifying local rNPCThe T1WIC model using DenseNet showed no significant differences in overall accuracy, sensitivity, or specificity when compared to the T1WI, T2WI, or T1_T2 models, in both the internal and external cohorts (all P > 0.0167), with an overall accuracy and sensitivity over 83% in the internal cohort and over 81% in the external cohort, and all of the power of the test more than 95%. Radiologists achieved a slightly higher or non-inferior overall accuracy, benefiting from the favorable specificity that was slightly above or equal to that of the DenseNet models, but they experienced a decline in sensitivity, which was critical in detecting recurrence during post-treatment surveillance. Moreover, the PPV and NPV of the T1_T2 model were slightly higher than those of T1WIC without statistical significance in both test sets (Table 1). The T1_T2 model showed similar performance to the T1WIC model when using the ResNet frame, with slightly higher sensitivity but no statistical significance in both the internal (84.26% vs. 82.74%) and external (84.95% vs. 84.95%) test sets (Supplementary Table 6).
Table 1 Comparison of performance in identifying local rNPC among DenseNet models developed using different MRI sequence and doctors in test setParticularly, the ROC curves revealed no significant differences in the AUC between the T1WIC model and the T1WI, T2WI, or T1_T2 models in both test sets when using DenseNet (0.9124 vs. 0.9098, 0.9145, 0.9296 in the internal test set; 0.9071 vs. 0.8874, 0.8877, 0.9065 in the external test set; all P > 0.0167, Fig. 2) or ResNet (0.8970 vs. 0.8840, 0.8939, 0.9045 in the internal test set; 0.9061 vs. 0.8800, 0.8791, 0.8973 in the external test set; all P > 0.0167, Supplementary Figure 2).
Fig. 2
ROC curves of DenseNet models in the test set. (a-b) The diagnostic efficacy of DenseNet models developed using different MRI sequences in detecting local recurrent nasopharyngeal carcinoma is compared using ROC curves in the internal (a) and external (b) test sets. The area under the curve and 95% confidence interval of each model are also shown. Abbreviations: ROC, receiver operator characteristic curve; Doctor-S, senior radiologist; Doctor-J, junior radiologist.
Comparison of errors in diagnosing local rNPC among models and radiologistFurther analysis of errors in diagnosing local rNPC was performed to understand the mechanism of DenseNet models in detecting lesions. In misdiagnosed cases, mistaking radiation-induced fibrosis as recurrence was the first major cause for both the DenseNet models and the junior radiologist in both test sets, whereas mistaking radiation necrosis or wrongly identifying sinusitis or enhanced turbinate as recurrence were the second major causes for the DenseNet models in the internal or external test set, respectively (Fig. 3a, b). However, the senior radiologist, whose specificity was higher than that of deep learning models and junior radiologist (94.49% vs. 82.57-85.17% in internal test set, 97.25% vs. 82.57-96.22% in external test set, Table 1), excelled in distinguishing radiation-induced fibrosis from recurrence in both test sets but encountered challenges in differentiating recurrence from radiation necrosis, leading to lower sensitivity compared to models and junior radiologist in the internal test set (78.17% vs. 83.25-85.28%, Table 1 and Fig. 3b, c).
Fig. 3
Classification and comparison of errors in diagnoses among deep learning models and doctors. a Representative images of major errors in diagnosing local rNPC. The representative cases are radiation necrosis (necrotic lesion indicated by asterisk) wrongly identified by models in a case without recurrence, and missed diagnose due to low confidence (early recurrent lesion indicated by arrowhead at the right parietal wall of the nasopharynx). The columns from left to right in each case are original MR images, heatmap predicted by the DenseNet model and merged images of the former two. b-c The errors of misdiagnose (b) and missed diagnose (c) in local rNPC are shown in the stacked bar chart. Herein, focal recurrence refers to cases with rT1 stage disease; atypical recurrent site refers to uncommon site involved by NPC, such as nasolacrimal duct, nasal cavity, etc.; difficult to differentiate refers to misdiagnose between local rNPC and radiation necrosis.
Missed diagnoses for radiologists in both test sets were primarily due to recurrence at an early stage with focal lesions. Conversely, deep learning models struggled with accurate identification of lesions in the correct location and displayed uncertainty in true recurrent cases, with positional misjudgments as a secondary cause for missed diagnoses. Additionally, recurrence at an atypical site or skull base constituted a critical cause of missed diagnoses for radiologists in the internal or external test set, respectively (Fig. 3a, c).
Evaluation of DARNDEST's diagnostic performance and a comparative analysis of economic and time factors against the T1_T2 model and conventional methods for detecting rNPCExpectedly, DARNDEST showed higher accuracy and sensitivity compared to the T1_T2 model in the whole test sets, with slightly reduced specificity in both the internal (accuracy, 85.91% vs. 84.99%; sensitivity, 90.36% vs. 84.26%; specificity, 82.20% vs. 85.59%) and external (accuracy, 86.14% vs. 84.16%; sensitivity, 90.32% vs. 84.95%; specificity, 82.57% vs. 83.49%) cohorts (Table 2).
Table 2 Comparison of the diagnostic efficacy, total cost and time in a single MR examination using DARNDEST and T1_T2 model or conventional methodsFurther economic analysis was compared among the conventional method, T1_T2 model alone and DARNDEST. There would be 462, 171 and 367 patients categorized as positive, suspicious and negative group in the internal cohort according to DARNDEST, of which 383, 62 and 9 patients were diagnosed with local rNPC based on the actual incidence of the internal cohort with the hypothesis of 1000 patients. Meanwhile, 383, 28 and 5 patients would be detected as having local rNPC precisely using DARNDEST. ¥6,381 (5,671, 7,231), ¥87,286 (49,878, 162,933) and ¥488,800 (135,778, 244,000) were needed to detect a patient with local rNPC in each group. Similarly, there would be 480, 89 and 431 patients categorized as positive, suspicious and negative group, of which 391, 35 and 35 patients were diagnosed with local rNPC based on the actual incidence of external cohort, while 391, 25 and 5 patients would be detected as local recurrence using DARNDEST. ¥6,251 (4,436, 5,961), ¥97,760 (40,733, 271,556) and ¥488,800 (76,375, infinity) were needed to detect a patient with recurrence in each group (Fig. 4 and Supplementary Table 7).
Fig 4
Comparison of the economic burden associated with using enhanced MRI in each group based on DARNDEST. The economic analysis was modeled based on the actual prevalence, positive yield of local rNPC, and associated CI derived from this study with a hypothetical cohort of 1,000 patients who underwent follow-up MR examination after radical treatment. For each group in the figure, numbers in bonds denote cases and associated CI categorized as positive, suspicious or negative by DARNDEST. Italicized numbers above the line represent true-positive cases of local rNPC detected by DARNDEST, while those below represent true-positive cases confirmed by histopathology or follow-up MRI. Dark blue text boxes labeled "enhanced/unenhanced" is recommended MR examination methods according to DARNDEST. Data in gridline represent the costs per true-positive case of each group. Cost in China from the Medical Insurance Administration Bureau of Guangzhou, 2024. One dollar = 7.17 RMB. Abbreviation: CVi or CVe, cut-off value of the internal or external set, respectively
For a single examination in a hypothetical cohort of 1,000 patients, DARNDEST required 190.7 and 184.5 hours in the internal and external cohorts, while the T1_T2 model and conventional method required 129.2 and 226.4 hours, respectively. The total cost of MR examination using DARNDEST was 105.58% and 100.53% of the cost of the T1_T2 model (¥2,371,293 vs ¥2,246,000 and ¥2,358,723 vs ¥2,246,000, respectively) in the internal and external cohorts, whereas it was 97.03% and 96.51% (¥2,371,293 vs ¥2,444,000 and ¥2,358,723 vs ¥2,444,000, respectively) of the cost of the conventional method in the internal and external cohorts (Table 2).
Comments (0)