Subjects
This study is a cross-sectional observational study designed to investigate neuroimaging differences between CM patients with and without MOH. The study population consisted of female participants divided into three groups: one group of chronic migraine without medication overuse headache (CM − MOH), one group of chronic migraine with medication overuse headache (CM + MOH), and a group of healthy controls. All participants in both the patient and control groups were matched for age and educational years to minimize potential confounding factors. Participants were recruited from the International Headache Center of the First Medical Center of the Chinese People’s Liberation Army General Hospital between July 2023 and July 2024, and diagnoses were confirmed by two senior neurologists specialized in headache management.
The inclusion criteria were as follows: (1) aged between 18 and 65 years; (2) right-handed; (3) voluntary participation with written informed consent; (4) all participants met the diagnostic criteria for chronic migraine (CM) as defined in the International Classification of Headache Disorders, 3rd edition (ICHD-3), with or without MOH; (5) all participants had chronic migraine without aura; (6) no prior use of migraine prophylactic medications; (7) no migraine attacks 24 h prior to MRI scanning.
The exclusion criteria were as follows: (1) presence of any neurological or psychiatric disorders; (2) any systemic diseases (e.g., cardiovascular diseases, tumors, diabetes); (3) other chronic pain conditions (e.g., chronic back pain); (4) women who were pregnant or menstruating; (5) inability to undergo MRI scanning (e.g., due to metal implants); (6) headache occurrence during the MRI scan. Healthy controls were recruited from primary healthcare facilities or community centers, meeting the first three inclusion criteria and exclusion criteria, and with no family history of headaches in first-degree relatives.
After eligibility assessment, all participants completed a questionnaire to collect demographic information (sex, age, body mass index, and educational years) and clinical data, including the number of monthly headache days, number of monthly migraine days, average headache duration, headache laterality (unilateral, alternating sides, or bilateral simultaneous onset), and associated symptoms (worsening with physical activity, nausea, vomiting, photophobia, and phonophobia). Additionally, data on the types and frequency of analgesic use were recorded. Participants also underwent the following assessments: the Visual Analogue Scale (VAS, range: 0–10) to evaluate average headache intensity, the Patient Health Questionnaire-9 (PHQ-9, range: 0–27) for depressive symptoms, the Generalized Anxiety Disorder-7 (GAD-7, range: 0–21) for anxiety symptoms, and the Pittsburgh Sleep Quality Index (PSQI, range: 0–21) to assess sleep quality. Higher scores on these scales indicate more severe symptoms.
All participants underwent 7T MRI scanning to obtain neuroimaging data. To minimize any potential influence on neuroimaging outcomes, all participants were instructed to refrain from using acute analgesics or consuming caffeinated beverages (e.g., coffee, tea, cola) for at least 12 h prior to the MRI examination. They were also instructed to keep their eyes closed, remain quiet, maintain head stability, and use earplugs to mitigate noise exposure. Additionally, only participants who self-reported no migraine attacks during or immediately after the MRI scan were included in the final analysis.
The study was approved by the Ethics Committee of the Chinese PLA General Hospital (S2023-459-01). All participants provided written informed consent prior to participation, in accordance with the principles of the Declaration of Helsinki.
MRI acquisition
All subjects underwent structural MRI (sMRI), functional MRI (fMRI), and diffusion tensor imaging (DTI) acquisitions using a 7 Tesla MRI scanner (Siemens, Germany). The sMRI images were obtained using a three-dimensional T1-weighted magnetization-prepared rapid gradient-echo sequence with the following parameters: repetition time (TR) = 6000 ms, echo time (TE) = 2.21 ms, field of view (FOV) = 224 × 216 × 156 mm, slice thickness = 0.75 mm, spacing = 0.375 mm, voxel size = 0.7 × 0.7 × 0.8 mm, number of slices = 300, and flip angle (FA) = 4°. For fMRI, the parameters were: ep2d-trace-tra sequence with TR = 2000 ms, TE = 24 ms, FOV = 216 × 216 × 144 mm, slice thickness = 1.8 mm, spacing = 0 mm, voxel size = 1.8 × 1.8 × 1.8 mm, number of slices = 80, and FA = 90°. DTI parameters included TR = 5120 ms, TE = 59 ms, FOV = 224 × 224 × 128 mm, slice thickness = 1.6 mm, spacing = 0 mm, voxel size = 1.6 × 1.6 × 1.6 mm, number of slices = 80, and FA = 180°. Prior to preprocessing, imaging experts performed quality assessments on all imaging data to exclude images with signal artifacts, distortions, or data loss. The images were converted from DICOM to NIFTI format for subsequent analysis.
sMRI processing
Structural MRI data were processed using voxel-based morphometry (VBM) with the VBM toolbox in FSL (https://fsl.fmrib.ox.ac.uk/fsl). The specific steps included removing non-brain tissue using the Brain Extraction Tool (BET), segmenting brain tissue into gray matter, white matter, and cerebrospinal fluid, and registering gray matter images to the Montreal Neurological Institute (MNI) 152 standard space. After volume correction, images were smoothed using a Gaussian kernel with a full width at half maximum (FWHM) of 3 mm.
DTI processing
DTI data were processed using the FSL toolbox, including corrections for eddy currents and head motion, followed by skull stripping. A tensor model was fitted using the least squares method to obtain voxel-wise fractional anisotropy (FA) values. Tract-Based Spatial Statistics (TBSS) was then applied to the FA data. The FA images were aligned to the FMRIB58_FA template and registered to MNI152 standard space. A mean FA image was created to generate the FA skeleton, onto which individual FA data were projected. The Johns Hopkins University (JHU) ICBM-DTI-81 white matter atlas was used to anatomically locate white matter tracts showing significant differences.
fMRI processing
Functional MRI data were processed using the CONN toolbox (RRID: SCR_009550_22.a) and SPM8 (RRID: SCR_007037_12.7771). Preprocessing steps included removal of initial time points, slice timing correction, realignment (excluding images with translational movements ≥ 3 mm or rotational movements ≥ 3°), normalization, smoothing with a 3 mm Gaussian kernel, detrending, and nuisance covariate regression. The amplitude of low-frequency fluctuation (ALFF) and fractional ALFF (fALFF) were calculated for each group. ALFF was defined as the square root of the power spectrum within the low-frequency range, representing the level of spontaneous neuronal activity. fALFF was calculated as the ratio of the ALFF of each voxel to the total power across the entire frequency range, without band-pass filtering.
Seed-based analysis
Regions showing significant differences and correlations with medication use frequency were selected as regions of interest (ROIs) for calculating resting-state functional connectivity. The time series of these ROIs were correlated with the time series of all brain voxels to obtain Pearson correlation coefficients, which were then transformed into z-values using Fisher’s r-to-z transformation.
Statistical analyses
First, data distribution and variance homogeneity were assessed using Shapiro-Wilk tests and Levene’s tests, respectively. For three-group comparisons (HC, CM + MOH, CM − MOH), normally distributed variables were analyzed using one-way ANOVA, followed by post-hoc tests for pairwise comparisons. Non-normally distributed variables were analyzed using the Kruskal-Wallis H test, followed by post-hoc tests with Bonferroni correction for multiple comparisons. For two-group comparisons (CM + MOH and CM − MOH), normally distributed variables were analyzed using independent t-tests, while non-normally distributed variables were analyzed using Mann-Whitney U tests. Categorical variables were analyzed using chi-square tests or Fisher’s exact tests, as appropriate. Table 1 was restructured to report both overall and pairwise comparisons. The Overall P-value column presents the results of ANOVA or Kruskal-Wallis tests for three-group comparisons, while the Pairwise P-value column reports the results of t-tests or Mann-Whitney U tests for comparisons between CM + MOH and CM − MOH groups, along with the Bonferroni correction results. All statistical analyses were performed using SPSS, with a significance threshold of P < 0.05.
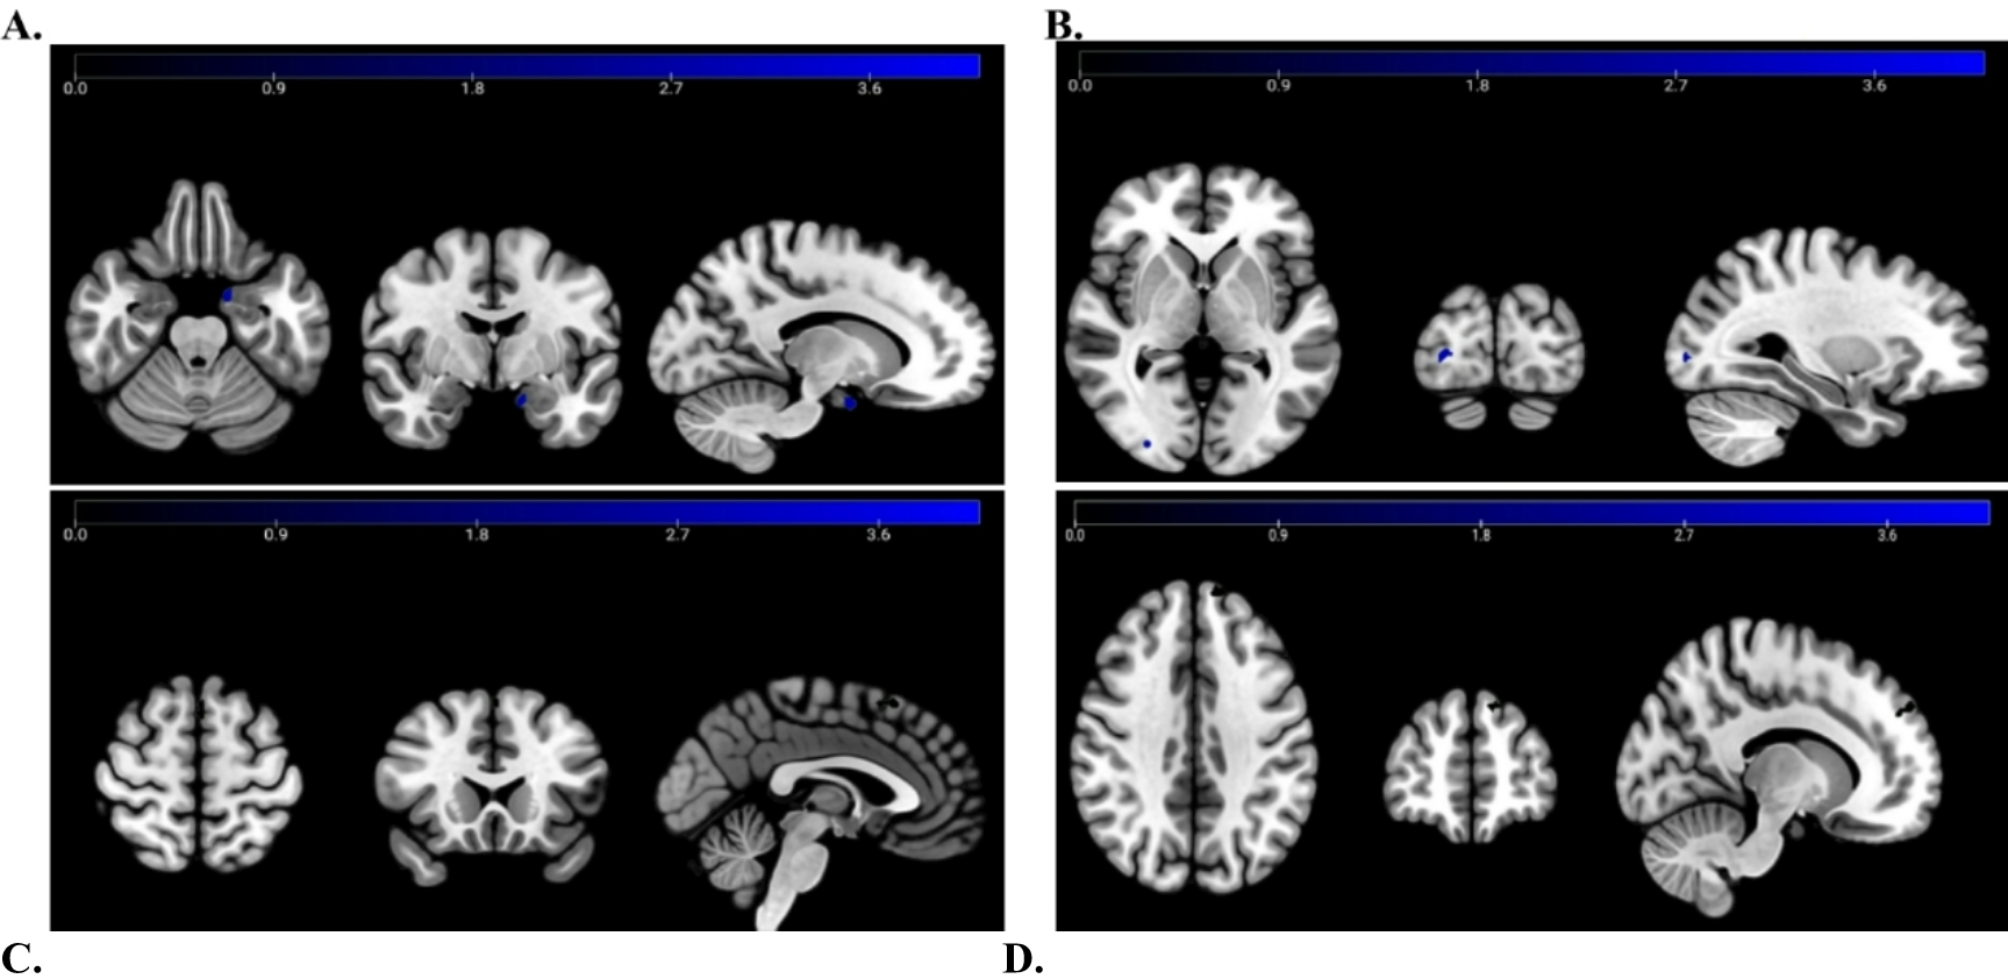
Table 1 Demographic and clinical characteristics of the participantsFor group comparisons of multimodal MRI data, permutation-based non-parametric testing (5000 permutations) was performed.Significant differences in brain components were detected using the Threshold-Free Cluster Enhancement (TFCE) method, with a voxel threshold set at P < 0.001. Multiple comparisons were corrected for by using the Family-Wise Error (FWE) rate, and only clusters containing at least 10 contiguous voxels were considered significant. Generalized Linear Models (GLMs) were applied to analyze the significant clusters, exploring correlations between gray matter volume, ALFF, fALFF values, and white matter integrity with the number of analgesic use days and headache frequency. Age, PHQ-9, GAD-7, and PSQI scores were included as covariates to control for potential confounding variables. The analysis aimed to identify brain region metrics specifically associated with the frequency of acute analgesic use. Statistical significance was determined at P < 0.05.


Comments (0)