
Remember me


Plasma EVs obtained from participants with ovarian cancer (OC, n = 37), benign tumor (BE, n = 22), and clinically healthy control patients (CON, n = 46) were isolated in order to identify potential biomarker candidates. The clinical characteristics of the patients are summarized in Table 1. The P-value for age was less than 0.001, indicating a statistically significant age difference among the participant groups. Conversely, there was no statistically significant difference in terms of BMI (P-value = 0.618). The majority of OC cases (89.2%) were classified as high-grade serous. Among patients with malignant tumors, there were 9, 1, 24, and 3 patients in stages I, II, II, and IV respectively.
Isolation and evolution of EVsThe EVs derived from the OC, BE, and CON participants were isolated from 5 mL of plasma using differential ultracentrifugation. TEM, NTA and western blotting were used to validate the quality of the isolated EVs from plasma (Fig. 2). TEM showed that the vesicles were spherical membrane structure with a size range of 50–150 nm (Fig. 2A). In addition, the NTA size distribution showed that the median diameter of EVs was 126.5 nm (range: 100—500 nm), which is consistent with other studies [7] (Fig. 2B). The NTA also revealed a nanoparticle concentration of 1.45 × 10⁹ particles/mL. Based on the formula below, the derived from OC tissue concentration of EVs in the original plasma sample was estimated to be 1.16 × 10⁹ EVs/mL.
Fig. 2
The characterization of EVs. A Representative electron microscopy micrograph of EVs isolated from plasma (indicated by arrows), bar = 200 nm. B NTA analysis to determine the size distribution and number of EVs. C Western blotting validated EVs through CD63 and TSG101
$$}} \, }\text \, \text\frac}\text}\times \frac\text}}=\frac^}}\times \frac}}=1.16\times ^/\text$$
The membrane proteins CD63 and TSG101 (common EV markers) were highly enriched in EVs from patients detected by western blotting (Fig. 2C). Due to the utilization of all EV samples from the plasma of OC patients, analysis of negative EV markers such as GM130 and GRP94 was not performed in the WB experiment.
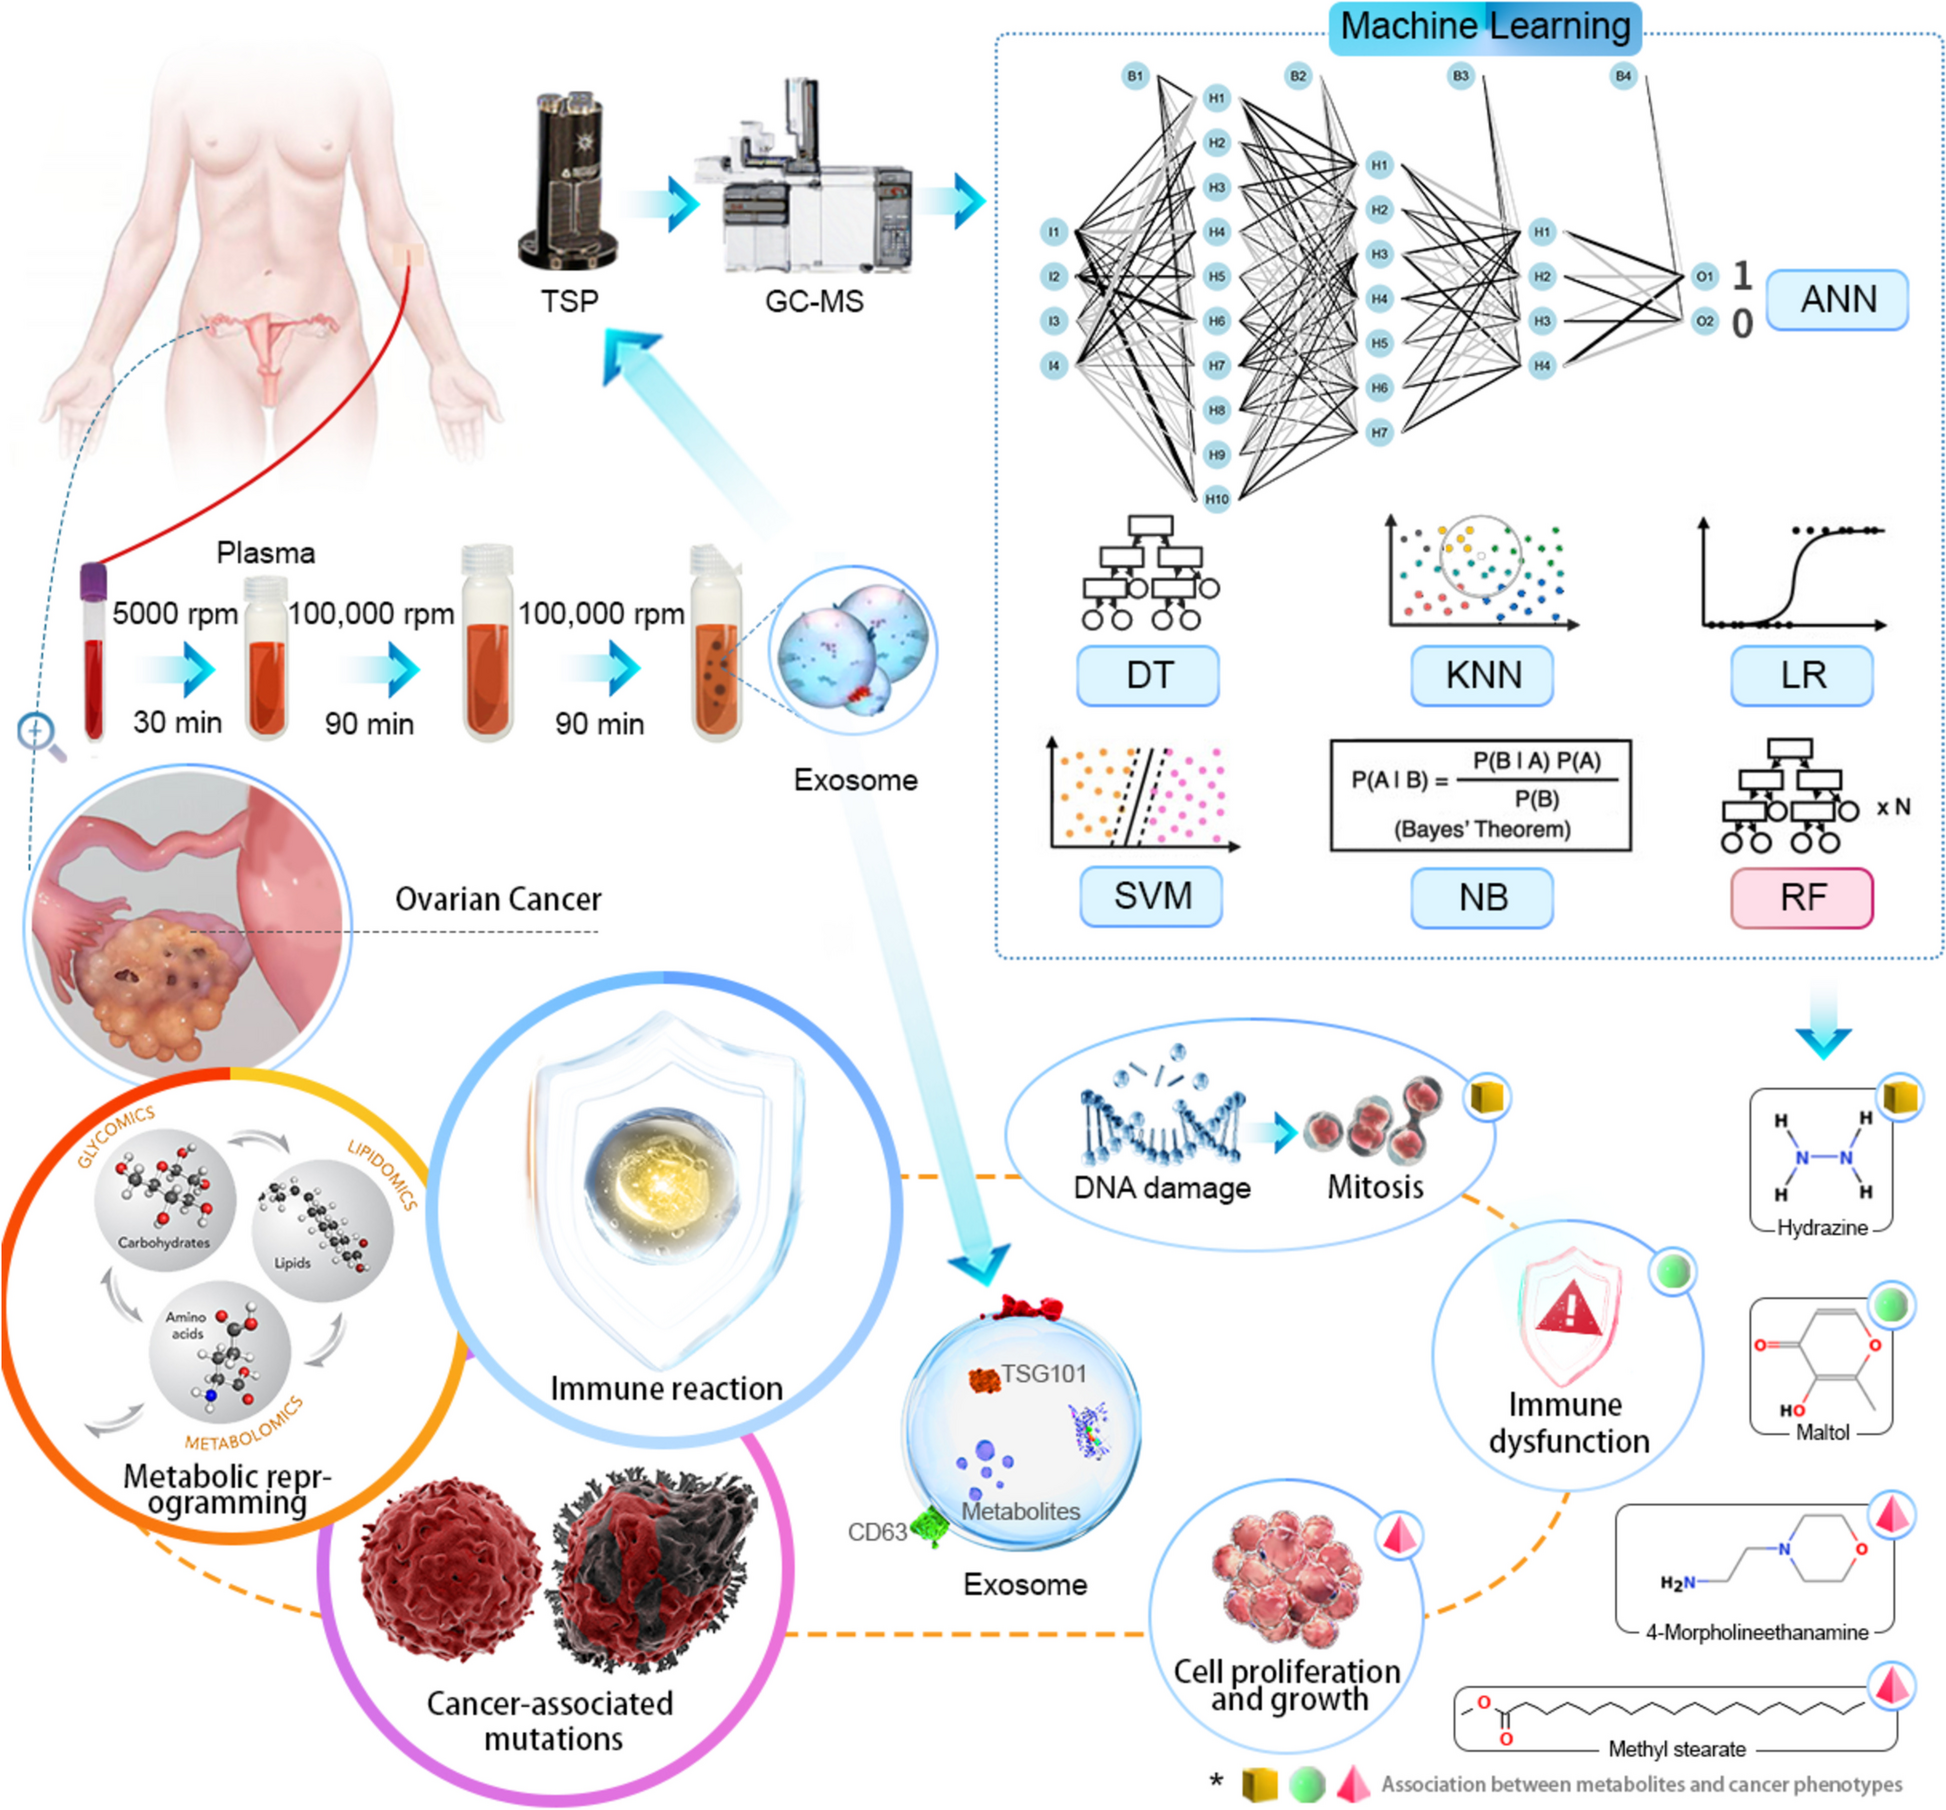
Overall changes in metabolite profilesAlterations in cellular metabolism have been reported in numerous human cancers and are thought to reflect the metabolic demands related to cancer development [29]. In this study we performed comprehensive metabolic profiling of plasma EV samples collected from 105 women diagnosed either with OC, BE, or CON. Uniform manifold approximation and projection (UMAP) was employed utilizing 388 chromatographic peaks identified in EVs. The results demonstrated a distinct separation of EVs among the three groups, as depicted in Fig. 3A. Furthermore, we undertook pairwise comparisons of the metabolite profiles detected in the OC, BE, and CON groups. A total of 19 and 158 metabolites exhibited significant differences in abundance (FC = 1.5, q < 0.01) in the comparisons between OC vs BE and OC vs CON, respectively (Fig. 3B). These differences were visualized through a heat map and volcano plots in Fig. 4A-C. In the comparison between the OC and BE groups, the quantities of 9-octadecenamide and 1,4-methanobenzocyclodecene were significantly elevated in OC group, while maltol showed a significant reduction. The concentrations of 4-amino-furazan-3-carboxylic acid 2-hydroxy-4-methoxybenzaldehyde, N-phenylethyl, and 4-morpholineethanamine were significantly higher in the OC group than in the CON group, while the remaining metabolites, including hydrazine and pyridine sulfonamide, were lower. Several of the identified metabolites have been previously implicated in cancer pathogenesis. For instance, Spencer and Kisby demonstrated that hydrazine induces DNA damage, which consequently leads to mutations and unregulated mitosis [24]. Similarly, another study reported that maltol substantially inhibited tumor growth through the enhancement of immune function, induction of apoptosis, and inhibition of angiogenesis [14]. Our findings are consistent with those of Bachmayr et al. [2], who observed alterations in the blood metabolites of OC patients; specifically, reductions in lipids and amino acids were directly associated with tumor metabolism and facilitated cellular proliferation and growth [2]. Collectively, these metabolites showing differential abundancies are linked to cancer-related mutations, immune responses, and metabolic reprogramming, thus indicating their potential utility as diagnostic biomarkers for OC.
Fig. 3
UMAP, Upset plot, and Venn diagram of EV samples from study participants. A UMAP clustering of all participant samples colored according to the participant group; each point in the plot represents a participant. Red dots represent the benign tumor group (n = 22), green dots indicate the control group (n = 46), and blue dots represent samples derived from the ovarian cancer group (n = 39). B Upset plot and Venn diagram of metabolites with differential abundance (p < 0.05). The individual or connected dots represent the various intersections of metabolites that were either unique to, or shared among, comparisons
Fig. 4
Metabolite profiles of the EV samples from study participants. A Heat Map showing the profile of metabolites in plasma EV samples and their metabolic classifications. The relative concentration of metabolites in the samples are expressed on a log2 scale. The red block indicates that the metabolite level in the divisor array is higher than that in the divisor array, while the blue block indicates that the metabolite level in the divisor array is lower than that in the divisor array. Only metabolites with both p-value and q-value less than 0.01 in the logistic regression adjusted for age and BMI are displayed. B<C Volcano plot of the metabolites with differential abundance (p < 0.05, FC > 1.5). Red dots indicate upregulation and blue dots indicate downregulation
Metabolic pathway enrichment analysisTo gain further insights into the biological role of the identified metabolites, we conducted a pathway enrichment analysis using the KEGG metabolic network database (Fig. 5A). The results of the predicted pathway analysis revealed that only the butanoate metabolism pathway was upregulated in EVs derived from the OC group. In contrast, nearly all other metabolic pathways, including carbohydrate metabolism, lipid amino acid metabolism, cofactor metabolism, vitamin metabolism, and xenobiotic biodegradation, were found to be downregulated in the OC group. Furthermore, the metabolites with differential abundance were then mapped to 17 significant metabolic pathways including glycolysis, gluconeogenesis, and the metabolism of glyoxylate, dicarboxylate, butanoate, glutathione, glycerophospholipid, pyruvate, glycine, serine, threonine, tyrosine, phenylalanine, tryptophan, nicotinate, nicotinamide, propanoate, ubiquinone, and bile acids as illustrated by the Sankey diagram in Fig. 5B. Other studies have found similar metabolic alterations in OC. For example, Zhong et al. observed an upregulation of glutathione metabolism in women diagnosed with this malignancy [29]. Elevated glutathione metabolism has been shown to accompany tumor growth, presumably to counteract the increased oxidative stress arising from accelerated metabolic rates [9, 12, 29]. In addition, Denkert et al. revealed elevated levels of amino acid intermediates, such as glycine, in OC tissues [8]. The increase in amino acid metabolism suggests that substantial pools of intermediate nutrients are being mobilized for molecular assembly in cancer cells. Research by Xu et al. demonstrated that butyrate promotes cancer cell apoptosis by acting as a SIRT3 inhibitor. The authors showed that butyrate-induced acetylation of Pyruvate Dehydrogenase E1 Subunit Alpha 1 (PDHA1) alleviated the inhibitory phosphorylation of PDHA1 at serine 293, thereby facilitating the flow of glycolytic intermediates into the tricarboxylic acid (TCA) cycle and reversing the Warburg effect. Meanwhile, high levels of acetylation induced by butyrate inactivated complex I of the electron transport chain, preventing its use as an intermediate in the TCA cycle. These metabolic stresses promote apoptosis in high-glucose cancer cells. The findings reported by Xu et al. further support the upregulation of butyrate observed in the OC group in this study. In conclusion, this research provides novel insight into the metabolite phenotype of plasma EVs that discriminates OC from BE and normal ovarian pathophysiology.
Fig. 5
Different metabolic pathways and metabolic networks in ovarian cancer (OC) and clinically healthy control patients (CON) groups. A Activities of metabolic pathways in EVs derived from the plasma of the OC and CON groups. Red dots and lines represent the metabolic activities in EVs from the CON group that were adjusted to 0. Blue triangles represent metabolic activities in EVs from the OC group relative to the CON group. The metabolic activities are expressed on a log2 scale. The triangle size indicates the number of identified metabolites in the pathway. Only the metabolic pathways with a significant p-value less than 0.01 (Logistic regression with age as a confounding factor) are plotted. B A Sankey diagram displaying how the metabolites with differential abundance connect to their participating metabolic pathways
Machine learning algorithms for disease predictionIn order to determine which metabolites can be used to discriminate the OC group from the BE and CON groups, we used binary classification algorithms including artificial neural network (ANN), decision tree (DT), K nearest neighbor (KNN), logistics regression (LR), Naïve Bayes (NB), random forest (RF), and support vector machine (SVM). Prior to modelling for the OC-BE and the OC-CON comparison groups with 59 and 83 samples respectively, each group was shuffled randomly. To avoid overfitting, the model was built using split data, 60% of the training and 20% of the test set and validation set.
As a result of applying these the algorithms to the dataset, a panel of metabolites in the plasma EVs was identified from 388 features. This included 1,4-methanobenzocyclodecene, 9-octadecenamide, methyl stearate, 4-morpholineethanamine, decanoic acid, aminophenylacetylene, lacthydrazide, pentanone, 2,4-ditert butylphenol, phenol, 3,5-dimethoxy, phenpropionic acid and silacyclopentane. The contributions of the nominated metabolites to the performance of each machine learning algorithm were ranked (Supplementary Fig. 1). The area under the curve (AUC) of biomarker signatures discriminating the OC from the CON and BE groups are displayed in Table 3. RF (0.91), and ANN (0.90) and NB (0.90) resulted in the highest AUC values with F1-scores of 0.88, 0.83, and 0.76, respectively, for the OC-CON comparison. Meanwhile, for the OC-CON comparison, the RF classifier displayed the best discrimination power (AUC value of 0.91) based on the top-ranking features. For the OC-BE comparison, SVM (0.94), RF (0.86), and KNN (0.86) gave the highest AUC values with F1-scores of 0.80, 0.80, and 0.91, respectively. To further assess the performance of the top-ranking features, an independent plasma EV dataset (n = 29) was recruited to validate the models. We observed that the external validation of the independent EV dataset yielded AUC values of 0.86 (RF and SVM) and 0.91 (KNN and SVM) for the OC-BE and OC-CON comparisons, respectively (Supplementary Table 1). Notably, RF provided the overall best performance for both model tests and the validation because it is a machine-learning approach for binary classification and can handle smaller datasets well [27]. DT and LR appeared to give the worst performance, likely due to underfitting resulting from a smaller dataset [13]. Considering the pros and cons of the different machine learning algorithms (Supplementary Table 2), we determined that RF was an appropriate model for our relatively small dataset and binary research question.
Table 3 Performance of 7 machine learning modelsDespite the promising discriminative power of RF model for distinguishing between the OC and CON/BE groups, the identified top-ranking signatures, including 4-morpholineethanamine (100), maltol (100), 4-Amino-furazan-3-carboxylic acid (89), and bicyclo[5.2.1]decan-10-one (87) have not previously been reported as diagnostic biomarkers for OC. For example, Zhong et al. have shortlisted several metabolites, such as succinic acid, lactic acid, itaconic acid, malic acid, glutamic acid and glutathione, as potential biomarkers for OC in plasma and urine [29]. Liu et al. conducted a screening of nine differential metabolites from 37 OC tissues and their ascites [15]. The metabolites were 20-COOH-leukotriene E4, 1,25-dihydroxyvitamin D3-26,23-lactone, 20a,22b-dihydroxycholesterol, 3a,6a,7b-trihydroxy-5b-cholicacid, and 3a,7a,12a,19-tetrahydroxy-5b-cholic acid [15]. We have identified different diagnostic metabolites. One possible reason for this discrepancy is that our study primarily focused on plasma EVs, while other research predominantly employed conventional biological specimens such as tissue, plasma, hair, and ascites. Furthermore, in order to investigate the trace metabolite concentrations within plasma EVs, we employed a novel TSP. This probe enabled direct analysis of metabolites without sample preparation, which is superior to the conventional method of organic liquid extraction used for mass spectrometry analysis.
Despite the promising results, several limitations of our research merit discussion. Firstly, the ovaries are situated deep within the pelvic cavity, and early-stage ovarian lesions often present with non-specific clinical symptoms. By the time symptoms manifest and patients seek medical help, approximately 70% are already in advanced stages. Furthermore, distinguishing between benign and malignant tissue types is particularly challenging. During exploratory laparotomy for OC, it is observed that only a small percentage of tumors are confined to the ovaries; the majority have already metastasized to the bilateral adnexa, greater omentum, and other pelvic organs. Consequently, OC presents substantial challenges in both diagnosis and treatment. Due to the difficulty of early detection, most clinical samples come from patients with stage III or IV OC, with very few at an early stage. To enhance early diagnosis, we will continue to collect clinical samples and related follow-up data from early-stage OC patients in future studies.
Comments (0)