
Remember me


The final study population consisted of 67,936 pregnant women. The baseline characteristics of the study population are presented in Table 1. In this study, the average maternal age (mean ± SD) was 31.0 ± 3.9 years, 12,667 (18.6%) women were 35 years old and above; the average pre-pregnancy BMI (mean ± SD) was 21.2 ± 2.7 kg/m2, 9487 (14.0%) women were underweight, and 9402 (13.9%) women were OWO. A total of 46,599 (68.6%) women were primiparous, 4655 (6.9%) were below college education, 52,305 (77.0%) held medical insurance.
The median (IQR) of FPG level was 4.6 (4.3–4.8) mmol/L, the median (IQR) of TG level was 1.2 (1.0–1.5) mmol/L, and the TyG index (mean ± SD) was 8.4 ± 0.4. The average fetal birthweight (mean ± SD) was 3309.5 ± 434.1 g, 35,043 (51.6%) fetal were male and 32,893 (48.4%) were female. A total of 10,680 (15.7%) women had GDM, 4104 (6.0%) women had HDP, 3449 (5.1%) fetuses were born PTB and 6021 (8.9%) fetuses were LGA.
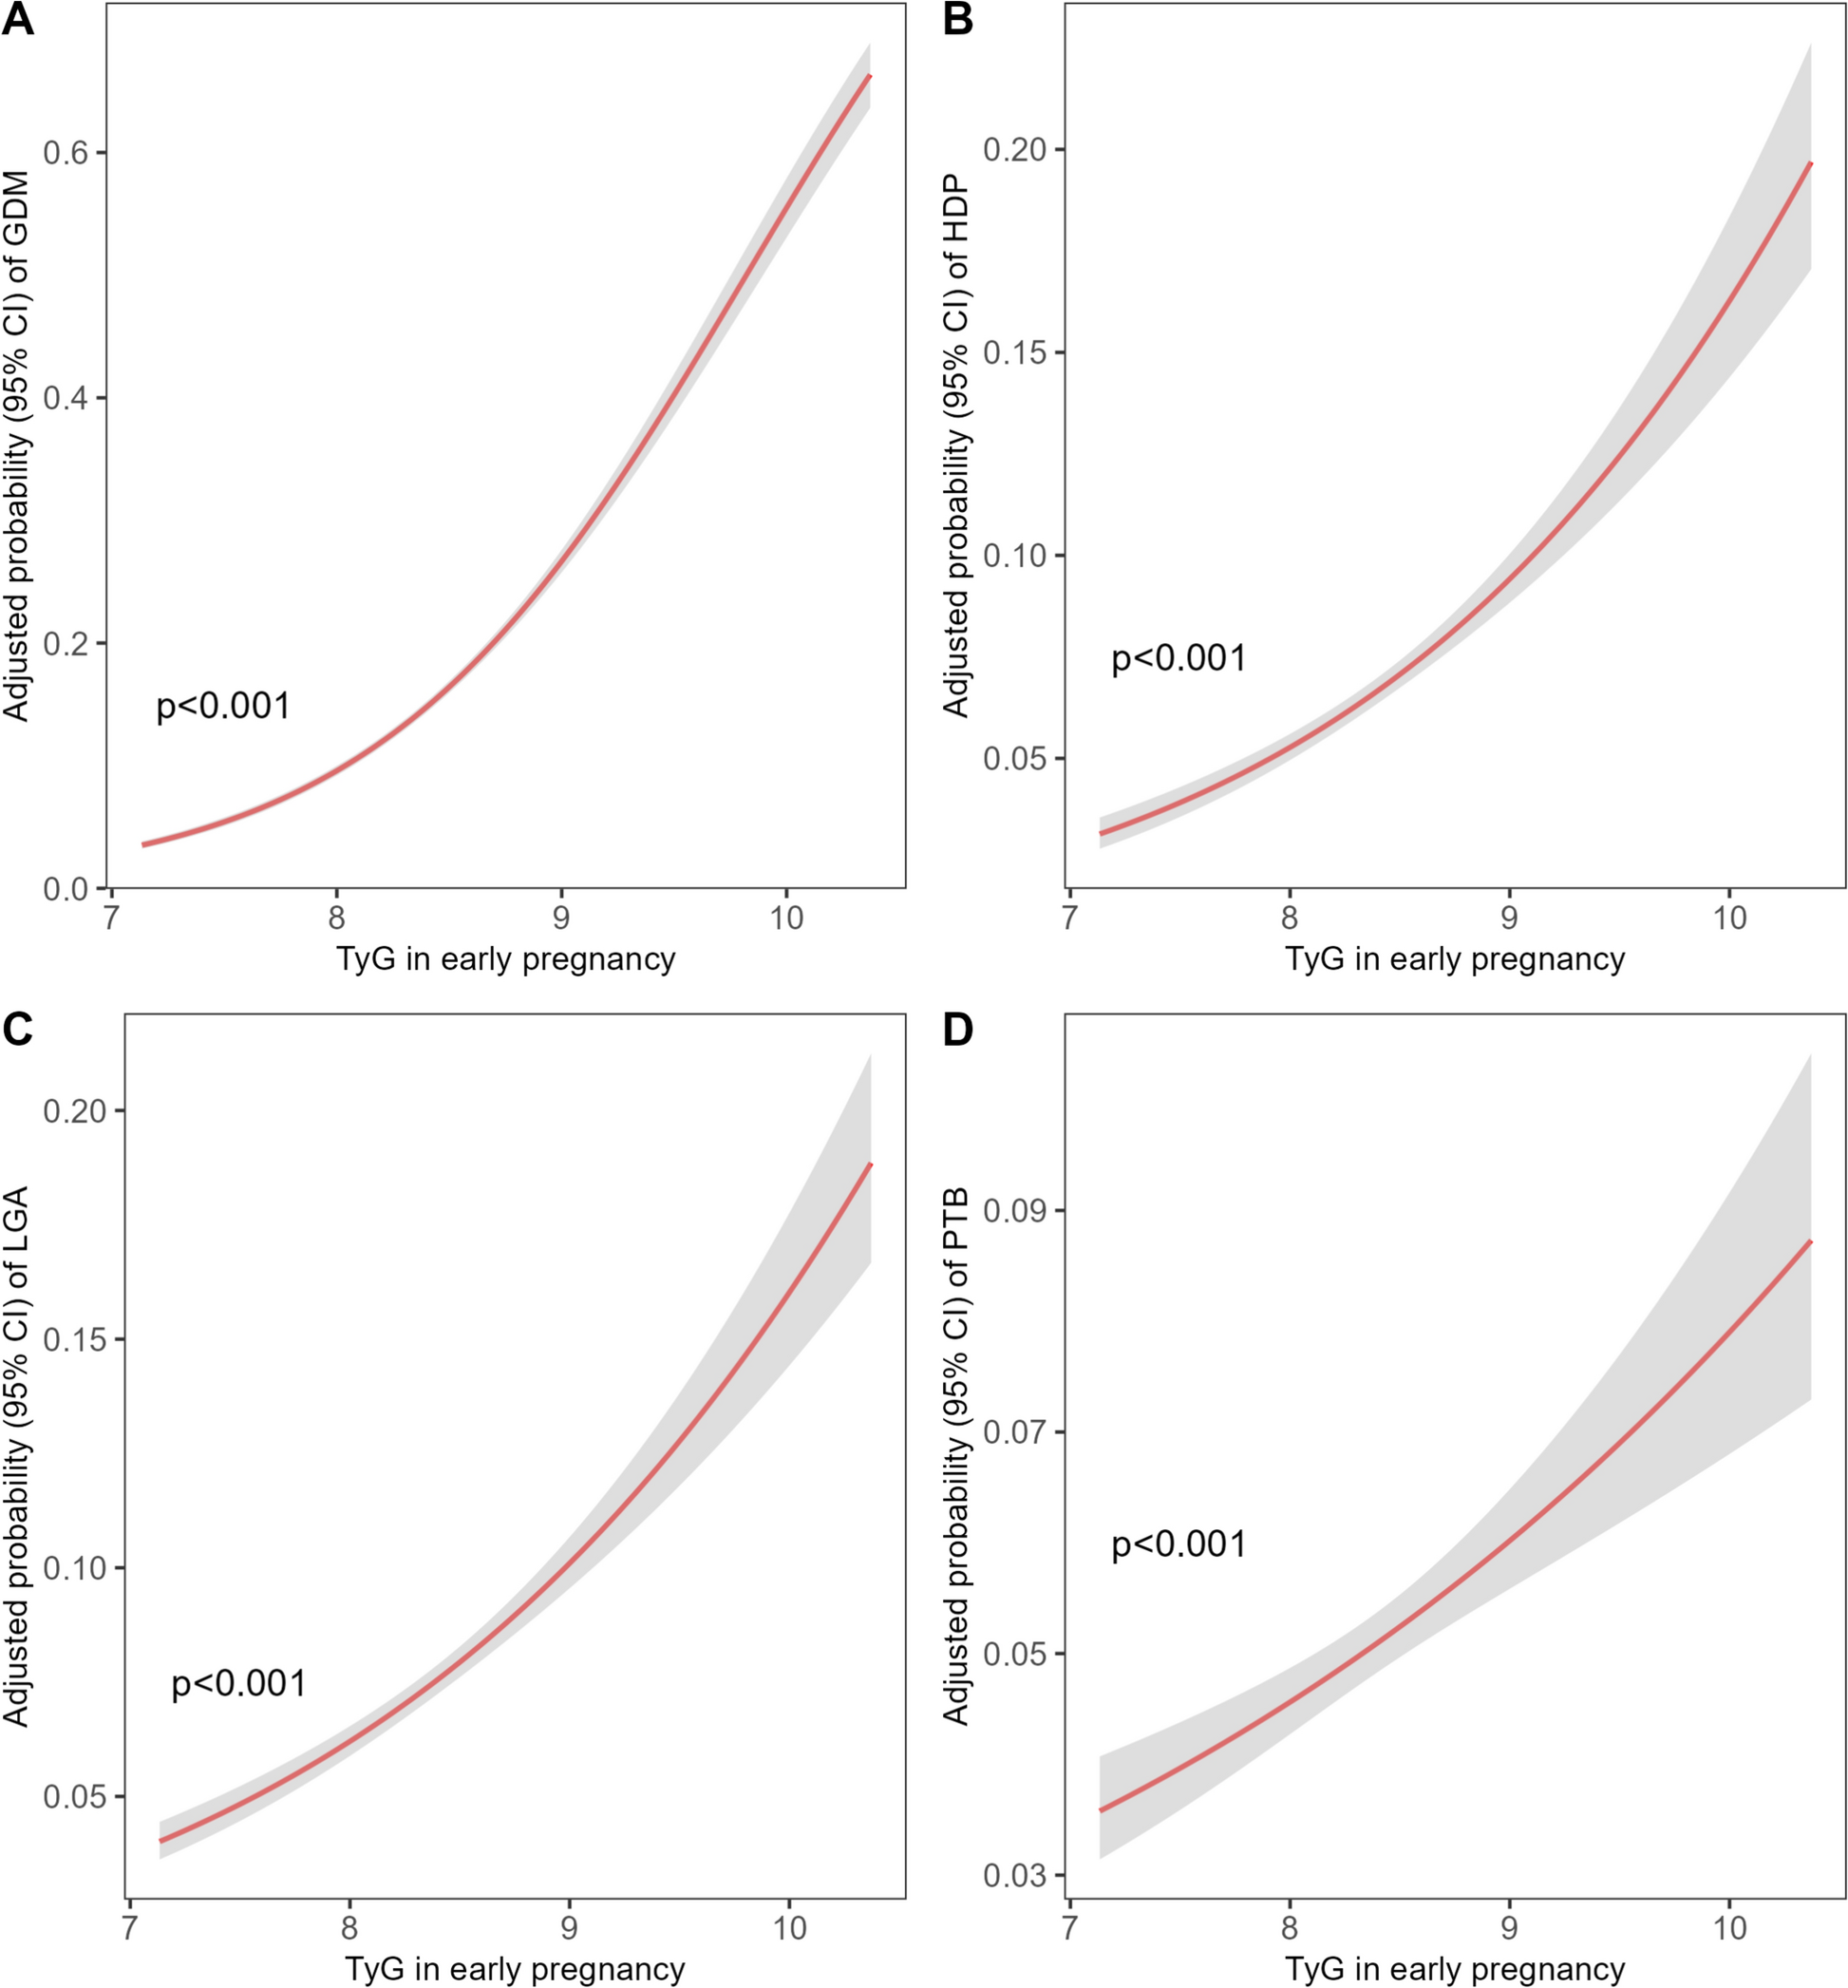
Association between early pregnancy TyG index and the adverse pregnancy outcomesAfter adjusting for potential confounders, the multivariable logistic models demonstrated significant positive relationships between continuous TyG index in early pregnancy and risk of all the APOs, including GDM, HDP, LGA, and PTB (all P < 0.001; Fig. 1). As shown in Fig. 2, the incidences of GDM, HDP, LGA and PTB in women with TyG index less than 25th percentile (P25) were 8.32, 4.22, 6.1 and 4.32%. And the ratios for GDM, HDP, LGA and PTB were 37.39, 11.71, 16.39 and 7.47% for women with TyG index above P95, respectively. Compared with women with TyG index < P25, the adjusted ORs (aORs) of GDM were as follows: P25 to P50 (1.46; 95% CI, 1.36–1.57), P50 to P75 (1.90; 95% CI, 1.77–2.04), P75 to P90 (2.59; 95% CI, 2.41–2.79), P90 to P95 (3.47; 95% CI, 3.16–3.82), P95 or higher (4.88; 95% CI, 4.45–5.35). Similarly, compared with women having TyG index < P25, the highest risks of HDP, LGA and PTB were identified among women with higher TyG index (≥P95), with the aORs 2.31 (95% CI, 2.02–2.65), 1.95 (95% CI, 1.74–2.19), 1.56 (95% CI, 1.34–1.82), respectively (all P < 0.001; Fig. 2).
Fig. 1
Association between Triglyceride-glucose index in early pregnancy the risk of adverse pregnancy outcomes. Multivariable logistic regression models with restricted cubic splines were applied to explore the dose–response relationship between maternal Triglyceride-glucose (TyG) index in early pregnancy and the risk of GDM (A), HDP (B), LGA (C) and PTB (D). These models were adjusted for maternal age, education, parity, and insurance status. BMI body mass index (calculated as weight in kilograms divided by height in meters squared), TyG Triglyceride-glucose, GDM gestational diabetes mellitus, HDP hypertensive disorders in pregnancy, LGA large for gestation age, PTB preterm birth
Fig. 2
Effect of triglyceride-glucose index in early pregnancy on pregnancy complications. Multivariable analysis was used to estimate the association of TyG in early pregnancy with risk of pregnancy complications and outcomes. All analyses were adjusted for age, education, parity, health insurance status, and pre-pregnancy BMI. TyG values in early pregnancy were divided into different quartiles (Q) categories. All analyses were adjusted for maternal age, education, parity, insurance status, and ALT level. Adjusted odds ratios (aOR) and risk differences of GDM, HDP, LGA and PTB for different TyG categories are calculated by comparing with the reference group (TyG < 25th). All risk differences, adjusted odds ratios, and the corresponding 95% CIs for each were calculated from the results of the multivariable model and adjusted for baseline risk imprecision. BMI body mass index, TyG Triglyceride-glucose, aOR adjusted odds ratios, Q quartiles, GDM gestational diabetes mellitus, HDP hypertensive disorders in pregnancy, LGA large for gestational age, PTB preterm birth
Interaction and stratification analysis of pre-pregnancy BMI and TyG index on risk for adverse pregnancy outcomesWe further investigated the potential modification effect of pre-pregnancy BMI on the association of early pregnancy TyG index with APOs. As displayed by heatmaps (filled contour plot) in Fig. 3, there was a significant interaction between TyG index in early pregnancy and pre-pregnancy BMI on the risk of GDM, HDP, and LGA (all P < 0.05). The probability of GDM (P for interaction = 0.001; Fig. 3A), HDP (P for interaction = 0.018; Fig. 3B), and LGA (P for interaction = 0.010; Fig. 3C), were considerably different according to the levels of early pregnancy TyG index and pre-pregnancy BMI. However, the probability of PTB did not differ when a combination of the TyG index and pre-pregnancy BMI were assessed (P for interaction = 0.095; Fig. 3D).
Fig. 3
The combined effect of early pregnancy FPG and pre-pregnancy BMI on pregnancy complications. Heatmap (filled contour plot) for the correlation of risk of pregnancy outcomes, including GDM (A), HDP (B), LGA (C), and PTB (D) according to the interaction of early-pregnancy FPG and pre-pregnancy BMI. Red indicates an increased risk of a pregnancy outcome, while blue indicates a decreased risk. The analysis was adjusted for maternal age, education, parity, and insurance status. BMI body mass index (calculated as weight in kilograms divided by height in meters squared), TyG Triglyceride-glucose, GDM gestational diabetes mellitus, HDP hypertensive disorders in pregnancy, LGA large for gestational age, PTB preterm birth, CI confidence intervals
The association between early-pregnancy TyG index and risk of APOs were further stratified by different pre-pregnancy BMI categories (Table 2). Among women with OWO, higher TyG index quartile (Q4) was notably associated with an incremental risk of GDM (crude OR, cOR, 3.99, 95% CI, 3.29–4.85; aOR, 3.82; 95% CI, 3.14–4.64), HDP (cOR, 1.20, 95% CI, 0.99–1.47; aOR, 1.34; 95% CI, 1.10–1.64), LGA (cOR, 1.92, 95% CI, 1.56–2.36; aOR, 1.78; 95% CI, 1.44–2.19) and PTB (cOR, 1.58, 95% CI, 1.16–2.16; aOR, 1.53; 95% CI, 1.11–2.09) compared with those having lower TyG index (Q1). Similar patterns were found among women with normal pre-pregnancy BMI, moderately increased risks of GDM (cOR, 3.45, 95% CI, 3.20–3.73; aOR, 3.16; 95% CI, 2.92–3.42), HDP (cOR, 1.75, 95% CI, 1.56–1.96; aOR, 1.94; 95% CI, 1.72–2.18), LGA (cOR, 1.75, 95% CI, 1.60–1.92; aOR, 1.55; 95% CI, 1.41–1.70) and PTB (cOR, 1.40, 95% CI, 1.25–1.58; aOR, 1.31; 95% CI, 1.17–1.48) in women with TyG index in Q4.
Table 2 Associations between maternal blood TyG index in early pregnancy and the risk of adverse maternal and fetal outcomes stratified by maternal pre-pregnancy BMIPredictive value of the combination of pre-pregnancy BMI and early pregnancy TyG index for adverse pregnancy outcomesSubsequently, we assessed the potential predictive value of TyG and BMI, individually or in combination, on APOs risk using a multivariable logistic regression model adjusted for maternal age, education level, parity, and health insurance status. In the test cohort (Fig. 4), we demonstrated that the AUCs were significantly improved with the addition of BMI × TyG index for GDM [AUC = 0.684 (95% CI, 0.677–0.691)], HDP [AUC = 0.690 (95% CI, 0.68–0.701)], and LGA [AUC = 0.658 (95% CI, 0.650–0.666)] indicating the superior efficacy of the combined index in this study. The ROC curve of PTB indicated an AUC of 0.567 for the combined metric, suggesting limited prediction capability of TyG × BMI for PTB. Similar findings were observed in the validated cohort (Fig. S2 in the Supplementary material).
Fig. 4
Predictive performance of the combined early-pregnancy TyG and pre-pregnancy BMI for pregnancy complications in the test cohort (N = 50,569). The enhanced predictive value of combining pre-pregnancy BMI and early-pregnancy TyG compared to their individual performance, with regards to GDM (A), HDP (B), LGA (C) and PTB (D), the receiver operating characteristic (ROC) curve evaluating the discriminative capabilities by calculating the AUC. TyG × BMI indicates the combined effect of TyG and BMI. AUC area under curve, CI confidence interval, BMI body mass index (calculated as weight in kilograms divided by height in meters squared), FPG fasting plasma glucose, TG triglyceride, TyG Triglyceride-glucose, BMI × TyG interaction term of pre-pregnancy BMI and TyG in early pregnancy, GDM gestational diabetes mellitus, HDP hypertensive disorders in pregnancy, LGA large for gestational age, PTB preterm birth
Sensitivity analysesFurthermore, sensitivity analyses were performed to test the solidity of the modification effect of pre-pregnancy BMI on the association between early-pregnancy TyG index and risks of APOs by exclusions of women with elevated FPG (Table S1 in the Supplementary material), TG (Table S2 in the Supplementary material) and either hyperglycemia or hypertriglyceridemia (Table S3 in the Supplementary material), respectively. We showed that higher TyG index quartile (Q4) was still robustly associated with incremental risks of APOs, especially GDM among women with normal pre-pregnancy BMI or OWO.
Moreover, we found that the predictive values of TyG × BMI on APOs remained prominent among women with normal TG and FPG in early pregnancy, after exclusion of women with high FPG (AUC for GDM: 0.664, 95% CI, 0.658–0.670; Figure S3 in the Supplementary material), high TG (for GDM: 0.660, 95% CI, 0.654–0.667; Figure S4 in the Supplementary material) and those with either condition (for GDM: 0.642, 95% CI, 0.635–0.650; Figure S5 in the Supplementary material), better than individual parameters, including pre-pregnancy BMI, TG, FBG, and TyG index.
Comments (0)