
Remember me
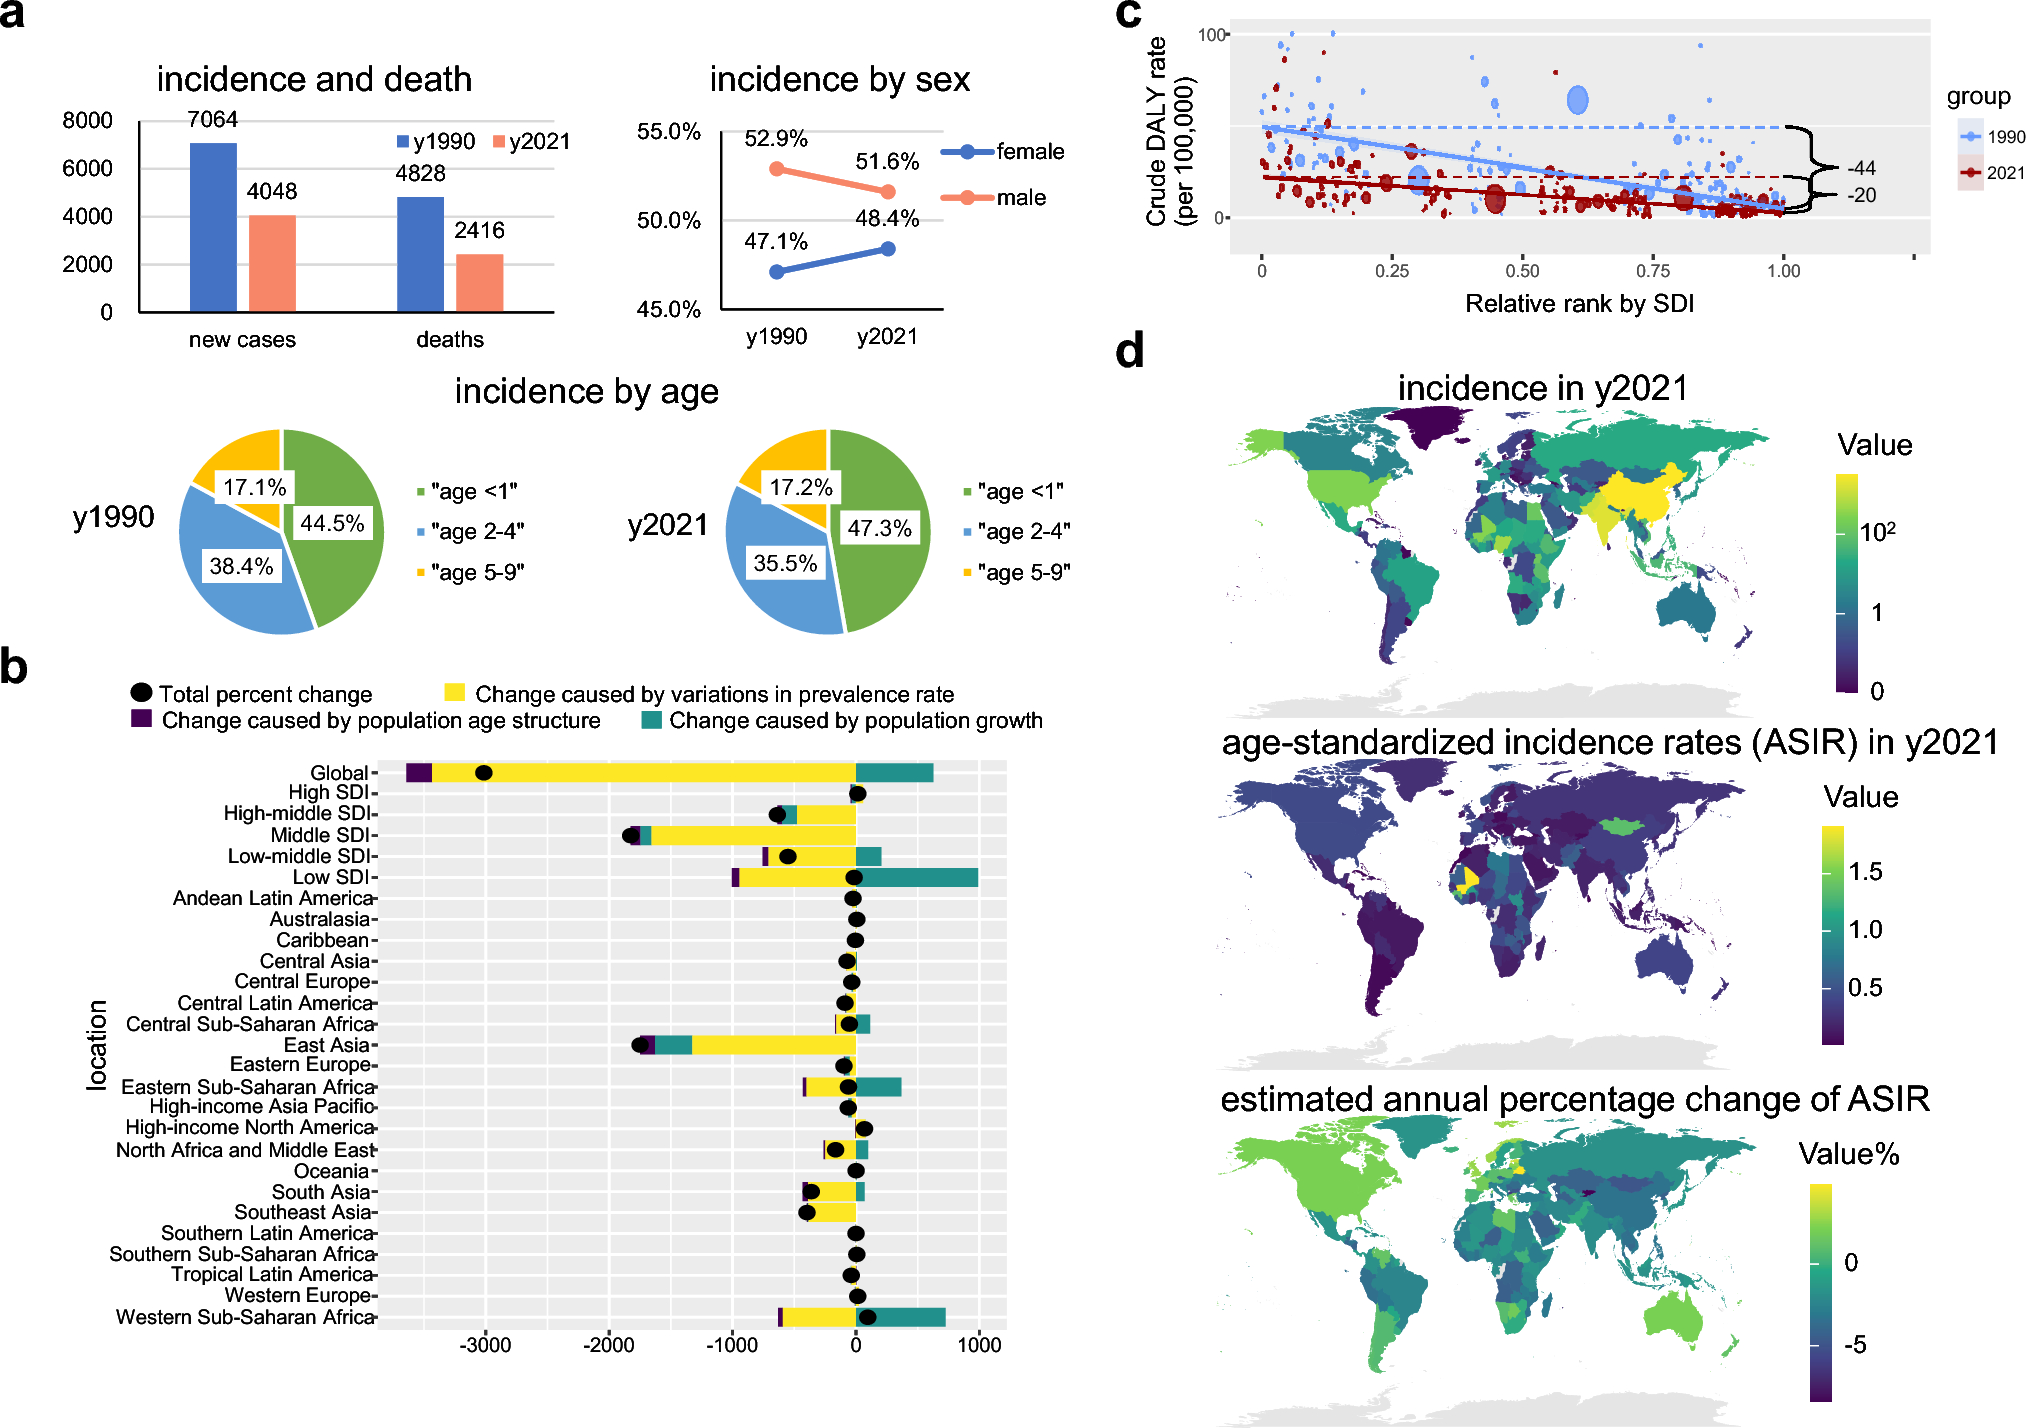
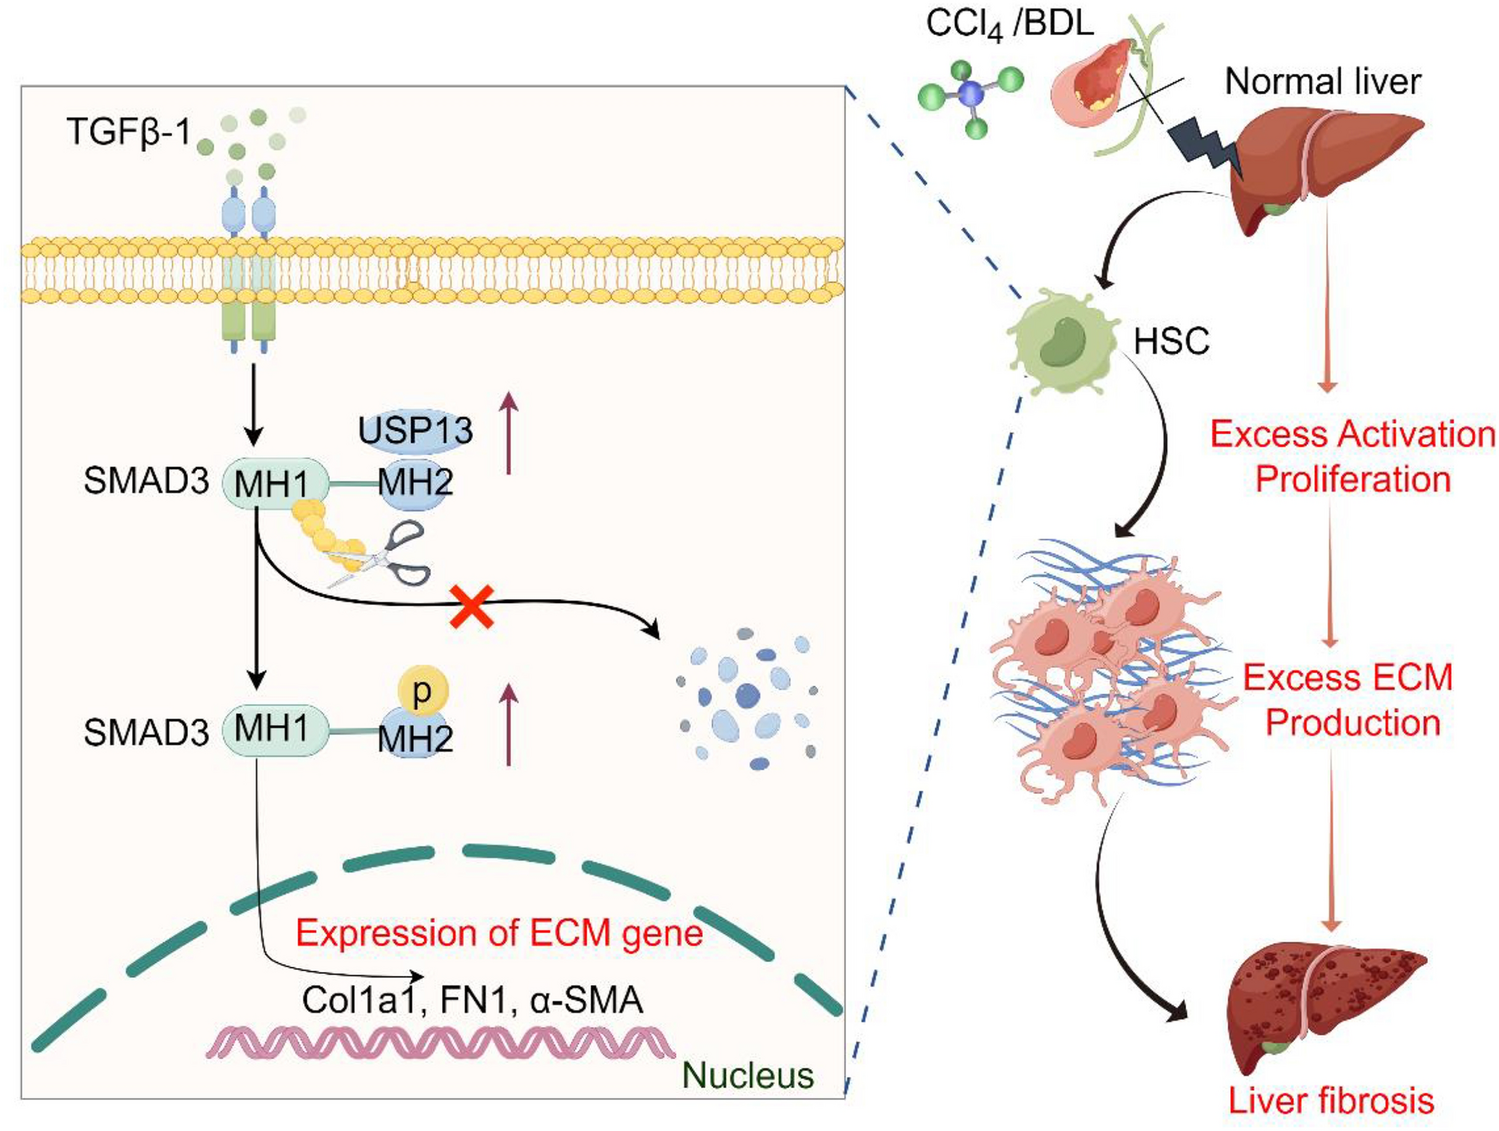
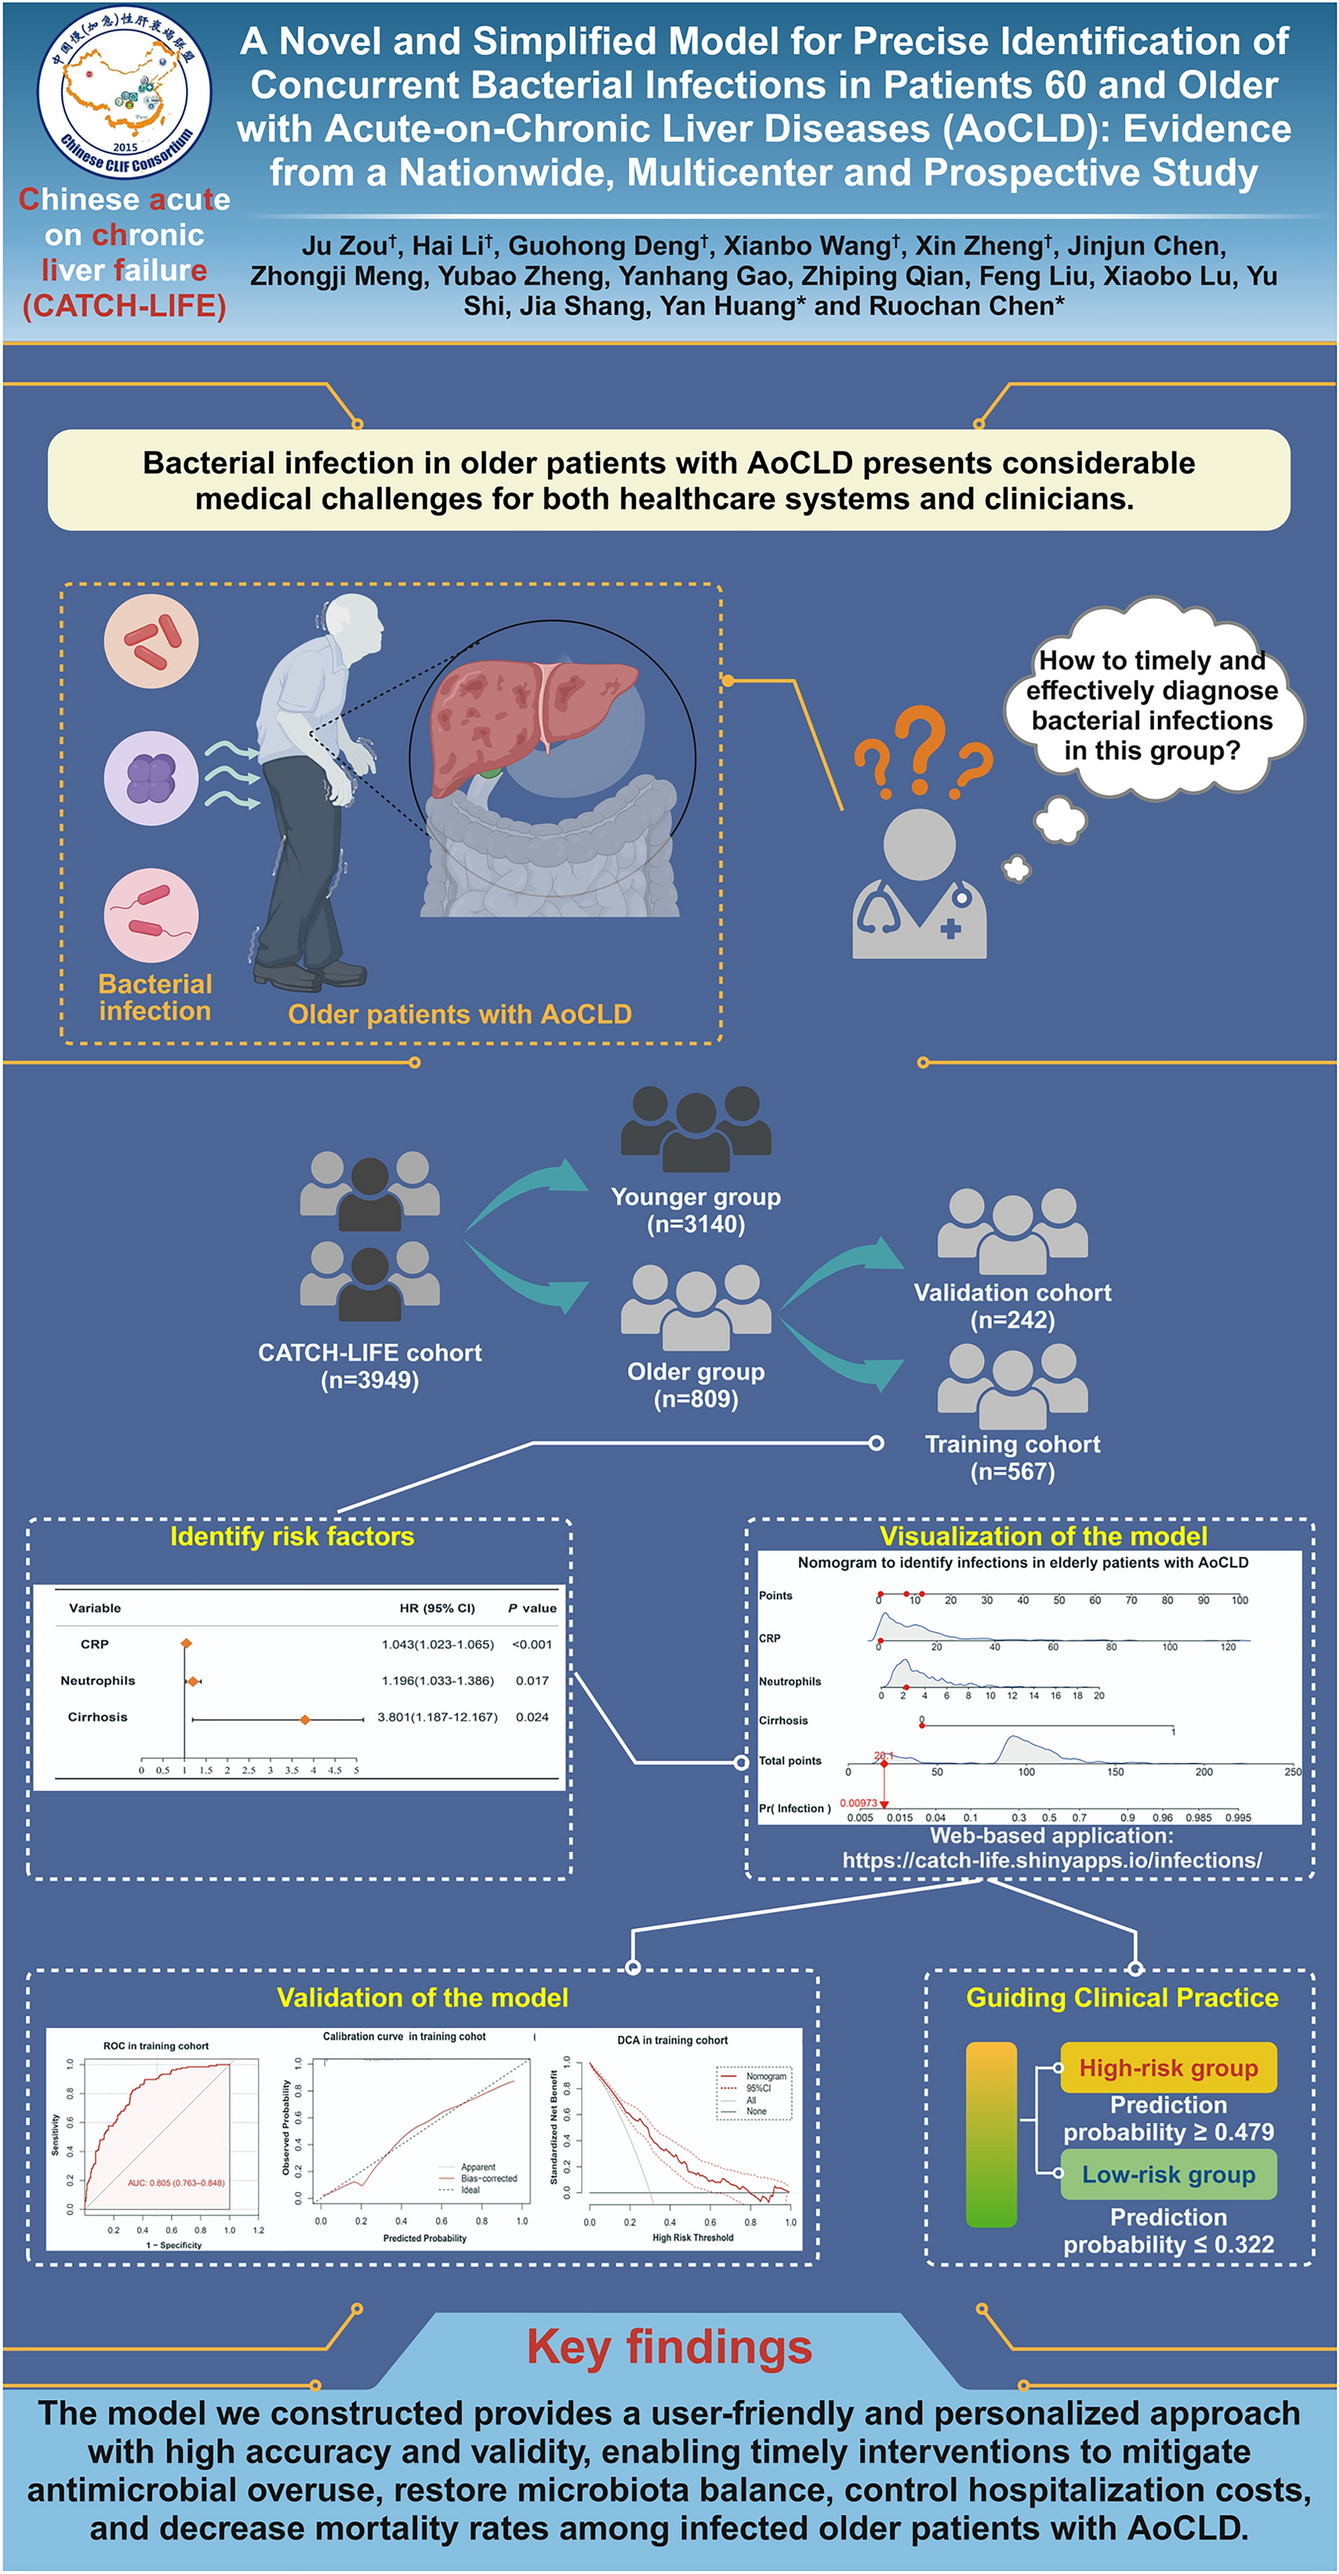

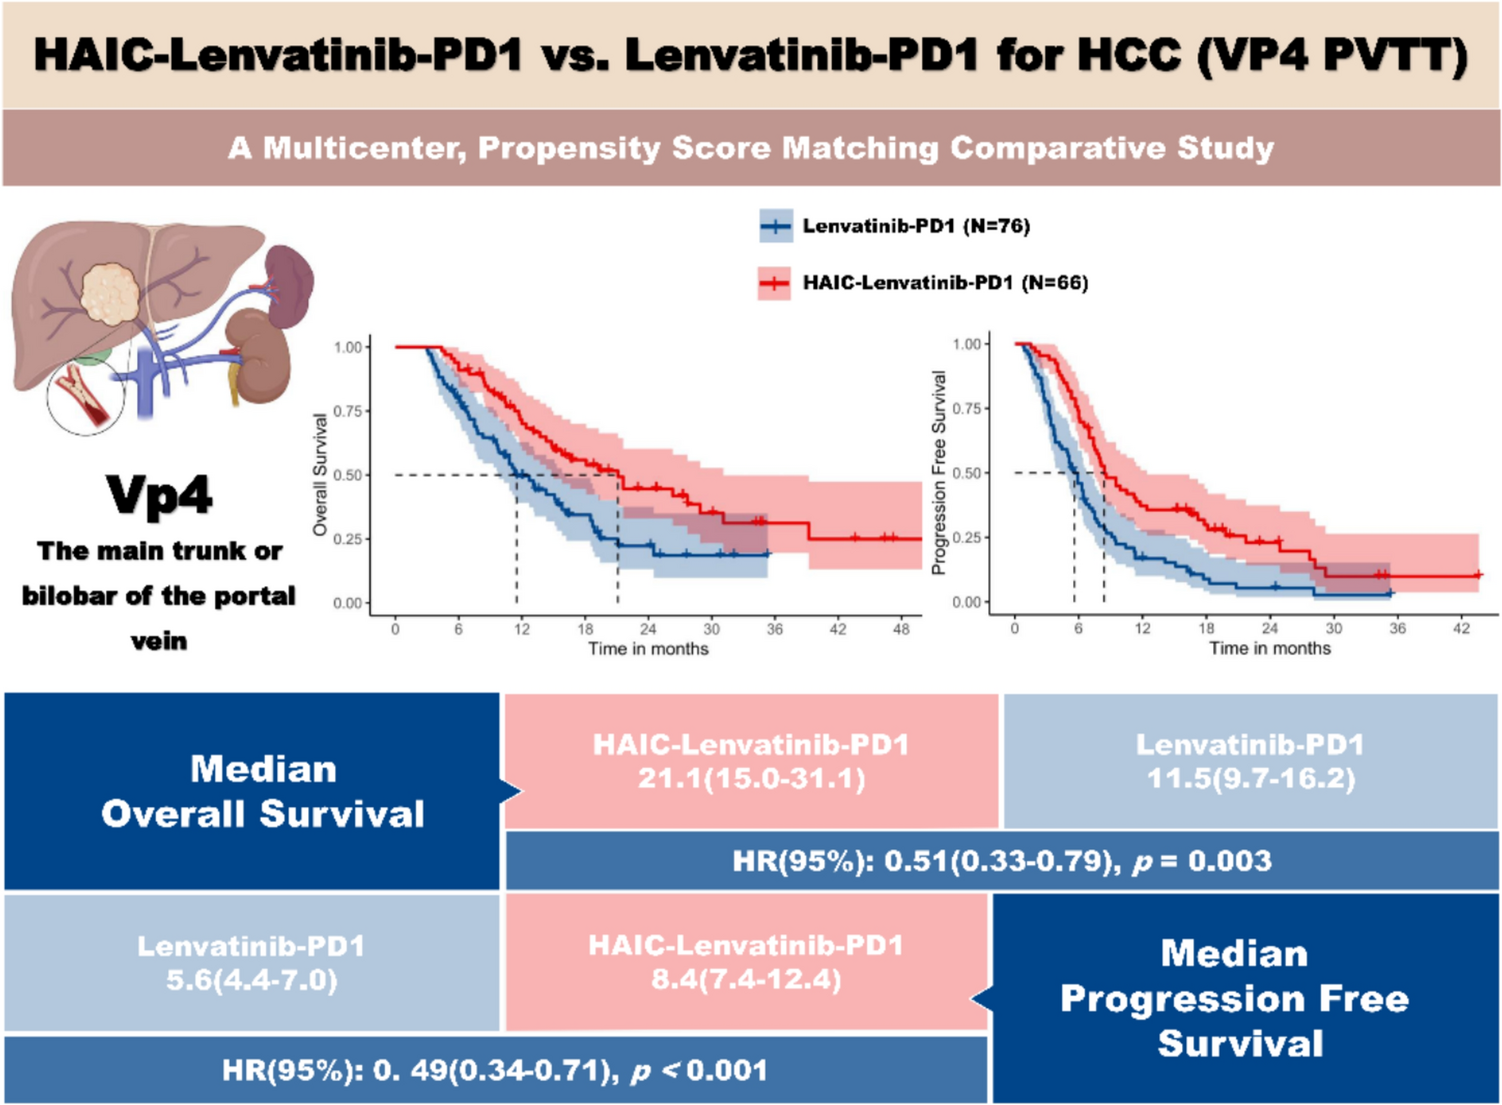
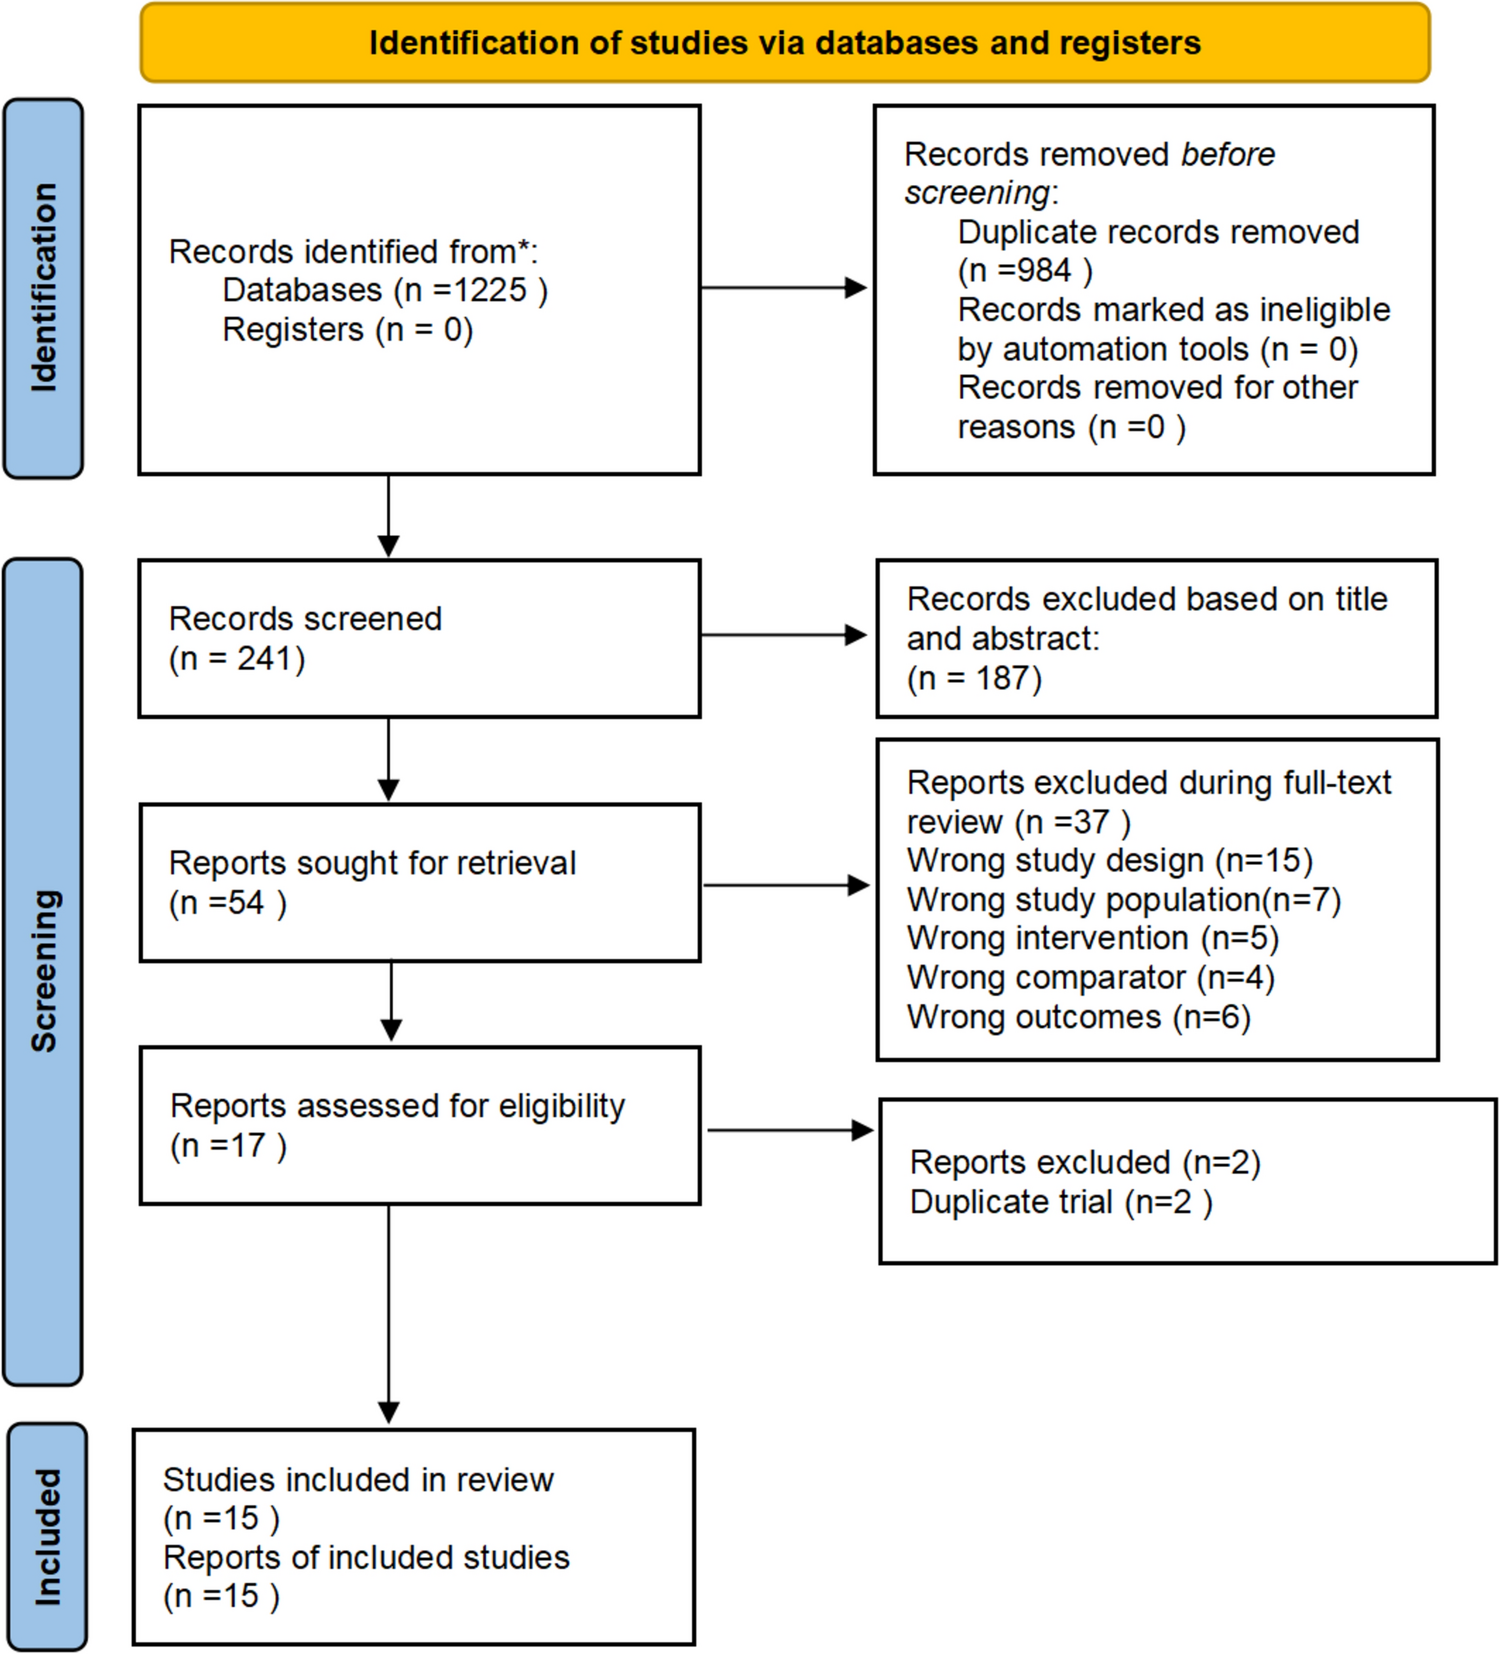
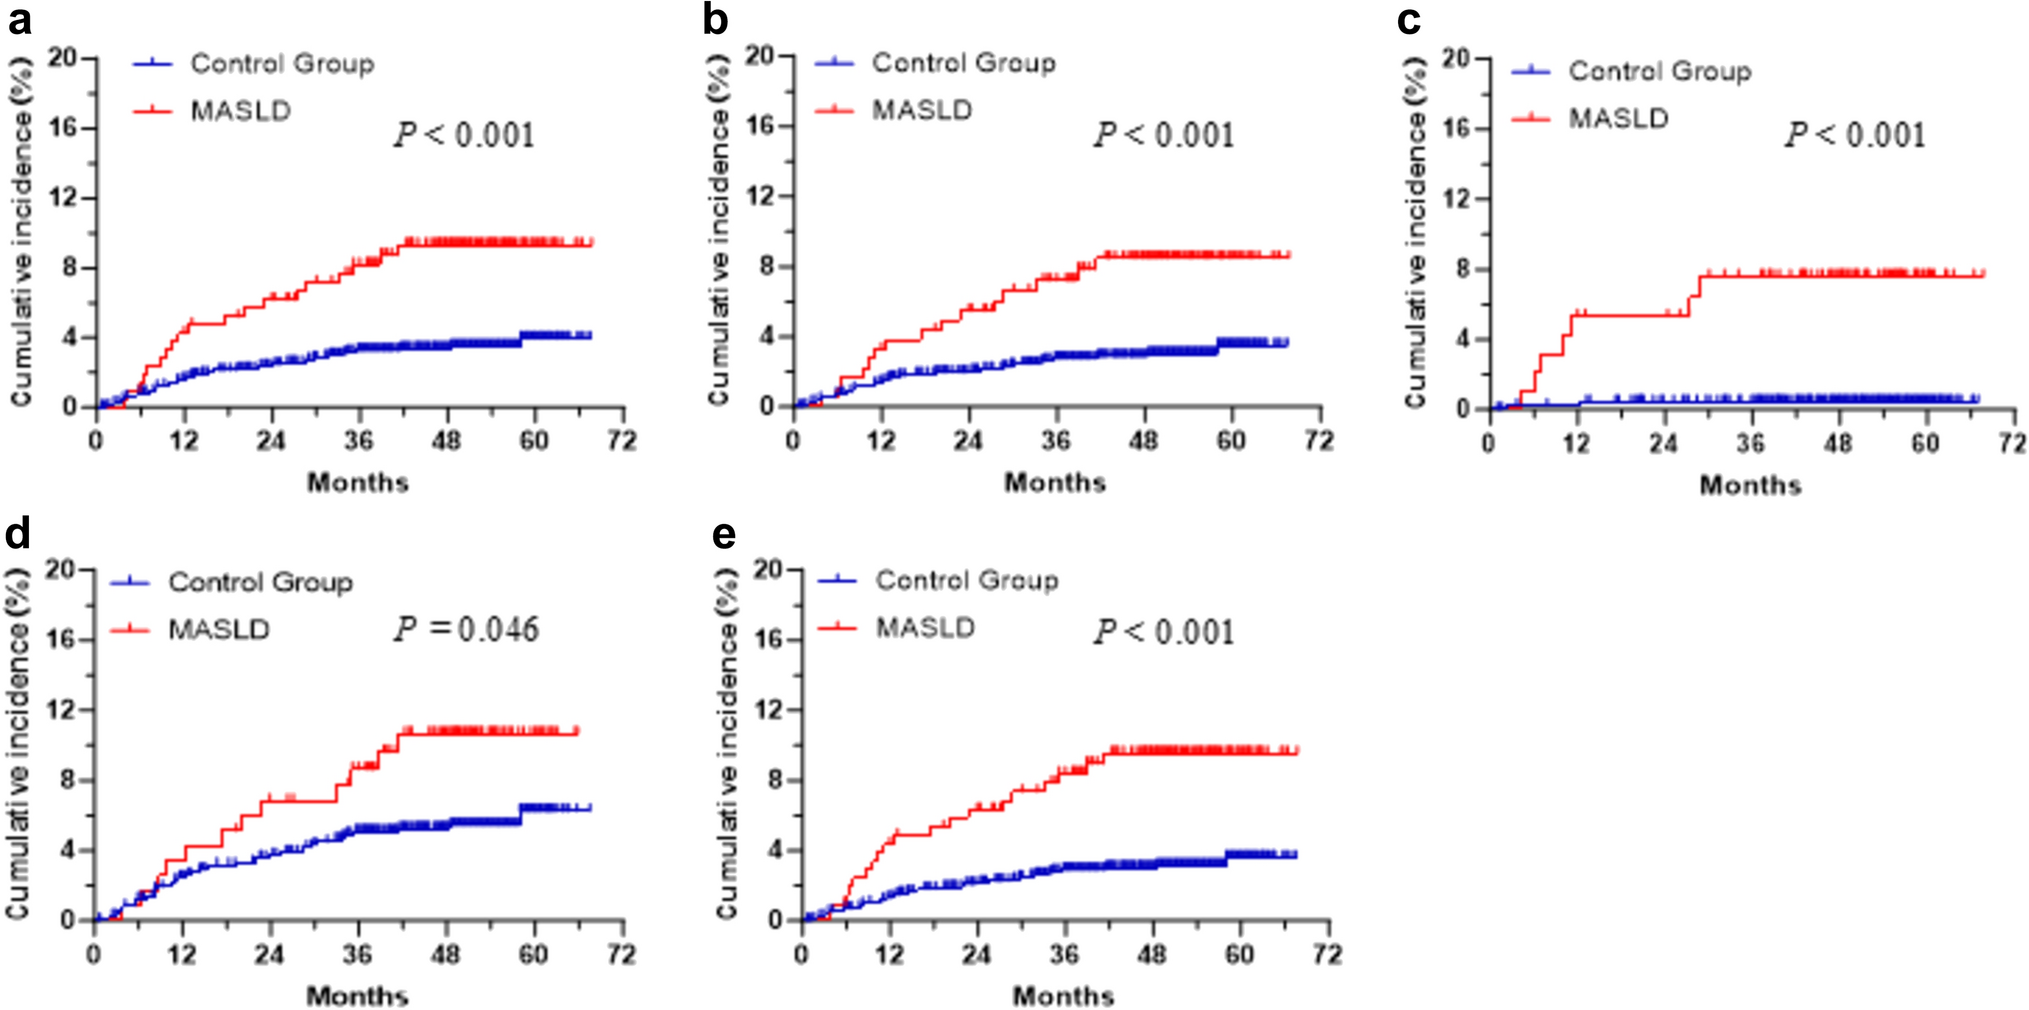
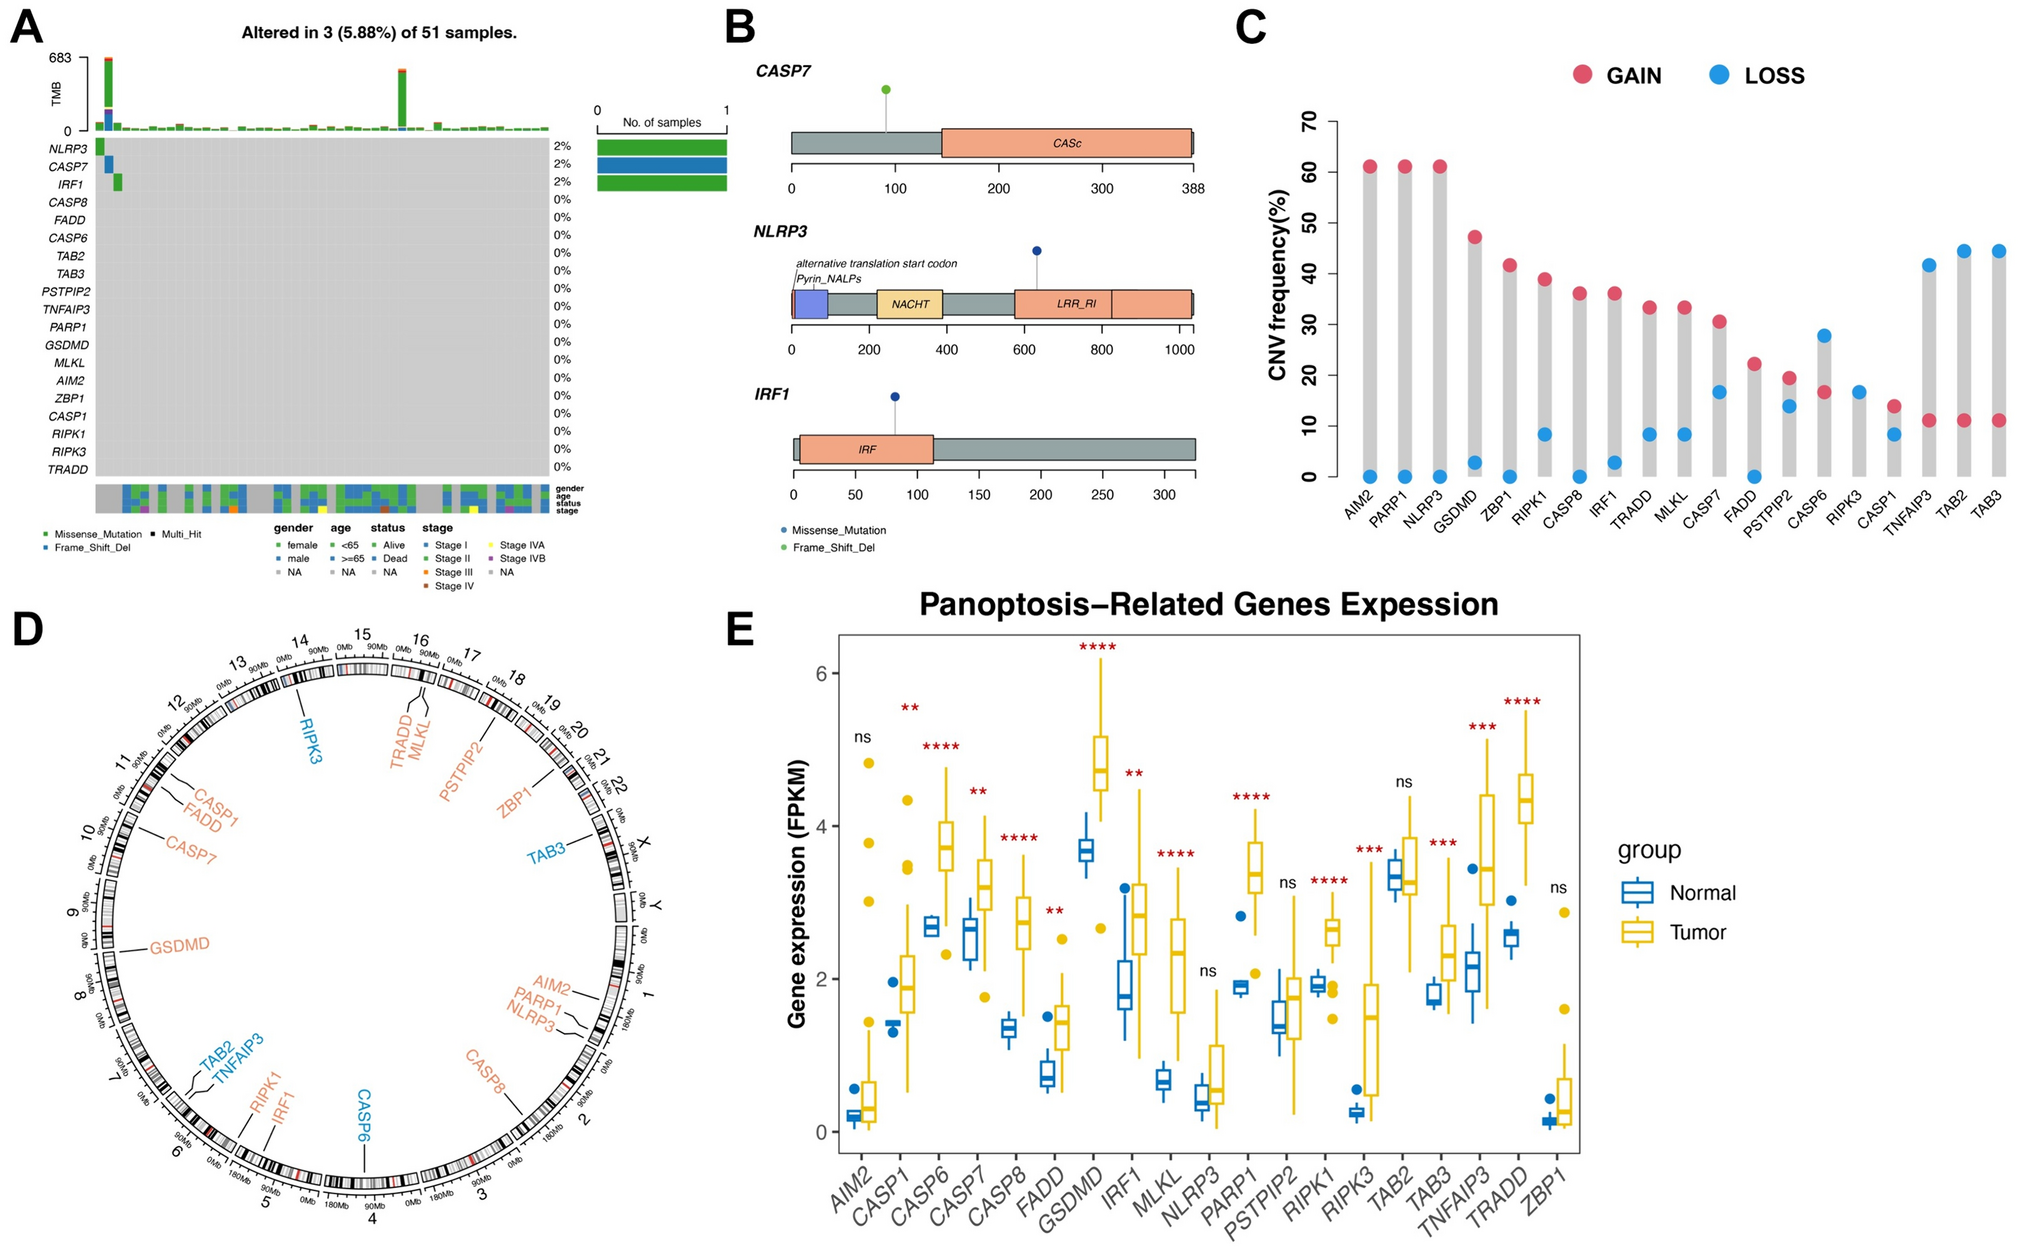
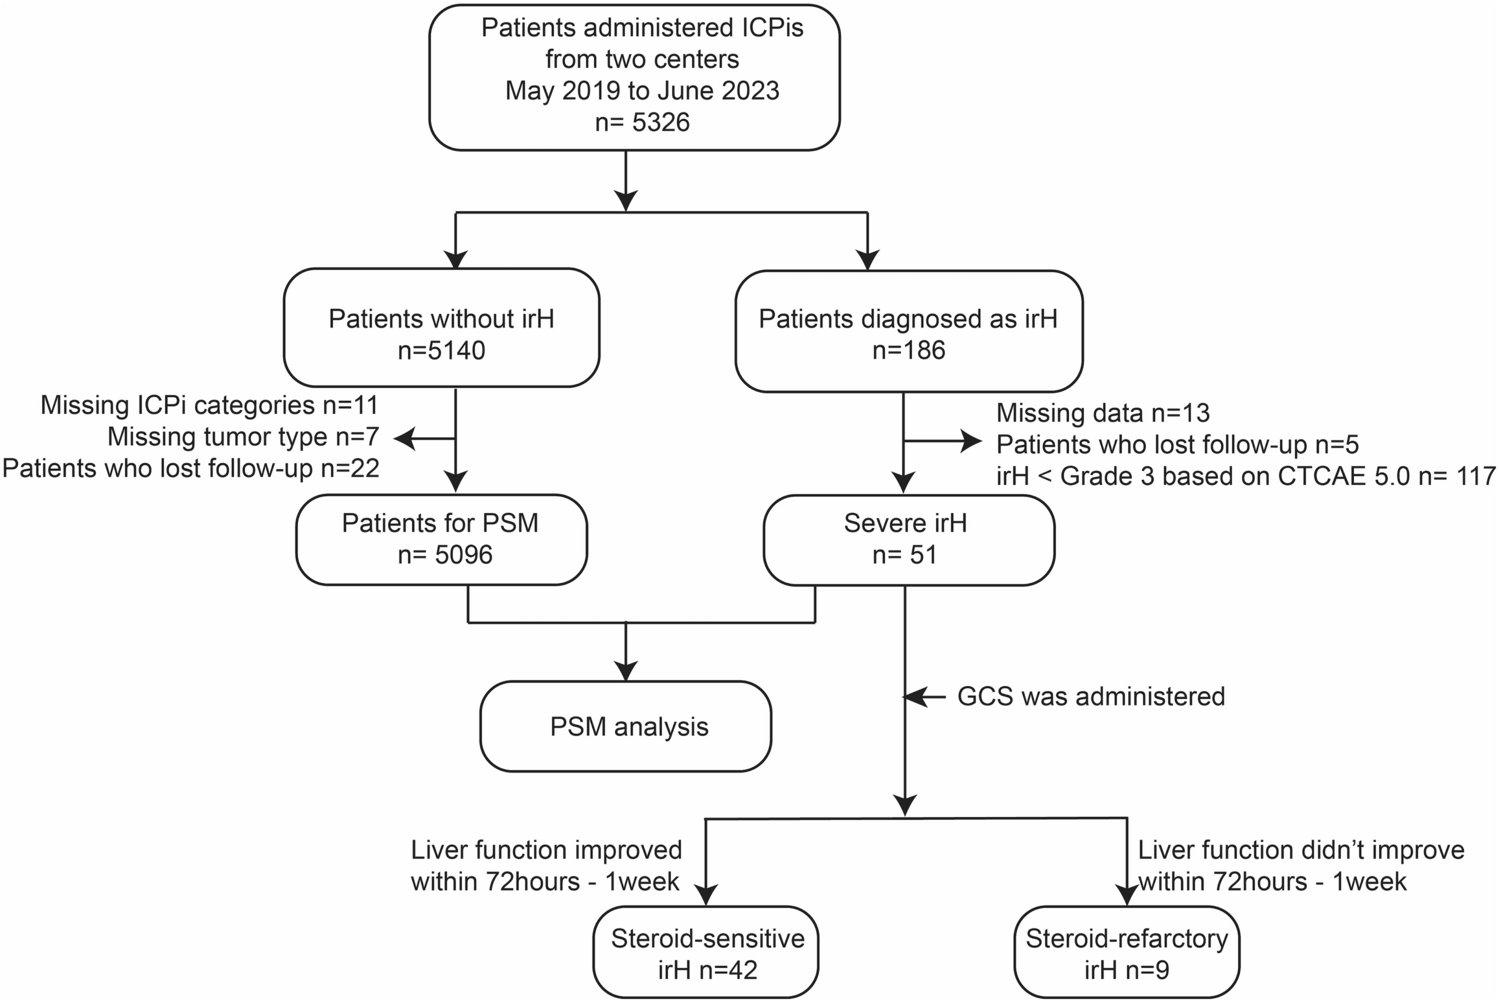
Figure 1 presents the study flowchart. During the study period, 839 patients with at least one elastography test were screened for eligibility. A total of 526 patients who had received at least 6 months of standardized treatment at LSM testing were included in the study. Of the UDCA monotherapy group, the median follow-up time was 34 ± 20 months. 43 (10%) cases developed primary outcome, of which 32 (74%) had ascites, 1 (2%) had hepatic encephalopathy, 5 (12%) had variceal bleeding, 2 (5) had hepatocellular carcinoma, 1 (2) had LT, and 2 (5%) had liver-related death. Patients received UDCA for a median of 41 ± 39 months before enrollment.
Fig. 1
Case screening process and study design
The patients’ baseline characteristics are presented in Table 1. Their mean age was 54 ± 9 years, with 90% (381/424) being female and 85% (360/424) being anti-mitochondrial antibody (AMA)-positive. Thirty% (126/424) had fatigue and 17% (74/424) had pruritus. 34% (145/424) were anti-gp210 positivity and 21% (87/424) were anti-centromere antibody positivity. The median GLOBE score and LSM were 0.15 (− 0.38 to 0.75) and 9.25 (6.85–12.3), respectively. There were significant differences in the proportion of female gender (p = 0.027), follow-up time (p < 0.001), age (p = 0.013), platelet (PLT, p < 0.001), aspartate aminotransferase (AST, p < 0.001), total bilirubin (TBIL, p < 0.001), albumin (ALB, p < 0.001), LSM (p < 0.001), and GLOBE scores (p < 0.001) between groups with and without the primary outcome.
Table 1 Baseline indicators between patients receiving UDCA monotherapy with or without POPrognostic analysis to explore the superimposition effects of LSM on GLOBEAll variables with statistical significance in the univariate analysis were adjusted for in a multivariate model. Multivariate Cox analysis demonstrated that GLOBE (hazard ratio [HR]: 3.762, 95% confidence interval [CI] 2.573–5.499, p < 0.001) and LSM (HR: 1.121, 95% CI 1.055–1.192, p < 0.001) were associated with LT-free survival. The fitted model was y = 1.325 × GLOBE score + 0.115 × LSM. The fitted model significantly improved the predictive efficacy of the primary outcome, with an area under the receiver operating characteristic curve (AUC) of 0.834 (0.767–0.900) for the GLOBE score and 0.868 (0.811–0.925) for the fitted model (p = 0.006, Fig. 2).
Fig. 2
Receiver operating characteristic curves depicting the predictive efficacy of the fitted model (y = 1.325 × GLOBE score + 0.115 × LSM) and the GLOBE score for the primary outcome. LSM, liver stiffness measurement
To further elucidate the additional prognostic effect of LSM on GLOBE, we risk-stratified the included population according to the GLOBE score. Previous study have found that the GLOBE scores of 0.5 and 1.8 can be used to classify populations into low, medium, and high-risk groups, and our cohort met this criterion (Supplementary Fig. 1) [15]. Comparison of AUC revealed additional prognostic effect of LSM on patients at low-risk as defined by GLOBE (0.777 [0.724–0.825] vs 0.642 [0.583–0.699], p = 0.001). LSM had no additional prognostic effect on medium and high-risk cases (0.811 [0.730–0.877] vs 0.745 [0.658–0.820], p = 0.157, and 0.576 [0.355–0.777] vs 0.527 [0.310–0.736], p = 0.839).
We performed prognostic analyses in the low-risk group defined by the GLOBE score, and univariate Cox regression found that LSM was associated with the primary outcome (HR: 1.292, 95% CI 1.132–1.475, p < 0.001), whereas GLOBE was not associated with the primary outcome (HR: 4.393, 95% CI 0.888–21.721, p = 0.070). The X-tile software was used to determine the optimal cut-off value of 11 kPa for LSM (Supplementary Fig. 2). When GLOBE < 0.5 and LSM > 11 kPa increased the incidence of the primary outcome by 15 times (7/53 [13%] vs 2/227 [1%], p < 0.001) compared to the GLOBE < 0.5 and LSM < 11-kPa group. Compared to biochemical response criteria (Paris 1, Paris 2, Toronto, or Rotterdam), LSM > 11 kPa predicted a higher positive predictive value, sensitivity, Youden index, and AUC for the primary outcome in low-risk patients with a GLOBE score < 0.5 (Supplementary Table 1). Based on the GLOBE score and LSM, we reclassified the included patients into four groups. The incidence of the primary outcome was 12/23 (52%) for high-risk and 22/121 (18%) for medium-risk. There was no difference between the medium and “low and LSM > 11 kPa” groups (Fig. 3).
Fig. 3
The Kaplan–Meier survival curves showing the prognosis of the included patients divided into four groups receiving ursodeoxycholic acid monotherapy
The LSM threshold of 11 kPa was suitable for patients receiving combined fenofibrate therapy.Of the fenofibrate combined group, the median follow-up time was 40 ± 20 months. Twelve (12%) cases developed the primary outcome: 7 (58%) had ascites, 3 (25%) had variceal bleeding, and 2 (17%) had a liver-related death. Patients received fenofibrate for a median of 23 ± 21 months before enrollment.
The patients’ baseline characteristics are presented in Table 2. Their mean age was 54 ± 8 years, with 80% (83/102) being female and 84% (86/102) being AMA-positive. Forty eight% (49/102) had fatigue and 27% (28/102) had pruritus. 41% (42/102) were anti-gp210 positivity and 22% (22/102) were anti-centromere antibody positivity. The median GLOBE score and LSM were − 0.08(− 0.69 to 0.75) and 10.48(7.4–13.15), respectively. There were significant differences in PLT (p < 0.001), alanine aminotransferase (ALT, p = 0.003), AST (p < 0.001), alkaline phosphatase (ALP, p < 0.001), gamma-glutamyl transpeptidase (GGT, p = 0.005), TBIL (p < 0.001), ALB (p < 0.001), LSM (p < 0.001), and GLOBE scores (p < 0.001) between groups with and without the primary outcome.
Table 2 Baseline data between patients receiving fenofibrate combined therapy with or without POUnivariate cox regression found that LSM was associated with the primary outcome (HR: 1.268, 95% CI 1.080–1.489, p = 0.004), whereas GLOBE was not associated with the primary outcome (HR: 333.074, 95% CI 0.305–364170.336, p = 0.104) in the low-risk group defined by GLOBE score. GLOBE < 0.5 and LSM > 11 kPa had higher incidence of the primary outcome (3/21 [14%] vs 0/47 [0%], p = 0.022) compared to the GLOBE < 0.5 and LSM > 11-kPa group. The incidence of the primary outcome was 3/3 (100%) for high-risk and 6/27 (22%) for medium-risk. There was no difference between the medium and “low and LSM > 11 kPa” groups (p = 0.353, Supplementary Fig. 3).
The impact of antifibrotic drugs on the disease progression of patients with low-risk and LSM > 11 kPaA total of 75 patients with low-risk and LSM > 11 kPa were included, of whom 46 (61%) received antifibrotic therapy. Ninety one% (42/46) received FuZhengHuaYu treatment, 7% (3/46) received Anluohuaxian treatment, and 2% (1/46) received Biejia-Ruangan treatment. There were no differences between the anti-fibrosis and non-anti-fibrosis groups in terms of the included parameters (Supplementary Table 2). During follow-up, 11% (5/46) and 17% (5/29) achieved the primary outcome in the anti- fibrotic and non-anti-fibrotic groups, respectively (p = 0.659). To better elucidate the effects of antifibrotic drugs, we observed changes in LSM at different timepoints of follow-up. As shown in Fig. 4, the anti-fibrotic group had higher changes of LSM compared to the non-anti-fibrosis groups at 36 months of follow-up (− 3.31 [− 5.04 to − 1.52] vs − 1.74 [− 2.83 to 1.50], p = 0.046). No differences were found at 6 (− 1.37 [− 2.26 to − 0.12] vs 0 [− 2.75 to 2.51], p = 0.175), 12 (− 2.32 [− 3.59 to − 0.16] vs − 0.40 [− 3.77 to 2.67], p = 0.240), and 24 (− 2.40 [− 2.97 to − 0.17] vs − 1.75 [− 2.47 to 1.97], p = 0.189) months.
Fig. 4
Changes in LSM at 6, 12, 24, and 36 months of follow-up between the anti-fibrosis and non-anti-fibrosis groups. Shown was median and interquartile range. The differences between these two groups at each time point were compared using Mann–Whitney U tests. LSM, liver stiffness measurement; m, months
Comments (0)