
Remember me


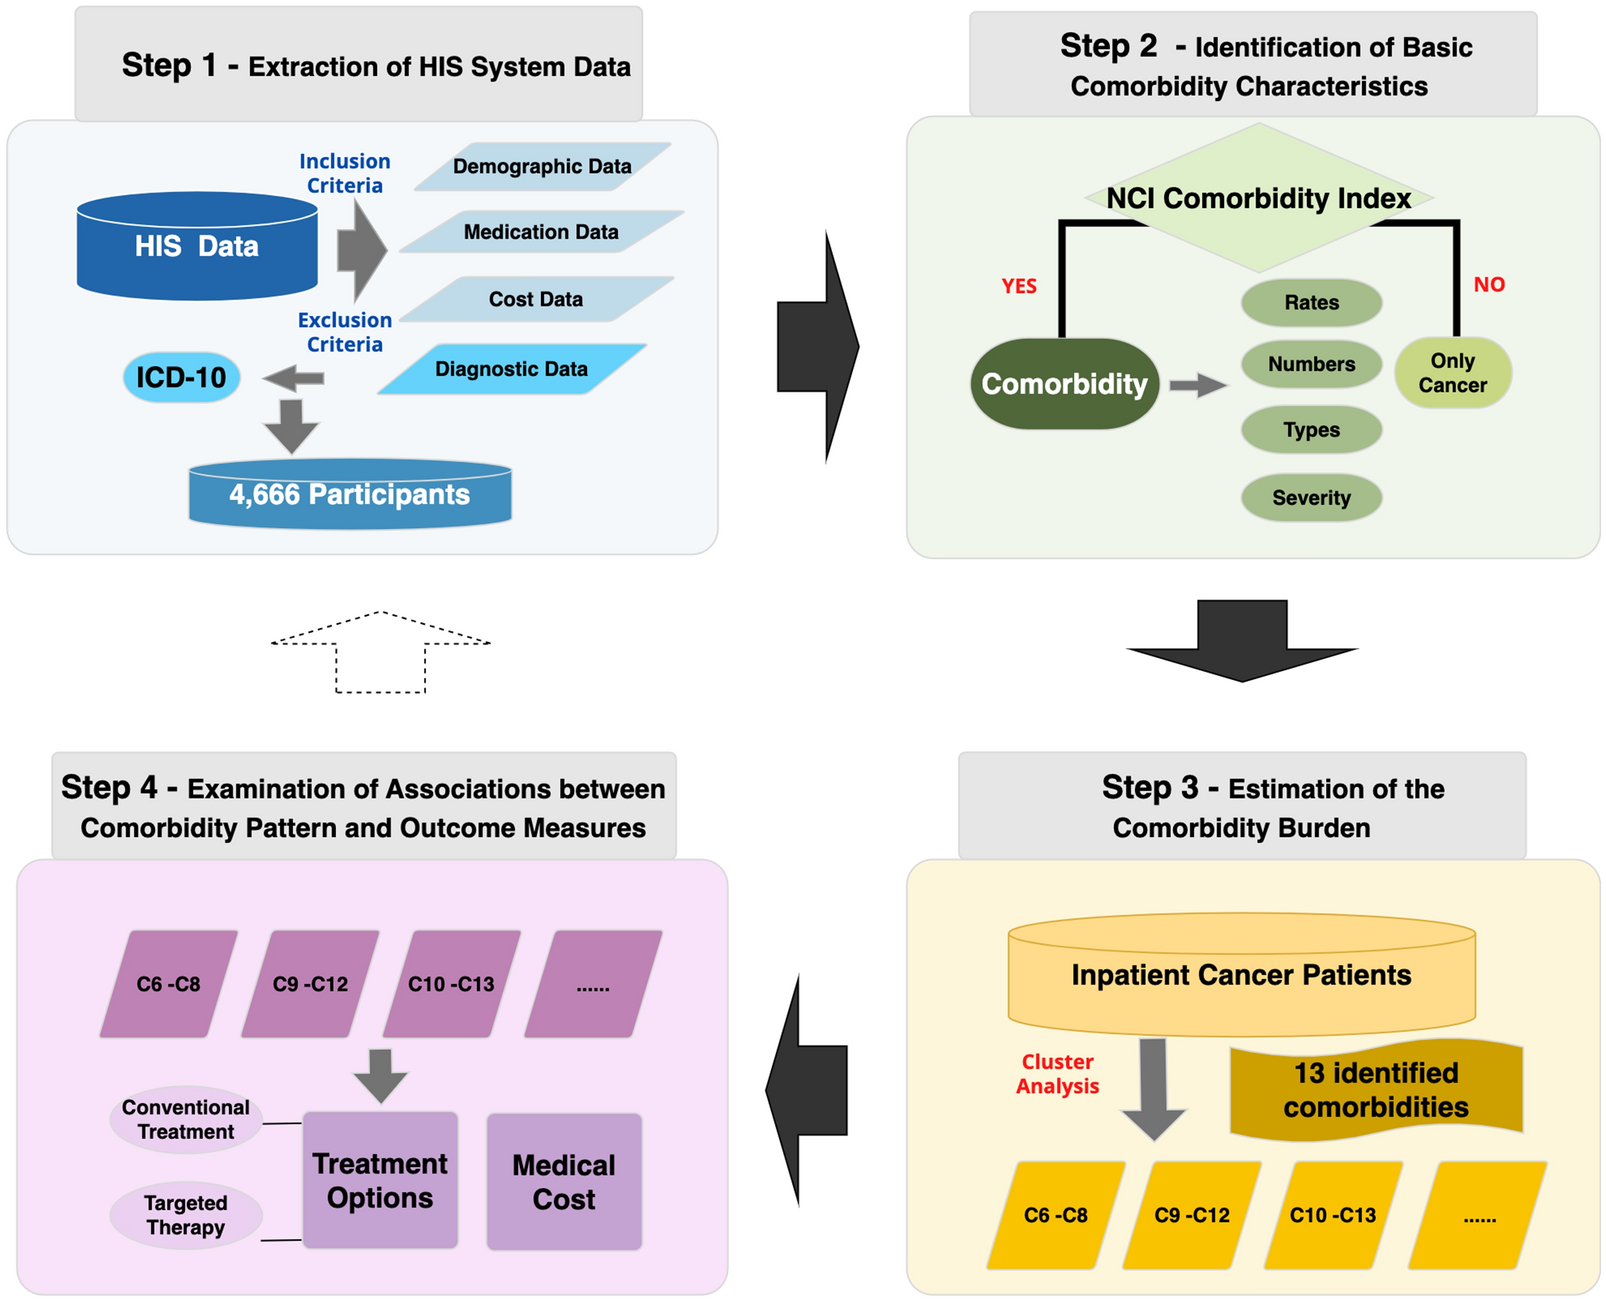


We conducted a systematic review to examine the cost-effectiveness evidence for FH screening strategies. As illustrated in Fig. 1, the study began with a thorough literature review followed by data extraction and quality assessment. Synthesized evidence from the included studies was used to evaluate both the cost and effectiveness of different FH screening approaches. In parallel, an aggregate distributional DCEA was performed to quantitatively assess the impact of FH screening on health inequality. This process involved calculating equally distributed equivalent health and net health benefits, leading to a comprehensive analysis of both the economic and distributional impacts.
Fig. 1 Systematic review
Search strategy. In this study, we employed a literature search to systematically review and analyze the economic evaluations of FH screening. We used key terms and corresponding MeSH terms such as "familial hypercholesterolemia," "cost-effectiveness analysis," "disease screening," and "health economics" to search multiple important databases, including PubMed, Web of Science, Embase, ScienceDirect, and the Health Technology Assessment Database. The search cutoff date was October 20, 2023, and the literature was limited to publications from 2000 onwards. Detailed search terms are provided in Table S1 of Supplementary Methods and Materials.
Inclusion and exclusion criteria. Predefined inclusion criteria were: (1) studies involving patients with FH, (2) studies focusing on FH screening, (3) studies conducting economic evaluations of screening methods, and (4) articles published in English. Exclusion criteria were: (1) studies involving patients with multiple diseases, (2) studies where the primary focus was not disease screening, (3) studies that did not report the process or results of economic evaluations, and (4) reviews, conference papers, and guidelines. Two authors (MW and JL) independently screened the literature for eligibility based on titles and abstracts in the first round and examined the full texts of potentially eligible articles in the second round to determine the final inclusion. Discrepancies were resolved through discussion with SJ and YG to achieve consensus.
Data extraction. We used a pre-determined form to extract information from the included studies. The extracted information included variables such as perspective, currency unit, screening strategies, screening targets, treatment drugs, economic evaluation methods, cost-effectiveness analysis results, and intricate details regarding the decision models employed (Tables 1 and 2).
Table 1 Characteristics and literature quality evaluation of FH screening studies included in the reviewTable 2 Summary of economic results included in the reviewQuality assessment. To ensure the inclusion of high-quality economic evaluations in our review, we employed two established assessment tools: the Quality of Health Economic Studies (QHES) for assessing the quality of analysis [12, 13], and the Consolidated Health Economic Evaluation Reporting Standards (CHEERS) for assessing the quality of reporting [14]. The QHES tool assigns scores ranging from 0 to 100. We categorized the included studies as high quality (75–100), moderate quality (50–74), low quality (25–49), and very low quality (0–49). The CHEERS checklist consists of 28 checking items. Each item was scored as follows: 1 point for being fully satisfied, 0.5 points for partially satisfied, and 0 for unsatisfied, with a maximum possible score of 28 points.
Evidence synthesisFollowing the systematic review, we synthesized the evidence from studies that evaluated the same screening strategies (cascade or universal screening), utilized the same or similar outcome measures (adverse events averted, Life Years Gained, or Quality-Adjusted Life Years), and applied the same perspective (healthcare system or societal perspective). These criteria were applied to ensure that the evidence for synthesis was consistent.
Cost synthesis. To address the heterogeneity in currency usage and publication years across different articles, all costs were standardized to 2023 U.S. dollars using a web-based tool for cost conversion that applies purchasing power parities [15, 16]. For costs that did not report confidence intervals, we assigned an interval of ± 50% of the reported value. The types of costs considered in the included articles are detailed in Table S2 in the Supplements.
Effectiveness synthesis. We synthesized health outcomes across four categories: deaths averted, adverse events averted, Life Years Gained (LYGs), and Quality-Adjusted Life Years (QALYs). For outcomes that did not report confidence intervals, we assigned an interval of ± 50% of the reported value to account for uncertainty in the outcome parameters. In one study, results were provided for two cohorts (20-year-olds and 35-year-olds); we combined these cohorts to derive an average outcome for the two age groups [17].
Cost-effectiveness analysis. With the synthesized costs and health outcomes, we calculated the cost-effectiveness of each screening strategy compared with no screening or status quo. We used the Incremental Cost Effectiveness Ratio (ICER) as the indicator of being cost-effective, which was determined by dividing the incremental costs by the incremental health outcomes between the examined screening strategy relative to its comparator. Based on the confidence intervals for costs and health outcomes, we calculated the confidence intervals for ICERs using the Delta method to account for uncertainty (Table 3) [18].
Table 3 Synthesis of cost-effectiveness analysis results and COMER outcomesTotal net health benefit. To synthesize data from different age groups across different studies, we employed the Comparative Efficiency Research (COMER) approach (Appendix 1 of Supplementary Methods and Materials) to generate weights for each group within each study [19]. These weights were applied to calculate the weighted incremental costs and incremental health outcomes for each age group across the studies (Table 3).
Aggregate distributional cost-effectiveness analysisWe conducted an aggregate DCEA based on the cost-effectiveness analysis results to evaluate the distribution of health outcomes and costs following FH screening across diverse population groups. This analysis was aimed at estimating the impact of FH screening on health inequality. The process was carried out following several key steps as described below.
Step 1: initial health distribution. The first step involved estimating the distribution of health outcomes prior to the implementation of FH screening across different population groups. The baseline distribution of health was from a previous study, which offered detailed data on the distribution of quality-adjusted life expectancy (QALE) at birth across different socioeconomic groups [20]. The socioeconomic status was measured by the Index of Multiple Deprivation (IMD), which categorises the population into five groups: IMD1 to IMD5. IMD1 represents the most deprived areas, while IMD5 represents the most affluent areas [14]. According to their results, the baseline QALE was 63.21 years for IMD1 and 75.00 years for IMD5 (Table S3 in Supplements).
Step 2: initial health opportunity cost distribution. In this step, we applied the health opportunity cost distribution across population groups. The health opportunity cost represents the health benefits that are foregone when resources are reallocated within the healthcare system, i.e. the health benefits derived from a treatment that the poorest population group would forego if decision-makers decide to fund a different treatment. The distribution of health opportunity costs represents how these forgone health benefits are spread across different population subgroups, such as the IMD groups. For example, if a 20% opportunity cost is attributed to the IMD1 group (most deprived people), it means that if decision-makers choose to fund a different treatment, 20% of the total health benefits forgone will be born by this group. This distributional information helps decision-makers identify which groups are most adversely affected by funding decisions and assess the equity implications of different healthcare interventions. In our analysis, we used data from a previous study that quantified the distribution of health opportunity costs among IMD groups [21]. The study found that 26% of the health opportunity costs were borne by IMD1, while 14% were borne by IMD5 (Table S3 in Supplements).
Step 3: net health benefit. In the third step, we calculated the net health benefit (NHB) derived from the intervention under consideration—in this case, FH screening. The NHB provides a measure of the health benefits gained from the intervention after accounting for the health benefits potentially lost due to the reallocation of healthcare resources (i.e., opportunity cost). Our NHB calculation procedure was: (1) we calculated the total health benefits within each IMD group. This was determined by multiplying the incremental QALYs gained from the intervention by the number of patients in that group. (2) we estimated the opportunity cost within each group, which represents the potential monetary benefits that could be forgone if resources are diverted to FH screening. The opportunity cost for each group was calculated by multiplying the incremental cost per patient by the total number of patients in the group and then multiplying this result by the proportion of opportunity cost specific to that group (as derived in Step 2). (3) the potential health benefits forgone due to the opportunity cost were then calculated by dividing the within-group opportunity cost by the opportunity cost threshold. This threshold reflects the value of health benefits that are sacrificed when resources are diverted from their existing uses to fund a new intervention. (4) the NHB for each group was determined by subtracting the potential health benefits forgone due to the opportunity cost from the total health benefits gained from FH screening. The resulting NHB represents the net health gains from the intervention after considering the cost of health benefits lost elsewhere due to resource reallocation. The calculation formula used is as follows:
$$\beginNH_& =(\Delta QALY\cdot _)-(\frac_})\end$$
(1)
where \(_\) is the net health benefit for the \(^\) group; \(\Delta QALY\) denotes the incremental health gains derived from FH screening; \(_\) is the number of patients screened in the \(^\) group; \(N\) is the total number of patients screened;\(_\) is the opportunity cost proportion for the \(^\) group; \(\Delta cost\) refers to the incremental cost of FH screening per patient relative to comparator; \(K\) is the opportunity cost threshold per patient, reflecting the value of health benefits forgone when resources are allocated to this intervention. The opportunity cost threshold is typically set equal to the societal willingness-to-pay (WTP) threshold, which is the benchmark used to determine whether the health gains from a new intervention justify the health losses incurred elsewhere. For instance, NICE sets the threshold at £20,000-£30,000 per QALY. In our study, we used the societal WTP threshold specified in each study eligible for aggregate DCEA calculation.
Step 4: post-intervention QALE. In this step, we integrated the NHB derived from FH screening (as calculated in Step 3) into the initial health distribution for each group to produce the post-intervention health distribution. The initial health distribution, expressed as QALE, was updated by adding the NHB, resulting in the post-intervention QALE. This updated QALE reflected the net impact of FH screening. Meanwhile, the NHB represented the incremental QALE between the pre- and post-intervention scenarios.
Step 5: pre- and post-intervention equally distributed equivalent health. In this step, we calculated the Equally Distributed Equivalent Health (EDEH) both before and after intervention. EDEH represents the mean level of health per person that, if equally distributed across the population, would give the same level of societal welfare as the current unequal distribution. To estimate EDEH, we used the Atkinson inequality index, which measured the level of inequality in a health distribution. The Atkinson index is calculated using the following formula:
$$A\left(\epsilon \right)=1-\sum_^_}\right)}^\right)}^}$$
(2)
where \(A(\varepsilon )\) is the Atkinson Inequality Index; \(N\) represents the number of population groups; \(_\) is the QALE within the \(^\) group; \(h\) is the average QALE of the entire population;\(\varepsilon\) is the inequality aversion parameter, which was set at 10.95 based on a previous empirical measurement in the UK [23]. Using the QALE values by group and the average QALE for the pre-intervention scenario, we calculated the pre-intervention Atkinson index of inequality. Similarly, by using the QALE values by group and the average QALE post-intervention (adjusted by the NHB derived in Step 3), we calculated the post-intervention Atkinson index of inequality. We used the two Atkinson indexes to generate EDEH both before and after intervention. The \(EDEH\) was calculated using the following formula:
$$EDEH=N\cdot \left(1-A\left(\varepsilon \right)\right)\cdot h$$
(3)
where \(h\) is the average QALE of the population, and \(N\) is the total number of patients screened. The difference between pre- and the post-intervention EDEH provided the incremental EDEH.
Step 6: population equity impact. In the final step, we assessed the population equity impact of FH screening by comparing the incremental QALE (equivalent to the NHB) with the incremental EDEH. The population equity impact was calculated by subtracting the incremental QALE from the incremental EDEH. This calculation allowed us to derive the net equity impact by FH screening. A positive value indicated a reduction in health inequality, as the distribution of health outcomes became more equal. Conversely, a negative value indicated an increase in health inequality, meaning the distribution of health outcomes became more unequal [14].
Comments (0)