Dear Editor,
Leprosy is a dermato-neurological disease caused by M. leprae, the subtypes of which depend on host immune response and is often punctuated by reactional episodes classified as Type 1 (T1R) and Type 2 (T2R) leprosy reactions with T1R further sub-classified as upgrading, downgrading or static.1,2 T regulatory cells (Tregs) play an important role in mitigating leprosy reactions, though their definitive role is poorly understood due to variations in study designs, specimens assessed and methodology. FoxP3 and CD25 are the most commonly used markers for Tregs identification.3,4 The CD4 Tregs can be either naturally occurring or induced. The importance of Foxp3 in the development of CD4+CD25+ Tregs is that it leads to increased expression of CD25 and induces suppressor function. Furthermore, peripheral antigen stimulation converts mature CD4+CD25- Foxp3- T cells into Tr1 and Th3 subsets; the former mainly secretes IL-10, while the latter produces TGFβ.5 The objectives of our study were to quantify the Tregs in skin biopsies using IHC markers (CD4, CD25 and Foxp3) during and after the resolution of leprosy reactions, as compared to controls & compare the Tregs between T1R and T2R.
The study was conducted over a period of 16 months in the Department of Dermatology, Venereology and Leprosy in a tertiary care hospital in New Delhi, India, after ethical approval (comparative observational study) based on Attia EAS et al.4 Adult, MDT naïve, untreated reactional patients were enrolled in the study as cases. Spectrum-matched; multidrug therapy (MDT) naïve, non-reactional adult patients were recruited as controls. The diagnosis was based on WHO criteria6 and the clinical classification was determined by the Ridley Jopling Classification.1 The diagnosis of T1R & T2R was based on established clinical and histopathological criteria.2 A 4-mm punch biopsy was taken from the latest reactional skin lesion (before initiating treatment for reactions) and from a non-reactional lesion to confirm spectrum. Treatment for leprosy reactions was started based on the severity and a repeat biopsy was taken post-treatment when the skin changes and neuritis had completely resolved and the nerve function (if lost during reaction) had begun to improve, or at 20 weeks, whichever was earlier. The biopsy specimens were processed and assessed for Tregs based on IHC for CD4, CD25 and FoxP3. Tregs were calculated as the percentage of the total number of inflammatory cells. For staining techniques for CD4, CD25 and FoxP3, please see Supplementary file 1.
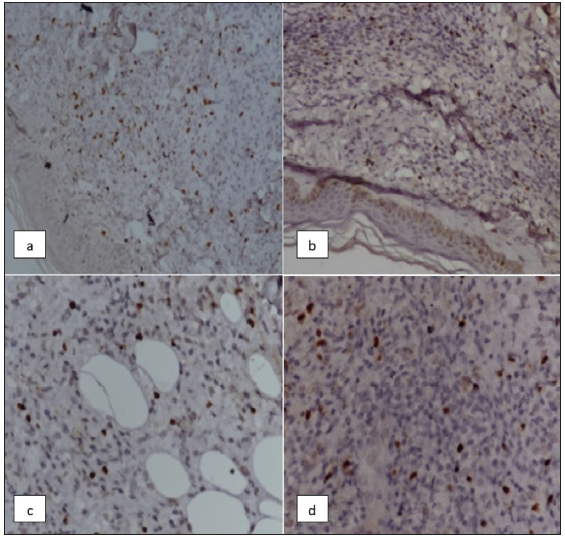
A total of 54 patients were enrolled, 23 in reaction (T1R:12; T2R:11) and 31 were non-reactional leprosy patients (controls) [Table 1]. Tregs (FoxP3) were increased during the reactional episodes of T1R as compared to controls [Table 1] and this explains the action of Tregs in obviating the inordinate inflammatory reaction. Tregs were decreased in T2R as compared to T1R [Figure 1] which accounts for the florid systemic manifestations of erythema nodosum leprosum as compared to T1R. The higher value of Tregs post-reaction in T2R can be explained by the effect of treatment (glucocorticoid/thalidomide) which helps in the resolution of the reaction.7 As Tregs share surface markers with activated effector T cells such as glucocorticoid-induced TNFR-related protein (GITR), this can explain why steroids are effective in upregulating Tregs.
Table 1: Demographic data, spectrum and Treg values (FoxP3) of cases and control group.
ParametersCases (T1R)
(n = 12)
(untreated, MDT naïve)
Controls (T1R)
(n = 15)
MDT naive
Cases (T2R)
(n = 11)
(untreated, MDT naïve)
Controls (T2R)
(n = 16)
MDT naive
Age [years] Mean ± SD (range)47.5±16.34
(25-75)
31.93 ± 13.45 (21-41)35.09±12.43
(19-60)
39.69 ± 15.24 (32-43) Gender Female 4 (33.33%) 3 (20%) 5(45.45%) 3 (18.75%) Male 8 (66.66%) 12 (80%) 6(54.54%) 13 (81.25%) Spectrum 12 (100%) BT1(6.67%) BB
14(93.33%) BT
10(90.9%) LL
1(9.09%) BL
12 (75%) LL
4 (25%) BL
Timing of presentation MDT naïve 12 (100%) 15(100%) 11 (100%) 16(100%) SSS (slit skin smear) Mean BI 2 0.06 4 5 CD4+CD25+ Foxp3+ Tregs between reactional patients and control group T1R(n = 12) Control (n = 15) T2R (n = 11) Control (n = 16) FoxP3(Mean ± SD) 8.20 ± 5.88 5.13 ± 5.63 4.72 ± 3.74 4.38±4.79 P value* 0.166 0.484 CD4+CD25+ Foxp3+ Tregs during and after reactionT1R
(during reaction)
T1R
(after reaction)
T2R
(during reaction)
T2R
(after reaction)
FoxP3(Mean ± SD) 8.20 ± 5.88 7.75 ± 4.87 4.72±3.74 7.9 ± 9.28 P value† 0.75 0.84 CD4+CD25+ Foxp3+ Tregs between T1R and T2R (during reaction) T1R T2R P value* FoxP3 8.20 ± 5.88 4.72 ± 3.74 0.15
Export to PPT
Previous studies on assessing the Tregs in leprosy and leprosy reactions have yielded contradictory results mainly due to methodological differences (immunohistochemistry vs. flow cytometry), the choice of control group, markers for Tregs and the methylation status of Tregs. The variability of data on Tregs is possibly related to the IHC expression and flow cytometry data which distinguishes between immature from activated Tregs and the methylation status of Tregs. Thus, CD45RA and CD45RO are used to distinguish immature Tregs (CD45RA+Foxp3low) from activated memory Tregs (CD45RA-Foxp3high), while the CD3+CD4+CD25highCD127low phenotype is commonly isolated from Treg population using flow cytometry. In addition, the determination of inhibitory activity and demethylation of Foxp3 CNS2 are considered to be the gold standards for Treg identification.8 Thus, there is a need to harmonise study protocols for the assessment of tissue Tregs in leprosy. Intra-individual comparison in paired samples, collected in the course of a reactional episode and when the patient is reaction free, and spectrum matched control group provides the best comparative control possible. Our work is an attempt to explain the variable inflammatory response of T1R & T2R and the dampening of inflammation in T1R versus T2R. Further data is needed to shed light on the role of Tregs and its cytokines and the ideal therapeutic agent which can help modulate leprosy reactions.
Comments (0)