DemographicsTroponin I
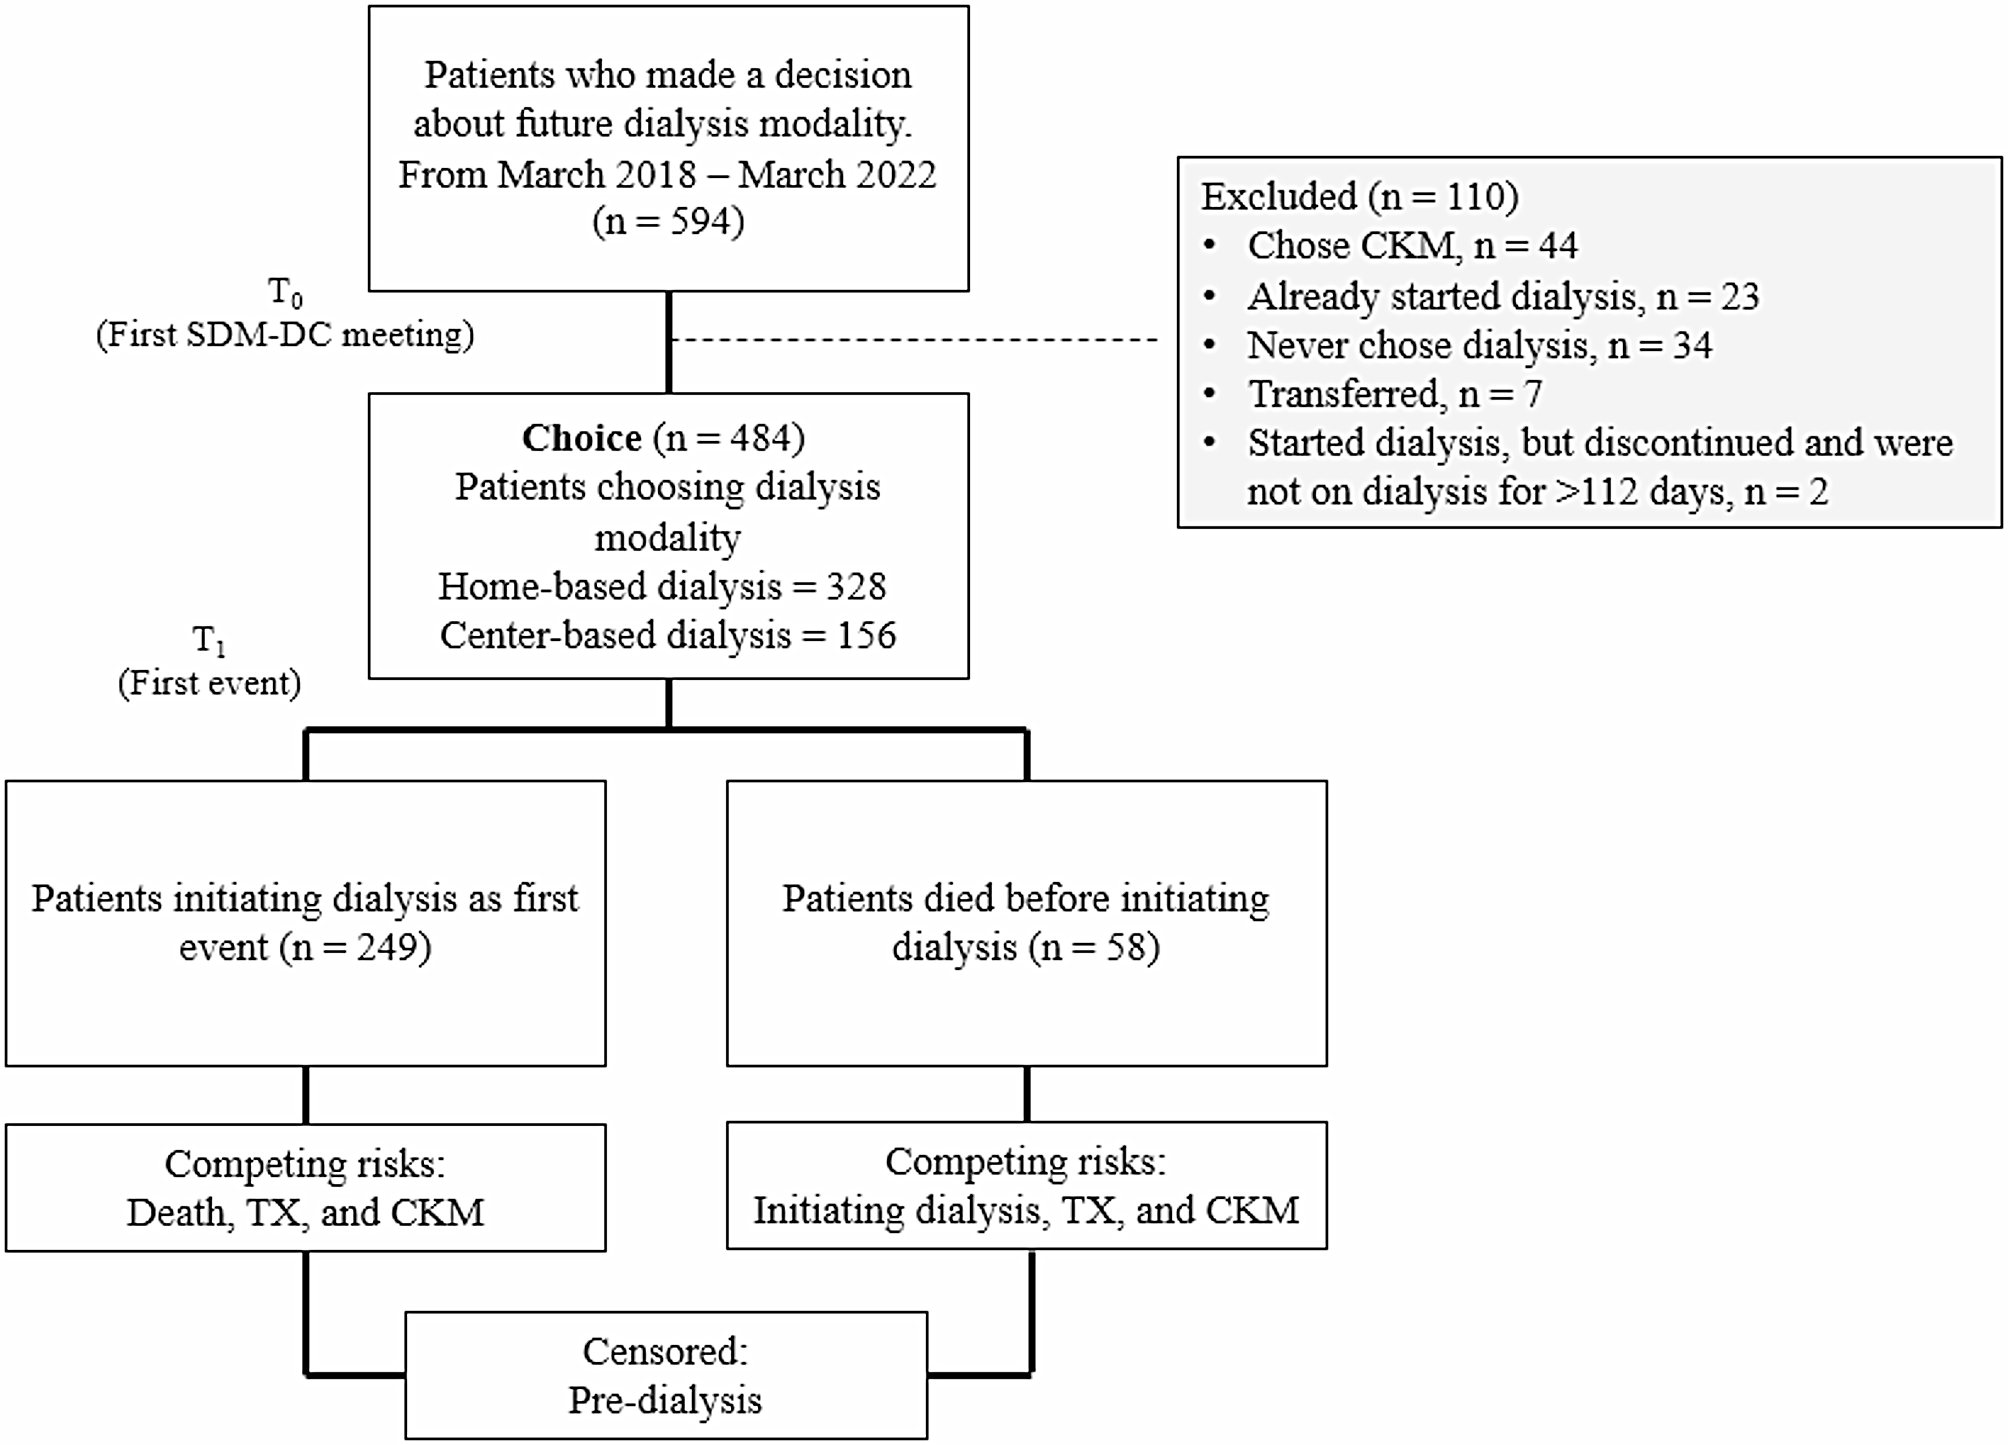
A total of 48,541 patients with all-cause GN were identified. Prior to propensity score matching (PSM), patients with Troponin I ≥ 18 ng/L were older, a higher proportion of males and a greater prevalence of ischaemic heart disease (IHD), heart failure (HF) and diabetes mellitus. A summary of the PSM characteristics may be found in Appendix Table 2. Following PSM, 34,974 patients were included in the analysis (mean patient age 59.4 SD 17; 48% male). 82% of the cohort patients had hypertension, 31% IHD and 24% HF. Beta-blockers and diuretics were the most common CV medication prescribed at 59%. Across the sub-group analysis, the mean age and CV risk factor profile reflected a similar pattern to all-cause GN. Following PSM, troponin I median and standard deviation (SD) was 75.5 ng/L ± 47.3 vs. 13.6 ng/L ± 1.8, both cohorts (Troponin I < 18 ng/L vs. Troponin I≥18ng/L) were well matched for age, gender and CV risk factors, with no statistically significant differences between groups. A breakdown of patient selection is shown in the study flow diagram. (Fig. 1)
Table 2 Demographics and CV risk factor profile post propensity score matching of sub-group adjusted for baseline CKDNT-proBNP
In total, 34,841 patients with all-cause GN were identified. Prior to PSM, patients with NTproBNP ≥ 400 pg/ml were older, a higher proportion male and a greater prevalence of hypertension, IHD and HF. A summary of the PSM characteristics may be found in Appendix Table 3. Following PSM, 18,218 patients were included in the analysis (mean age 60 (SD 17.8); 50% male). Of the all-cause GN cohort, 31.6% had pre-existing HF, 22% IHD and 55% were diabetic. The sub-group analysis of primary GN in this cohort again had similar CV risk factor profiles to all-cause GN. Following PSM NTproBNP median SD was 1204pg/ml ± 803 vs. 183 pg/ml ± 108, both cohorts (NTproBNP < 400 pg/ml vs. NTproBNP ≥400 pg/ml) were well matched for age, gender and CV risk factors, with no statistically significant differences between groups. A breakdown of patient selection is shown in the study flow diagram. (Fig. 1)
Table 1 displays the included patient demographics following PSM and CV risk profile for all GN cohorts.
Clinical outcomesTroponin I
Within all-cause GN cohort, 13,625 of the 34,974 patients had 5-year follow-up data available from the time of the index event. Of those, 6,222 developed the primary composite outcome. Of these 3,222 (9% of all-cause GN cohort) had a Troponin I above the 18 ng/L threshold. This equated to a HR of 1.79 (95% CI, 1.70, 1.88, p-value < 0.0001). When considering the secondary outcome, of the individual components of the primary composite outcome, an increased Troponin I was associated with a statistically significant increased risk of all-cause mortality HR 1.53 (95% CI, 1.47, 1.59); stroke HR1.27 (95% CI, 1.17, 1.38); HF HR 1.81 (95% CI, 1.71, 1.91); acute myocardial infarction (AMI) HR 1.79 (95% CI, 1.68, 1.93); angina pectoris HR 1.33 (95% CI, 1.22, 1.46) and IHD HR 1.62 (95% CI, 1.53, 1.71) (Fig. 2). Only atrial fibrillation and flutter as secondary outcomes did not reach the level of statistical significance.
An increased cardiac Troponin I above the 18ng/L threshold was associated with a statistically significant increased risk of the composite primary outcome in all GN sub-groups: IgA nephropathy (IgAN) HR1.75 (95% CI, 1.61, 1.90); membranous nephropathy (MN) HR 1.79 (95% CI, 1.64, 1.94); focal segmental glomerulosclerosis (FSGS) HR 1.71 (95% CI, 1.58, 1.87) and minimal change disease (MCD) HR 1.71 (95% CI, 1.58, 1.86). In the GN sub-groups, the most significant risk associated with an increased cardiac Troponin I was the development of heart failure over the 5 years of follow-up: IgAN HR 1.87 (95% CI, 1.66, 2.10); MN HR 1.90 (95% CI, 1.73, 2.09); FSGS HR 1.84 (95% CI, 1.67, 2.01). Conversely, the risk of AMI correlated most significantly with troponin in MCD HR 1.87 (95% CI, 1.67, 2.01) (Appendix Table 4).
NT-proBNP
Within all-cause GN cohort, 7,116 of the 18,218 patients had 5-year follow-up data available from the time of the index event. Of those, 3,023 developed the primary composite outcome. Of these 1,686 (9% of all-cause GN cohort) had a NTproBNP above the 400 pg/ml threshold. This equated to a HR of 1.99 ((95% CI, 1.86, 2.14, p-value < 0.0001). When considering the secondary outcome, of the individual components of the primary composite outcome, an increased NTproBNP was associated with a statistically significant increased risk of all-cause mortality HR 2.49 (95% CI, 2.33, 2.66); stroke HR 1.49 (95% CI, 1.23, 1.70)); atrial fibrillation and flutter HR 1.96 (95% CI, 1.76, 2.17)); heart failure HR 2.26 (95% CI, 2.08, 2.44); AMI HR 1.91 (95% CI, 1.71, 2.13); and IHD HR 1.83 (95% CI, 1.69, 1.99) (Fig. 3). Only angina pectoris as a secondary outcome did not reach the level of statistical significance.
An increased NTproBNP above the 400 pg/ml threshold was associated with a statistically significant increased risk of the composite primary outcome in all GN sub-groups: IgAN HR 1.84 (95% CI, 1.62, 2.09); MN HR 1.91 (95% CI, 1.68, 2.18); FSGS HR 1.88 (95% CI, 1.65, 2.14) and MCD HR 1.77 (95% CI, 1.56, 2.00). In the GN sub-groups, the most significant risk associated with an increased NTproBNP was HF, over the 5 years of follow-up in: IgAN HR 2.46 (95% CI, 2.11, 2.86) and MN HR 2.43 (95% CI, 2.08, 2.84). A NTproBNP ≥400 pg/ml was most significantly associated with all-cause mortality in FSGS HR 2.406 (95% CI, 2.13, 2.70) and MCD HR 2.41 (95% CI, 2.14, 2.71) (Appendix Table 5).
Kaplan - Meier survival analysis (KM) was produced excluding patients with outcome prior to the time window. This analysis highlights that MACE and its components increase the risk of mortality for GN including the sub-group analysis of primary GN (Fig. 4).
Exploratory analysis- adjusted for baseline CKDTroponin I
In an exploratory analysis, 12,872 of the 33,822 patients had 5-year follow-up data available from the time of the index event. Of those, 5,896 developed the primary composite outcome. Of these, 3,016 (9% of all-cause GN cohort) had a Troponin I above the 18 ng/L threshold. This equated to a HR of 1.76 (95% CI, 1.67,1.86, p-value < 0.0001). When considering the secondary outcome, an increased Troponin I was statistically significant for all components of MACE all-cause mortality HR 1.48 (95% CI, 1.42, 1.54); stroke HR 1.25 (95% CI, 1.15, 1.37); heart failure HR 1.77 (95% CI, 1.67, 1.87); atrial fibrillation and flutter HR 1.44 (1.34, 1.54); AMI HR 1.76 (95% CI, 1.65, 1.89); angina pectoris HR 1.35 (95% CI, 1.23, 1.48) and IHD HR 1.56 (95% CI, 1.48, 1.65) (Fig. 5 and Appendix Table 7).
NTproBNP
In our exploratory analysis, 6,333 of the 16,730 patients had 5-year follow-up data available from the time of the index event. Of those, 2,735 developed the primary composite MACE outcome. Of these, 1,500 (9% of all cause GN cohort) had a NTproBNP above the 400 pg/ml threshold. This equated to a HR of 1.99 (95% CI, 1.85, 2.15, p-value < 0.0001). When considering the secondary outcome, an increased NTproBNP was associated with a statistically significant increased risk of all-cause mortality HR 2.41 (95% CI, 2.25, 2.57) ); stroke HR 1.45(95% CI, 1.26, 1.67) ); heart failure HR 2.32 (95% CI, 2.14, 2.52) ; AMI HR 1.90 (95% CI, 1.69, 2.13) ); and IHD HR 1.78 (95% CI, 1.63, 1.94) (Fig. 6). Only angina pectoris as a secondary outcome did not reach the level of statistical significance (Appendix Table 8).
Table 2 displays the included patient demographics following PSM CV risk profile and eGFR for all GN cohorts.
A summary of the PSM characteristics may be found in Appendix Table 6.
Exploratory analysis – combined NTproBNP and troponin I
In our exploratory analysis of all cause GN with Troponin I and NTproBNP combined, 736 of the 2,318 patients had 5-year follow-up data available from the time of the index event. Of those, 327 developed the primary composite MACE outcome. Of these, 176 (7.6% of all cause GN cohort) had Troponin I and NTproBNP above threshold. This equated to a HR of 2.79 (95% CI, 2.24, 3.48, p-value 0.002). When considering the secondary outcome, statistically significant increased risk was not demonstrated for three of the components of MACE; IHD HR 2.47 (95% CI, 1.96, 3.11,p-value 0.003), AMI HR 3.08 (95% CI, 2.30, 4.12, p-value 0.018), HF HR 2.81 (95% CI, 2.25, 3.51, p-value 0.002). Secondary outcomes that did not meet statistical significance; angina HR 1.69 (95% CI, 1.18, 2.41, p-value 0.893), AF and flutter HR 1.86 (95% CI, 1.38, 2.51, p-value 0.154)stroke HR 1.29 (95% CI, 0.91, 1.81. p-value 0.719), all-cause mortality HR 2.68 (95% CI, 2.25, 3.19, p-value 0.858).
Exploratory analysis – alternate biomarker excluded
In our exploratory analysis of all cause GN with NTproBNP excluded, 11,339 of the 27,674 patients had 5-year follow-up data available from the time of the index event. Of those, 4,958 developed the primary composite MACE outcome. Of these, 2,608 (9.4% of all cause GN cohort) had a Troponin I above the 18 ng/L threshold. This equated to a HR of 1.81 (95% CI, 1.72, 1.92, p-value < 0.0001). When considering the secondary outcome, statistically significant increased risk was demonstrated for each component of MACE; IHD HR 1.69 (95% CI, 1.59, 1.80,p-value < 0.0001), Angina HR 1.48 (95% CI, 1.32, 1.66, p-value < 0.0001), AMI HR 1.91 (95% CI, 1.76, 2.07, p-value < 0.0001), HF HR 1.94 (95% CI, 1.82, 2.07, p-value < 0.0001), AF and flutter HR 1.61 (95% CI, 1.48, 1.75, p-value 0.003), stroke HR 1.28 (95% CI, 1.16, 1.42. p-value 0.05), all-cause mortality HR 1.51 (95% CI, 1.44, 1.58, p -value < 0.0001).
In our exploratory analysis of all cause GN with Troponin I excluded, 5,250 of the 13,376 patients had 5-year follow-up data available from the time of the index event. Of those, 2,183 developed the primary composite MACE outcome. Of these, 1,244 (9.3% of all cause GN cohort) had a NTproBNP above the 400 pg/ml threshold. This equated to a HR of 1.95(95% CI, 1.79, 2.12, p < 0.0001). When considering the secondary outcome, statistically significant increased risk was demonstrated for each component of MACE apart from angina;
IHD HR 1.72 (95% CI, 1.55, 1.90,p-value < 0.0001), AMI HR 1.67 (95% CI, 1.47, 1.91, p-value 0.006), HF HR 2.27 (95% CI, 2.06, 2.50, p-value < 0.0001), AF and flutter HR 2.09 (95% CI, 1.84, 2.38, p-value < 0.0001), stroke HR 1.52 (95% CI, 1.28, 1.79. p-value 0.01), all-cause mortality HR 2.41 (95% CI, 2.23, 2.60, p-value < 0.0001), angina HR 1.36 (95% CI, 1.15, 1.61, p-value 0.7521).


Comments (0)