
Remember me


Burnout among hospital physicians, nurses, and other clinicians, even before the COVID-19 pandemic, was reaching alarming levels motivating the National Academy of Medicine to embark on one of its largest and most comprehensive initiatives since its quality and safety reports in the early nineties.1–5 By 2021, one-third of physicians and nearly half of registered nurses (RNs) practicing in hospitals known to be good places to work (ie, Magnets) were experiencing high burnout.5 Nurse burnout was even higher in a representative sample of hospital nurses—51% burned out, and 25% reported they planned to leave their current hospital positions.6 Both physicians and nurses practicing in hospitals rank ‘increasing nurse staffing’ as highly important to improving their own well-being.5
Hospital leaders are taking a different approach to the current crisis in hospital staffing than suggested by physicians and nurses. They are opposing efforts to establish minimum safe hospital nurse staffing standards as being proposed in multiple states and in federal legislation. Instead, they are implementing “team nursing,” which is designed with significantly fewer RNs supervising lower-wage personnel such as nurses’ aides and licensed practical nurses (LPNs) to provide most of the direct care to patients. “Team” in this context is not a multidisciplinary team of professionals, which research shows enhances patient outcomes,7 but substitutes lower-wage workers for RNs, the effect of which is a reduction of RN care to patients. Since the onset of the COVID-19 pandemic, national organizations such as the American Hospital Association8 and the American Organization for Nursing Leadership9 have advocated for the return of team nursing as an innovative approach to address hospital nurse understaffing. In hospitals where team nursing is implemented, RNs report concerns for the quality and safety of patient care.10 Though promoted as an innovation,11 team nursing harkens back to the 1950s when it was the dominant model of hospital staffing in the United States necessitated by the national shortage of RNs that emerged on the heels of World War II.12 With the introduction of Medicare’s prospective payment system in the 1980s, hospital leaders moved to the employment of more RNs, including replacing LPNs with RNs to help reduce the length of stay and complications which would benefit them financially—the care model that predominates in hospitals today with most of the direct nursing care of patients provided by RNs.13–15
Empirical evidence demonstrates that substituting RN care with lower-wage nursing personnel is associated with poorer patient outcomes,16–19 which is unsurprising given the high-stakes nature of acute care for hospitalized patients. Poorer patient outcomes associated with reductions in RN care include a higher likelihood of mortality,19–21 hospital-acquired infections and sepsis,20,21 in-hospital cardiac arrest,19,21 falls with injury,20 increased lengths of stay,21,22 poorer patient satisfaction,20 and poorer nurse-reported quality and safety of care.20 Such studies measure reductions in RN care using measures of nursing hours per patient day (a measure of nurse staffing19) or through nurses’ reports on the composition of nursing staff in hospitals.20 The resurgence of interest in team nursing signals a need to re-evaluate the question of whether diluting RN care is consequential for patient outcomes.
This study uses contemporary data from a national sample of US hospitals in 2019—the year preceding the COVID-19 pandemic—to estimate the potential consequences of reducing the proportion of RNs on patient outcomes and health care costs for over 6.5 million Medicare patients nationally. The findings of this study aim to inform health care policy and hospital leadership on action priorities to address hospital nurse staffing challenges.
METHODS Study Design and SampleThis is a cross-sectional analysis of 3 linked datasets from 2019: the American Hospital Association (AHA) Annual Survey, Medicare Provider Analysis and Review (MedPAR) patient claims, and Hospital Compare’s Hospital Consumer Assessment of Healthcare Providers and Systems (HCAPHS). Data from 2019 were chosen purposefully to study hospital conditions prior to the COVID-19 pandemic. AHA data provide information on hospital-level nursing skill mix, total nurse staffing hours per patient day, bed size, teaching status, and technology capabilities. MedPAR claims data provide detailed patient-level records of hospitalizations, including admitting diagnosis/procedure, comorbid conditions, and relevant outcomes (ie, 30-day and in-hospital mortality, 30-day readmissions, and length of stay). HCAHPS data provide information on patient satisfaction ratings of hospital care.
Hospitals were included in the study if data on nursing skill mix and staffing were available from AHA, and they had HCAHPS data reported on Hospital Compare. Hospitals were excluded (n=72) if total nursing staff hours per patient day (HPPD) were <1 or >18.17,23 Federal, critical access, and psychiatric hospitals were excluded. The final hospital sample included 2676 general acute care hospitals nationally.
Patients were included if they were Medicare beneficiaries (65–99 y old) discharged from one of the study hospitals between January 1, 2019 and December 31, 2019. Patients admitted for a psychiatric or alcohol/drug-related condition were excluded. Patients with lengths of stay shorter than 1 day and greater than 30 days were excluded. The final patient sample included 6,559,704 patients.
Measures StaffingThe actionable variable of interest was the nursing skill mix, defined by the proportion of RNs in the total nursing staff, where total nursing staff is comprised of RNs, licensed practical nurses (LPNs), and unlicensed assistive personnel (UAPs).
OutcomesOutcome variables considered clinically meaningful to patients, as well as hospital administrators and payers, included in-hospital mortality, 30-day mortality, length of stay, 30-day readmissions, and HCAHPS star ratings. In-hospital mortality was defined as a death occurring during the hospitalization. Thirty-day mortality was defined as a death occurring within 30 days of hospital admission and included out-of-hospital deaths. Thirty-day readmission included patients readmitted to hospitals within 30 days after being discharged alive to home or home with home health care and excluded those who died in the hospital, were transferred to another facility, or were admitted to hospice. Patient satisfaction was derived from the HCAHPS star ratings publicly reported on Hospital Compare. Star ratings range from 1 star (lowest rating) to 5 stars (highest rating) on 10 HCAHPS measures (ie, communication with nurses, communication with doctors, communication about medicines, the responsiveness of hospital staff, cleanliness of hospital environment, the quietness of the hospital environment, discharge information, care transition, overall hospital rating, and recommendation of the hospital) in addition to a summary star rating which is a single summary rating to represent the 10 measures overall.
CostsProjected costs if hospitals reduced their nursing skill mix by 10 percentage points (and 20 percentage points) were estimated using Medicare-specific cost-to-charge ratios from patient-level charge data available in the MedPAR file and hospital-level cost reports from the Centers for Medicare and Medicaid Services Impact Files. The hospital labor hourly cost of an RN and non-RN (LPN, UAP) was derived from the Bureau of Labor Statistics (BLS) Employer Costs for Employee Compensation (ECEC) 2019 data, which is publicly available.
CovariatesHospital covariates included total nursing staff hours per patient day (hours from RNs, LPNs, and UAPS), bed size category (≤100 beds, 101–250 beds, 251–500 beds, >500 beds), teaching status (nonteaching: no medical fellows/residents; minor teaching: less than one fellow/resident per 4 beds; major teaching: one or more fellows/residents to 4 beds), and technology status (high vs. not) where high technology hospitals had the capacity to perform open-heart surgery or major organ transplantation. Patient covariates included age, gender, transfer status, Elixhauser comorbidities, do-not-resuscitate (DNIR) status, and a code for palliative care (Z515). Dummy variables for the DRG code were included to account for patient diagnosis/procedure.
AnalysisWe use descriptive statistics (percentages, means, SD, interquartile ranges) to report the characteristics and outcomes of patients and to show the variation in the percentage of RNs in the total nursing staff across hospitals. We describe the distribution of hospitals in their HCAHPS star ratings.
To estimate the effect of a 10 percentage-point reduction in the proportion of RNs to the total nursing staff on risk-adjusted patient outcomes, we employed logistic regression models adjusted for hospital-level and patient-level covariates. For dichotomous variables (ie, mortality, readmission), we report odds ratios (ORs) and 95% confidence intervals (CIs). For continuous variables with a skewed distribution (ie, length of stay), we report incident rate ratios (IRRs) from a zero-truncated negative binomial model. Ordered logit models are used to estimate the effects of a 10 percentage-point reduction in the proportion of RNs in the total nursing staff on the odds of losing 1 star in the HCAPHS star rating, controlling for hospital-level covariates.
Using coefficients from our adjusted regression modeling, we computed the projected numbers of additional deaths, readmissions, and hospital days if the study hospitals reduced their proportion of RNs by 10 and 20 percentage points, holding constant total nurse staffing hours per patient day. To compute avoidable additional deaths, we subtracted estimated deaths (at 10 and 20 percentage-point lower skill mix) from observed deaths. A similar approach was applied to estimate avoidable readmissions and avoidable days in the hospital. Additional Medicare payments from increased readmissions were computed by taking the difference between the observed and predicted readmissions in each hospital and then applying the percentage increase in readmissions to the payments from observed readmissions. To compute additional costs from longer lengths of stay, the difference between the observed and predicted length of stay was applied to a percentage increase in charges and then converted to costs using hospital-level Medicare-specific cost-to-charge ratios. Finally, we compute the expected return on investment (ROI) to hospitals for a 10 percentage-point reduction in RNs by calculating the expected change in hospital revenue from shorter lengths of stay divided by the expected change in nursing labor costs (Appendix, Supplemental Digital Content 1, https://links.lww.com/MLR/C821).
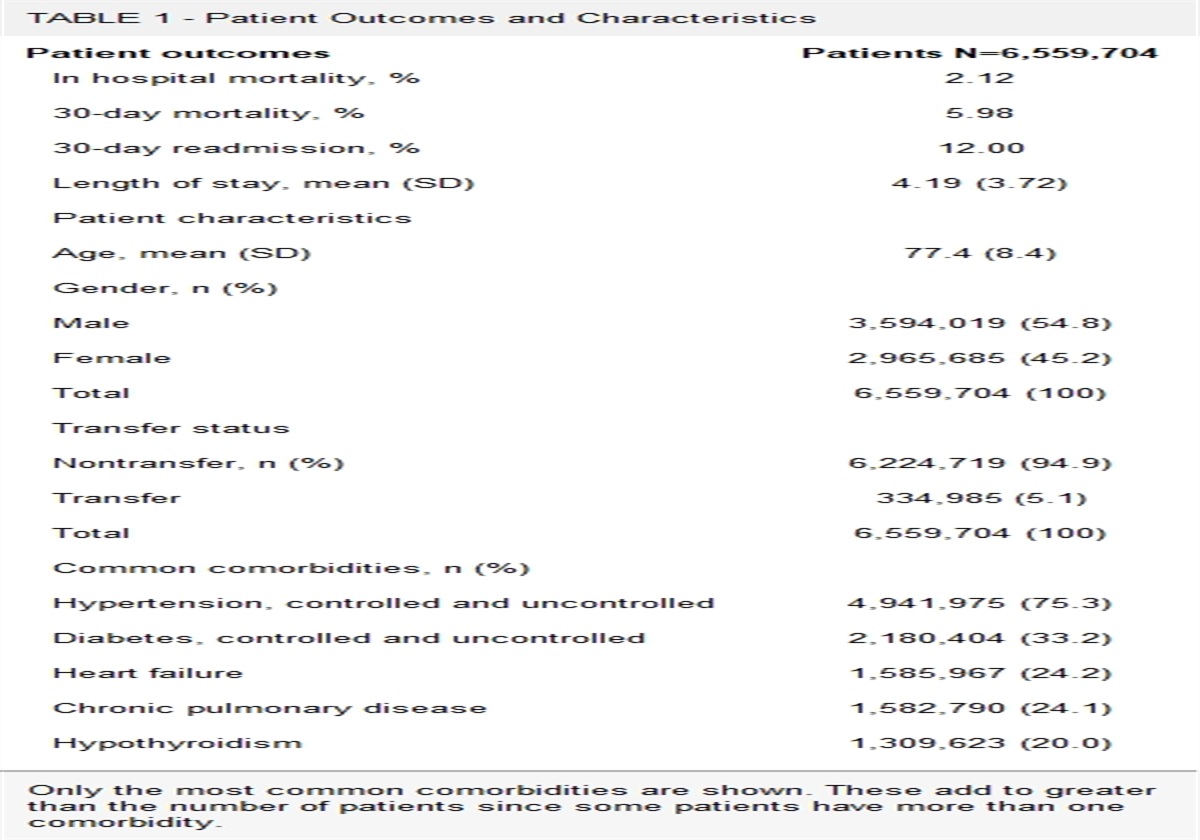
RESULTSThe patient sample included 6,559,704 Medicare patients admitted to 2676 general acute care hospitals (Table 1). Roughly 2% of these patients died in the hospital, and 6% died within 30 days of admission. Among those discharged home or home with home health care, 12% were readmitted within 30 days. The average length of stay was 4.2 days (SD: 3.7 d). The mean age of patients was 77.4 years (SD: 8.4 y), and 54.8% were male. The most common comorbidities included hypertension, diabetes, heart failure, chronic pulmonary disease, and hypothyroidism.
TABLE 1 - Patient Outcomes and Characteristics Patient outcomes Patients N=6,559,704 In hospital mortality, % 2.12 30-day mortality, % 5.98 30-day readmission, % 12.00 Length of stay, mean (SD) 4.19 (3.72) Patient characteristics Age, mean (SD) 77.4 (8.4) Gender, n (%) Male 3,594,019 (54.8) Female 2,965,685 (45.2) Total 6,559,704 (100) Transfer status Nontransfer, n (%) 6,224,719 (94.9) Transfer 334,985 (5.1) Total 6,559,704 (100) Common comorbidities, n (%) Hypertension, controlled and uncontrolled 4,941,975 (75.3) Diabetes, controlled and uncontrolled 2,180,404 (33.2) Heart failure 1,585,967 (24.2) Chronic pulmonary disease 1,582,790 (24.1) Hypothyroidism 1,309,623 (20.0)Only the most common comorbidities are shown. These add to greater than the number of patients since some patients have more than one comorbidity.
Roughly one-quarter of the 2676 study hospitals (29.3%) had 100 or fewer beds, 37.1% of hospitals had between 101–250 beds, 23.6% had 251–500 beds, and the remainder of hospitals (10.1%) had more than 500 beds (Table 2). Most hospitals (55.0%) were nonteaching hospitals, and more than half (55.6%) were classified as nonhigh technology hospitals. The proportion of RNs to total nursing staff averaged 76.5% RNs (SD: 8.7%; IQR: 72.5%–81.3%) and was somewhat higher on average in larger, major teaching and high technology hospitals.
TABLE 2 - Proportion of RNs in the Total Nursing Staff and Other Hospital Characteristics in 2676 Study Hospitals Proportion of RNs in the Total Nursing Staff Hospital characteristics % N Mean (SD) 25th percentile 75th percentile Overall 2676 76.5 (8.7) 72.5 81.3 Bed size ≤ 100 beds 29.3 783 73.7 (10.7) 68.1 80.8 101–250 beds 37.1 992 76.9 (7.8) 73.8 80.4 251–500 beds 23.6 632 78.5 (6.8) 75.8 82.0 > 500 beds 10.1 269 78.5 (7.1) 75.2 82.6 Teaching status Nonteaching 55.0 1471 76.2 (10.2) 70.2 83.4 Minor 36.4 974 76.6 (5.7) 73.6 78.9 Major 8.6 231 77.9 (8.7) 72.9 83.6 Technology Nonhigh 55.6 1202 75.3 (10.4) 70.0 82.2 High 44.4 961 78.6 (7.7) 74.7 83.4The total nursing staff is comprised of RNs, LPNs, and UAPs.
LPN indicates licensed practical nurses; RN, registered nurses; UAP, unlicensed assistive personnel.
The distribution of study hospitals’ HCAHPS star ratings, overall and across each of the 11 measures, is presented in Table 3. Hospitals are somewhat normally distributed across the 5-star rating categories. For example, 49.6% of hospitals achieved 3 stars in their summary star rating, 25.9% of hospitals achieved 4 stars, and only 1.5% of hospitals achieved 5 stars.
TABLE 3 - Hospital HCAHPS Star Ratings in 2676 Study Hospitals Star ratings 1 star, % 2 stars, % 3 stars, % 4 stars, % 5 stars, % Summary star rating 3.1 19.9 49.6 25.9 1.5 Overall hospital rating 3.8 15.1 49.2 29.2 2.8 Recommend hospital 4.9 24.3 38.0 29.8 3.0 Nurse communication 2.2 16.3 32.0 45.4 4.2 Doctor communication 6.0 28.4 40.8 21.1 3.8 Communication about medicines 5.1 28.2 45.4 18.1 3.1 Discharge information 3.9 18.6 47.4 26.0 4.3 Care transition 7.7 25.9 35.1 28.8 2.6 Staff responsiveness 5.5 19.5 45.4 25.0 4.7 Cleanliness 9.3 30.2 43.6 16.1 0.9 Quietness 11.6 20.5 32.8 26.6 8.6Percentages represent the distribution of hospitals across star ratings for each of the 11 categories reported in Hospital Consumer Assessment of Healthcare Providers and Systems (HCAHPS).
Table 4 provides the odds ratios (ORs) for mortality and readmissions and incident rate ratios (IRRs) for length of stay to indicate the effect of a 10 percentage-point reduction in the proportion of RNs to total nursing staff on patient outcomes and HCAHPS star ratings. Adjusting for patient and hospital characteristics, a 10 percentage-point reduction in the proportion of RNs to total nursing staff is associated with 7% higher odds of in-hospital mortality (OR 1.07, 95% CI: 1.04–1.10, P<0.001), 4% higher odds of 30-day mortality (OR 1.04, 95% CI: 1.02–1.07, P<0.001), and 1% higher odds of 30-day readmission (OR 1.01, 95% CI: 1.00–1.02, P=0.005). The expected days per hospital stay is associated with a 2% increase (or a factor of 1.02) for every 10 percentage-point reduction in the proportion of RNs to total nursing staff.
TABLE 4 - Effect of a 10 Percentage-Point Reduction in RNs to Total Nursing Staff on Patient Outcomes and Odds of Losing a HCAHPS Star Rating Patient outcomes Odds ratio (95% CI) P In-hospital mortality 1.07 (1.04–1.10) <0.001 30-day mortality 1.04 (1.02–1.07) <0.001 30-day readmission 1.01 (1.00–1.02) 0.005 Incident rate ratio (95% CI) P Length of stay 1.02 (1.01–1.03) <0.001 Hospital HCAHPS star ratings Odds ratio (95% CI) P Summary star rating 1.14 (1.05–1.24) 0.003 Overall hospital rating 1.23 (1.13–1.34) <0.001 Recommend hospital 1.27 (1.17–1.38) <0.001 Nurse communication 1.09 (1.00–1.19 0.047 Doctor communication 1.01 (0.93–1.10) 0.851 Communication about medicines 1.20 (1.10–1.30) <0.001 Discharge information 1.14 (1.05–1.24) 0.003 Care transition 1.18 (1.09–1.28) <0.001 Staff responsiveness 1.11 (1.02–1.21) 0.016 Cleanliness 1.04 (0.95–1.13) 0.436 Quietness 0.99 (0.91–1.07) 0.796 Odds ratios and incident rate ratios represent the effect of a 10 percentage-point decrease in the proportion of RNs in the total nursing staff. Coefficients for in-hospital mortality, 30-day mortality, and 30-day readmission represent ORs; coefficients for length of stay represent IRRs. The patient outcomes models are adjusted for patient covariates (ie, age, gender, transfer status, Elixhauser comorbidities, DNR status, palliative care code (Z515), and dummy variables for DRG code) and hospital covariates (ie, total nursing staff hours per patient day, bed size, teaching status, technology status). The hospital HCAHPS models are adjusted for hospital covariates only. Full model output for in-hospital mortality results are available in Appendix, Supplemental Digital Content 1, https://links.lww.com/MLR/C821.HCAHPS indicates Hospital Consumer Assessment of Healthcare Providers and Systems; IRR, incident rate ratios; OR, odds ratios; RN, registered nurses.
Because most study hospitals had more than 70% RNs in their total nursing staff, it is difficult to reliably project the effect on patient outcomes of reducing the proportion of RNs to levels associated with team nursing. We can project from our models that a 50 percentage-point reduction in RNs, from our observed average of 76.5% RNs, would be associated with 38% higher odds of in-hospital mortality, 24% higher odds of 30-day mortality, 6% higher odds of readmission and a 10% increase in the expected length of stay; though these results should be interpreted cautiously since the lowest proportion of RNs in the total nursing staff in the observed study hospitals was a single hospital with 33% RNs.
A 10 percentage-point reduction in the proportion of RNs was significantly associated with higher odds of a hospital losing one star on all HCAHPS measures – except cleanliness, quietness, and doctor communication. For example, a 10 percentage-point decrease in the proportion of RNs was associated with 23% higher odds of losing a star on “overall hospital rating” and 27% higher odds of losing a star on “recommending the hospital.”
Using adjusted effects from the regression models, we estimate the annual number of avoidable deaths, the excess costs (to Medicare) for avoidable readmissions, and forgone cost savings (to hospitals) from longer lengths of stay if hospitals were to reduce their proportion of RNs by 10 and 20 percentage points (Table 5). If hospitals reduced their proportion of RNs by 10 percentage points (holding constant total nursing hours per patient day), we project 10,947 additional deaths would occur (22,193 additional deaths would occur with a 20 percentage-point lower proportion of RNs)—every year. In all, 5207 avoidable readmissions (at 10 percentage-point lower proportion of RNs) and 10,455 avoidable readmissions (at 20 percentage-point lower proportion of RNs) would occur annually, translating to roughly $68.5 million and $137.5 million, respectively, in additional costs to Medicare. We estimate roughly $2.9 billion in forgone cost savings to hospitals from longer lengths of stay if hospitals were to reduce their proportion of RNs by 10 percentage points. Forgone cost savings if hospitals were to reduce their proportion of RNs by 20 percentage points is estimated at roughly $4.4 billion, year over year.
TABLE 5 - Annual Projected Avoidable Deaths, Readmissions and Hospital Days, and Additional Costs if Hospitals Reduced RNs in the Total Nursing Staff by 10 and 20 Percentage-Points 30-day mortality 30-day readmission Length of stay Number of patients at risk of experiencing outcomes 6,559,704 4,534,370 6,318,887 Observed number of patients experiencing outcomes 392,392 542,906 The expected number of patients experience outcomes at 10 percentage-point reduction of RNs 403,339 548,112 Difference between observed and expected patients experiencing outcomes at 10 percentage-point reduction of RNs 10,947 avoidable deaths 5207 avoidable readmissions The expected number of patients experience outcomes at 20 percentage-point reduction of RNs 414,585 553,361 Difference between observed and expected patients experiencing outcomes at 20 percentage-point reduction of RNs 22,193 avoidable deaths 10,455 avoidable readmissions Observed total payments $7,143,925,521 Projected additional Medicare payments at 10 percentage-point reduction of RNs $68,511,067 Projected additional Medicare payments at 20 percentage-point reduction of RNs $137,568,413 Observed number of patient days 26,447,657 Expected number of patient days at 10 percentage-point reduction of RNs 27,012,130 Difference between observed and expected patient days at 10 percentage-point reduction of RNs 564,473 avoidable days The expected number of patient days at 20 percentage-point reduction of RNs 27,430,239 Difference between observed and expected patient days at 20 percentage-point reduction of RNs 982,582 avoidable days Observed total charges $397,704,533,476 Projected total charges at 10 percentage-point reduction of RNs $407,224,083,989 Projected additional cost after applying cost-to-charge ratio at 10 percentage-point reduction of RNs $2,937,130,606 Projected total charges at 20 percentage-point reduction of RNs $413,524,202,828 Projected additional cost after applying cost-to-charge ratio at 20 percentage-point reduction of RNs $4,408,895,669RN indicates registered nurses.
From the patient's perspective, the answer is a definitive “no” since patients are more likely to die, experience readmissions, and have longer hospital stays when hospitals substitute RNs with other nursing personnel, and patients’ out-of-pocket costs would not be reduced. From the perspective of the payer (ie, Medicare), hospitals’ substitution of RN nursing care is associated with increased avoidable readmissions, which translates into millions of dollars annually in avoidable costs to Medicare.
If any stakeholder is likely to benefit from substituting RN care with lower-wage nursing staff, it is hospitals that can expect reductions in nursing labor costs. To evaluate the business case for a nursing skill mix reduction, we first computed the expected change in hospital nursing labor costs and found that a 10 percentage-point reduction in RNs to total nursing staff was associated with cost savings to hospitals of $31.94 per patient day (Appendix, Equation 1, Supplemental Digital Content 1, https://links.lww.com/MLR/C821). Do the labor cost savings outweigh the lost revenue to hospitals of longer patient stays associated with reductions in RN care? We found that the estimated increase in the expected length of stay associated with a 10 percentage-point reduction in RNs translates into $66.03 of lost revenue to the hospital per patient day (Appendix, Equation 2, Supplemental Digital Content 1, https://links.lww.com/MLR/C821). Thus, we project that the return on investment (ROI) to hospitals of a 10 percentage-point reduction in RNs is more than a 2-fold loss (Appendix, Equation 3, Supplemental Digital Content 1, https://links.lww.com/MLR/C821). For a 500-bed hospital, assuming an average occupancy rate of 85%, this negative ROI translates to a $5 million loss annually: (500 beds X 85% occupancy) X (365 days) X (-$66.03 - $31.94)=-$5,288,211. Taken together, our analysis shows that replacing RNs with lower-wage nursing personnel is associated with poorer outcomes for patients, higher payments for Medicare, and a negative ROI for hospitals, suggesting an overall poor business case for substituting RNs with lower-wage nursing staff.
DISCUSSIONThe average US hospital in 2019 employed a nurse staffing model that was comprised of 76.5% RNs to total nursing staff (ie, RNs, LPNs, and UAPs). There was only modest variation from the mean, with hospitals at the 25th percentile employing a nursing composition of 72.5% RNs and those in the top 75th percentile employing a nursing composition of 81.3% RNs. Transitioning to a significantly lower proportion of RNs to total nursing staff, consistent with team nursing models of care, would represent an extreme downward shift in the level of RN care currently delivered in US hospitals.
Modeling the potential consequences of diluting RN nursing care to the levels proposed by proponents of team nursing was beyond the scope of what could reasonably be modeled with current data since most hospitals currently employ RNs relative to total nursing staff in proportions well above the levels observed in U.S. hospitals before 1980 when Medicare implemented prospective payment. Even with a conservative approach of modeling the effect of a 10 percentage-point reduction in RNs, our models estimate that substituting RN care would be associated with significantly higher odds of patient death, readmission, longer lengths of stay, and decreased patient satisfaction.
Our study also found, consistent with others,24 that reducing the proportion of RNs in the total nursing staff is associated with higher costs of care. We project that if hospitals were to reduce their proportion of RNs by 10 percentage points while holding constant the total nursing personnel hours per patient day, patients would experience longer lengths of stay, which translates into roughly $2.9 billion annually in forgone cost savings to hospitals. These estimates are conservative since we only model outcomes among Medicare beneficiaries, who represent about half of the inpatient days in the typical US hospital.25
Our findings indicate that hospitals shifting to a team nursing model of care in the current context of average patient acuity and high-stakes hospital care would negatively impact patients—who would be more likely to die, be readmitted, and have longer hospital stays. Team nursing models of care would negatively impact payers—who would pay for the avoidable excess readmissions. Replacing RN care with lower-wage nursing staff, such as LPNs and UAPs, is also a poor business strategy for hospitals since we compute a negative ROI from substituting RNs with non-RNs. Consistent with other studies, we find the business case for RNs is strong, since the costs of more RN hours are largely recovered in shorter lengths of stays.21,24,26,27
Other research has shown that nurses working in hospitals with lower proportions of RNs are more likely to report a high degree of burnout and job dissatisfaction, correlates of high and expensive turnover.20 Though we were unable to study the impact of substituting RNs on nurse job outcomes in the current study, previous evidence suggests that diluting the presence of RNs in hospitals could further exacerbate hospitals’ struggles to recruit and retain RNs.
A justification by hospital leaders for pursuing alternative models of nursing care including substituting RNs with LPNs and UAPs, is the claim that the country cannot train enough RNs to continue to have RNs providing direct care to patients. The evidence suggests otherwise.28 Nursing is a highly popular career choice, resulting in a robust pipeline of Americans applying to nursing schools and graduations now reaching 188,000 new US-educated RNs in 2022.29 A million additional nurses are being added to the national RN supply about every decade, with 5.2 million active RNs in the United States in 2022.30 The United States remains the top destination for internationally educated nurses, if they are needed to supplement RN supply.
Much research points to the root cause of the shortage of nursing care in hospitals, being dangerously high nurse workloads resulting from too few funded positions and poor work environments that result in double-digit RN annual turnover rates.1,5,6 Hospitals struggling to hire RNs should consider addressing the root causes of nurse burnout and turnover–nurse understaffing and poor work environments.1,5,6 It is important for research to be conducted on alternative models of hospital staffing, like team nursing, not only because they may be dangerous to patients but also because advocacy for these alternative models undermines other evidence-based solutions from being advanced and implemented, like establishing minimum safe hospital nurse staffing requirements as team nursing models would likely fall below minimum safe nurse staffing standards as adopted in California and Oregon and those currently under consideration in multiple states including Pennsylvania, Illinois, Maine, Massachusetts, and Michigan.
LimitationsOur projected additional deaths and cost estimates are likely underestimates since we study only Medicare patients and since we do not measure the cost consequences to hospitals that might result from increased nurse burnout and turnover known to be associated with the substitution of non-RNs for RNs. Additionally, the estimation of ROI for hospitals is incomplete since we do not account for all possible consequences of nursing care on both revenue and cost factors – for example, the change in value-based payments from low
Comments (0)