
Remember me

The present study is a prospective observational cohort study conducted at a single center (Trieste University Hospital) enrolling patients referred to the Liver Clinic Unit. The study consisted of two parts: the first part (1st May 2018 to 31st December 2020) aimed to derive a prediction model, whereas the second part (1st January 2021 to 31st December 2021) was designed to enroll a cohort of patients where the model could be validated. We enrolled consecutive patients with a diagnosis of liver cirrhosis and the presence of HRVs and an indication for primary prophylaxis with NSBB for first variceal bleeding prevention. The diagnosis of liver cirrhosis was established utilizing a combination of clinical, biochemical, and ultrasound imaging (e.g., nodular liver surface, coarse liver echotexture), and/or histological examination [15, 16]. The prescription and initiation of NSBB therapy were part of the patient's routine therapeutic course, and their participation in the study did not interfere with the established practice of treatment, which was assessed following current guidelines.
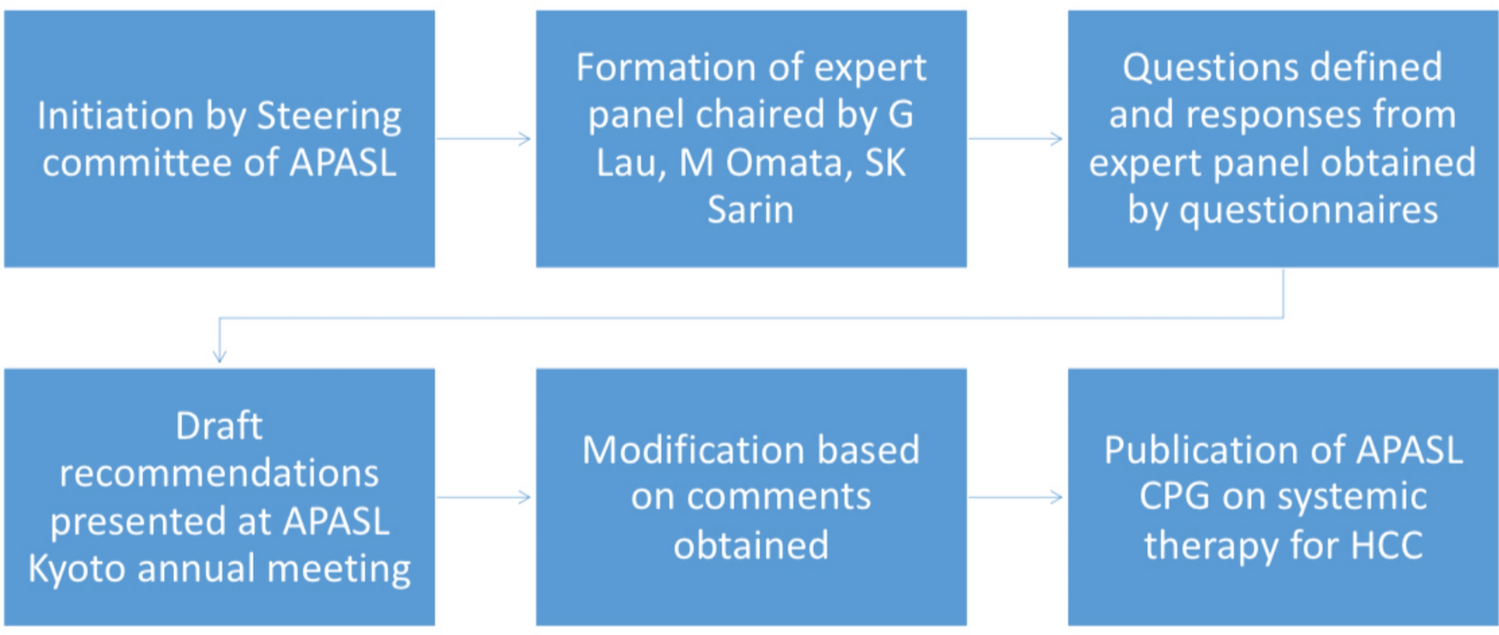
Each eligible patient was evaluated at baseline through clinical assessment (physical examination, vital parameters such as heart rate and arterial blood pressure, and anthropometric characteristics such as height, weight, and calculation of body mass index) and with the following laboratory tests: white blood cell count (WBC), hematocrit, hemoglobin, platelet count, INR, aspartate aminotransferase (AST), alanine aminotransferase (ALT), gamma-glutamyl transferase (GGT), alkaline phosphatase (ALP), sodium, potassium, total bilirubin, albumin, and creatinine. The Child–Pugh [17] and model for end-stage liver disease (MELD) [18] scores were calculated for each patient. On the same day, each patient underwent liver and spleen elastography measurements and evaluation of ultrasonographic parameters such as portal vein diameter, portal flow velocity, spleen bipolar diameter, and spleen surface measured at the hilum. After this initial screening, patients with LS > 20 kPa and platelet count < 150.000 × 10⁹ cells/L underwent EGD for EVs screening within 10 days. Patients with endoscopic evidence of HRVs and without NSBB contraindications were prescribed an NSBB with dose titration as suggested by the American Association of the Study of the Liver guidelines [1]. Propranolol was started with a dose of 20–40 mg orally twice a day, with dose adjusting every 2–3 days (maximum daily doses of 320 mg/day in patients without ascites and 160 mg/day in patients with ascites). Carvedilol was started with a dose of 6.25 mg once a day and a dose adjustment every 3 days (maximum daily dose of 12.5 mg/day). Each patient who started NSBB therapy was closely monitored in the first 3 weeks for dose titration and then re-evaluated after 3 months (physical examination, liver, and spleen elastography, and laboratory exams), six (physical examination, liver, and spleen elastography, liver ultrasound examination, and laboratory exams), and twelve (physical examination, liver, and spleen elastography, liver ultrasound examination, laboratory exams, and EGD) months after therapy initiation, as shown in Fig. 1.
Fig. 1
Description of follow-up timeline from enrollment. Eligible patients underwent baseline clinical assessment, laboratory tests, and elastography measurements liver stiffness > 20 kPa and platelet count < 150.000 × 10⁹ cells/L underwent EGD for EVs screening within 10 days. Patients with HRVs were prescribed NSBBs, and re-evaluated at 3/6 months, and 1-year post-therapy initiation. a Flowchart reporting patients who completed follow-up in the derivation cohort, while b reports patients who completed follow-up in the validation cohort
Inclusion criteriaThe inclusion criteria for the study were: age > 18 years with liver cirrhosis regardless of etiology, who had undergone esophagogastroduodenoscopy (EGD) according to Baveno VI criteria (LS > 20 kPa and platelet count < 150.000 × 10⁹ cells/L) [19] with evidence of HRVs and candidate to NSBB therapy.
Exclusion criteriaWe categorically excluded patients with previously diagnosed and/or treated for hepatocellular carcinoma (HCC), portal vein thrombosis, previous treatment with NSBB or endoscopic variceal band ligation (EBL), with contraindications to NSBB administration (heart rate < 50 bpm, systolic blood pressure < 100 mmHg, aortic disease, atrioventricular blocks, severe peripheral angiopathy, asthma or chronic obstructive pulmonary disease of any severity), pregnant female patients, severe obesity (BMI > 40), and known hematological disease of any kind. Furthermore, considering that ongoing liver injury, as delineated by guidelines, typically influences subsequent endoscopic evaluations for patients with suspected clinically significant portal hypertension (CSPH) [1] and may impact NSBB response prediction, we chose to exclude all patients with ongoing liver injury (e.g., ongoing alcohol abuse, untreated HCV or HBV infection, or autoimmune flares without immunosuppressive treatment). In addition, due to limited resources, we made the decision to exclude from the final analysis any patients who experienced variceal hemorrhage prior to their initial elastography follow-up after beginning NSBB treatment (i.e., 3 months after first administration).
Endoscopic assessment of esophageal varicesEGD was performed by the staff of the Gastrointestinal and Endoscopy Service at Trieste University Hospital using PENTAX endoscopic devices EPK-i7010 series. All the instruments are at high definition. The exploration of the esophagus was performed spending at least 3 min initially in a deflated state, obtaining at least three images (upper, middle, and lower esophagus), and then at maximum insufflation using CO2, again obtaining at least three images (upper, middle, and lower esophagus). The images obtained were stored in the EndoxWeb software available in the hospital management system. The endoscopic classification of EVs was performed according to the Beppu Classification [20]. HRVs were defined as EVs ≥ F2 with/without red signs or F1 with red signs. For each EGD, EVs classification was assessed by a second experienced endoscopist, blind to the first endoscopist grading, using the stored image obtained by the endoscopist who performed the EGD. When agreement was not reached between the two classifiers, a third endoscopist was consulted to confirm one of the two classifications. All the endoscopists are experts in EVs diagnostic and therapeutic evaluation both in elective and urgent settings.
Outcome definitionWe defined a binary outcome of response to NSBB according to endoscopic evaluation or the presence of variceal hemorrhage. We defined as “responders” the patients with stationary or downstaged variceal grading at the 12-month EGD. In contrast, we defined as “non-responders” the patients with upstaging variceal grading at the 12-month EGD or at least one variceal hemorrhage episode during the 12-month follow-up.
Elastography measurementLiver and Spleen Stiffness were measured using a Philips Affiniti 70 (ElastPQ Protocol) ultrasonography system with a 1–5 MHz convex probe [21,22,23,24,25,26]. All measurements were performed by four experienced operators (> 500 elastography examinations each). Patients were positioned in supine decubitus with the right arm (liver) or left arm (spleen) in maximal abduction to increase the intercostal acoustic window. The region of interest (ROI) was placed between the VII and VIII segments at least 1.5 cm from the hepatic capsule (LS) and at the splenic hilum or lower pole at least 1 cm from the splenic capsule (SS) [22]. The ROI was accurately located in an area without large liver vessels, bile ducts, and rib shadows. During the acquisition, the patient was requested to hold his/her breath for 5 s [27]. All measures obtained after a deep inspiration, maximal expirations, and Valsalva maneuver were discarded. In some cases, breath-hold was practiced with the patient prior to initiating elastography. Ten different valid elastography measurements were obtained in all subjects, both in the liver and the spleen, and the median value was used. The measure obtained was acquired only if its standard deviation was < 30% [27]. We defined “technical failure” as the impossibility of obtaining any value or an IQR/M ≥ 0.30 and selected values with an IQR/M < 0.30 [27]. All patients were examined after overnight fasting and without caffeine intake in the previous 3 h. Each physician performing elastography examination was blind to the initial endoscopic patient status and was not informed about the initial endoscopic status or development of complications (e.g., variceal hemorrhage) in any of the follow-up appointments.
Adaptation of Kim et al.’s modelKim et al. [14] proposed a univariate model based on SS. In particular, the linear predictor (LP) was calculated as follows: 0.0490–2.8345 × ΔSS, where ΔSS was defined as SS (3rd-Month-Follow-up) – SS(Enrollment). In addition, Kim et al. employed the Siemens Acuson S2000TM ultrasound system (Siemens AG, Erlangen, Germany) to perform LS and SS measurements and provided results in m/s. Given that our system provided measurements in kPa, they were converted into m/s using the following conversion: Measurem/s = √(MeasurekPa/3).
Statistical analysisAccording to our sample size, the Shapiro–Wilk test was performed to verify the normal distribution of variables [28], whose results indicated the absence of normally distributed variables, which were therefore reported as median (Quartile 1; Quartile 3). Differences between continuous variables were examined using the Mann–Whitney U test. Variable correlations were analyzed using the Spearman’s rank correlation test [29]. Exploratory data analysis in the derivation cohort revealed moderate to high correlations between variables, thus the need for variable shrinkage to avoid overfitting. Therefore, we employed the least absolute shrinkage and selection operator (LASSO) logistic regression [30] by selecting a penalization factor (i.e., lambda, λ) across tenfold cross-validation with the lowest cross-validation error, which resulted in a λ = 6.70. Then, we applied the penalization factor and selected variables with an absolute value of the β coefficient >|0.01|, which resulted in the selection of three variables: 3-month LS percentual decrease, 3-month SS percentual decrease, and 3-month HR percentual decrease. Univariate logistic regression was performed for each of the three variables with tenfold cross-validation, followed by multivariate logistic regression using all three variables. For each model, the primary performance measure was measured using the area under the receiver-operating characteristic curve (AUROC), and calibration with Nagelkerke Pseudo-R2, Akaike Information Criterion (AIC), Bayesian Information Criterion (BIC). Statistical comparison of the AUROC for the separate models was performed using DeLong’s Test. The model was developed to predict response to NSBB. Therefore, for cut-off analysis, it is crucial to identify those patients who do not respond to NSBB treatment. Achieving a high specificity is important for this group, because false positives must be very rare so that patients who do not respond to treatment will be closely monitored or sent to more invasive diagnostic follow-up tests. Therefore, we planned to use a cut-off value that achieved a specificity of 100% (or closest to 100% if none reached 100%) and to compare sensitivities using McNemar’s matched pairs test. Each derived model and cut-off values were then evaluated in the validation cohort by AUROC analysis. For all analyses, two-sided statistical significance was defined as p < 0.05 [22]. The model provided in our cohort of patients was compared to the model by Kim et al. [14] in terms of AUROC (DeLong’s Test), AIC, BIC, and Nagelkerke Pseudo-R2. Data were analyzed using Python (Version 3.11.2) using numpy, matplotlib, pandas, scipy and sklearn packages.
Comments (0)