
Remember me
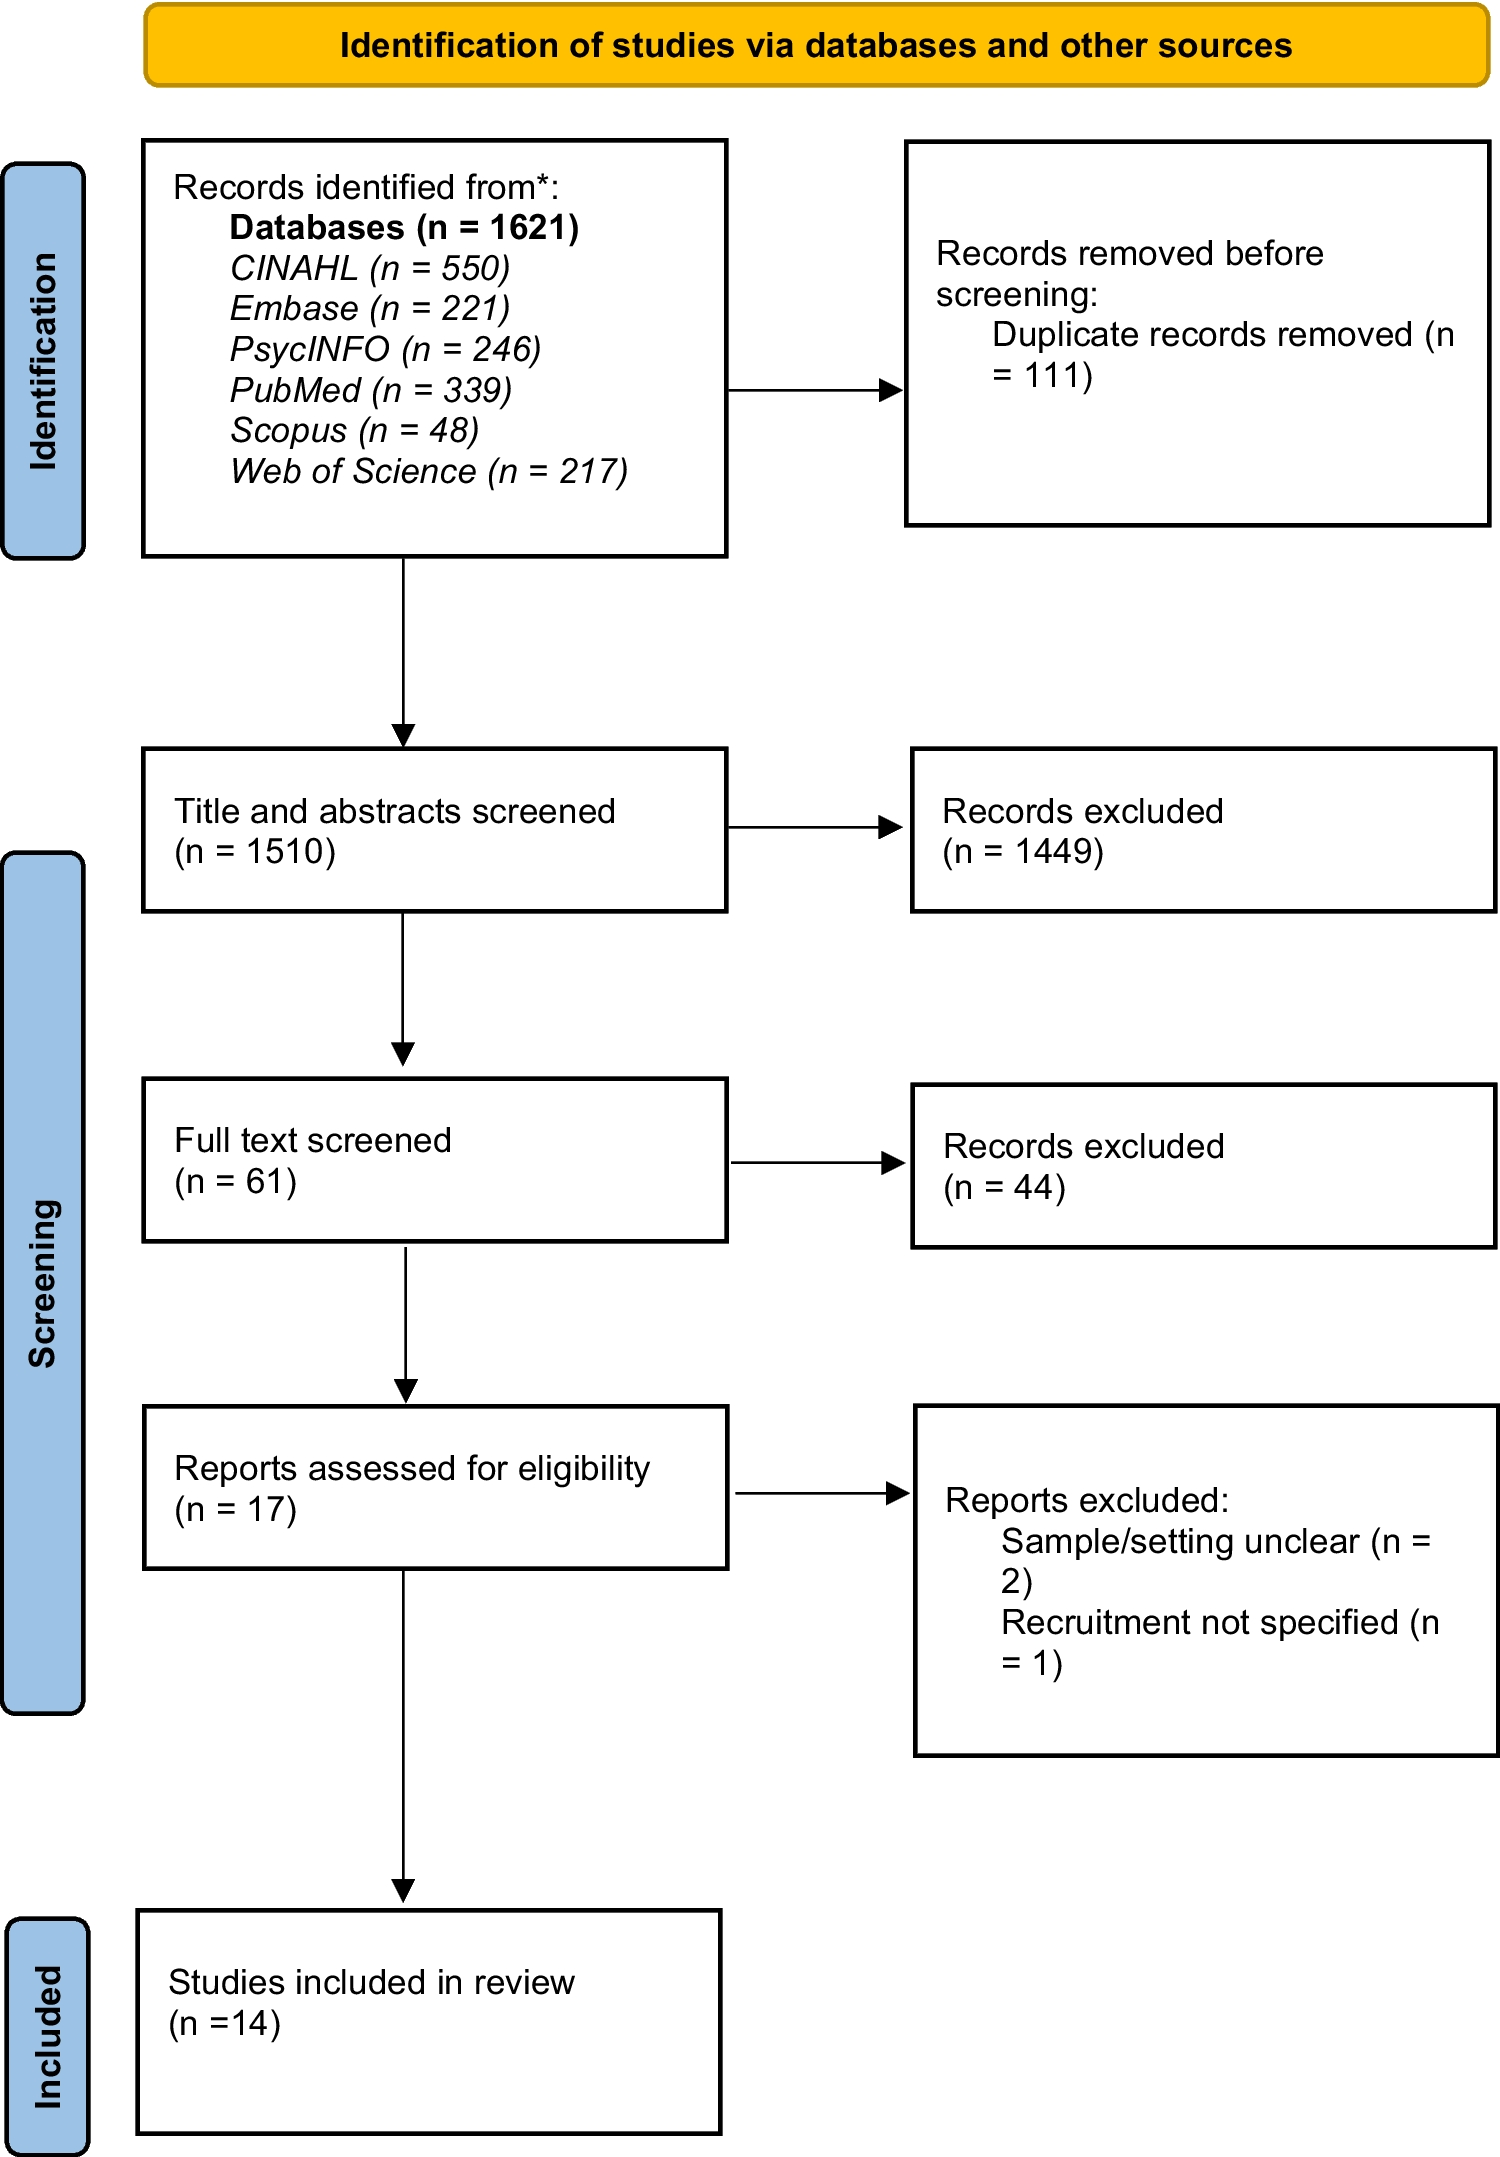
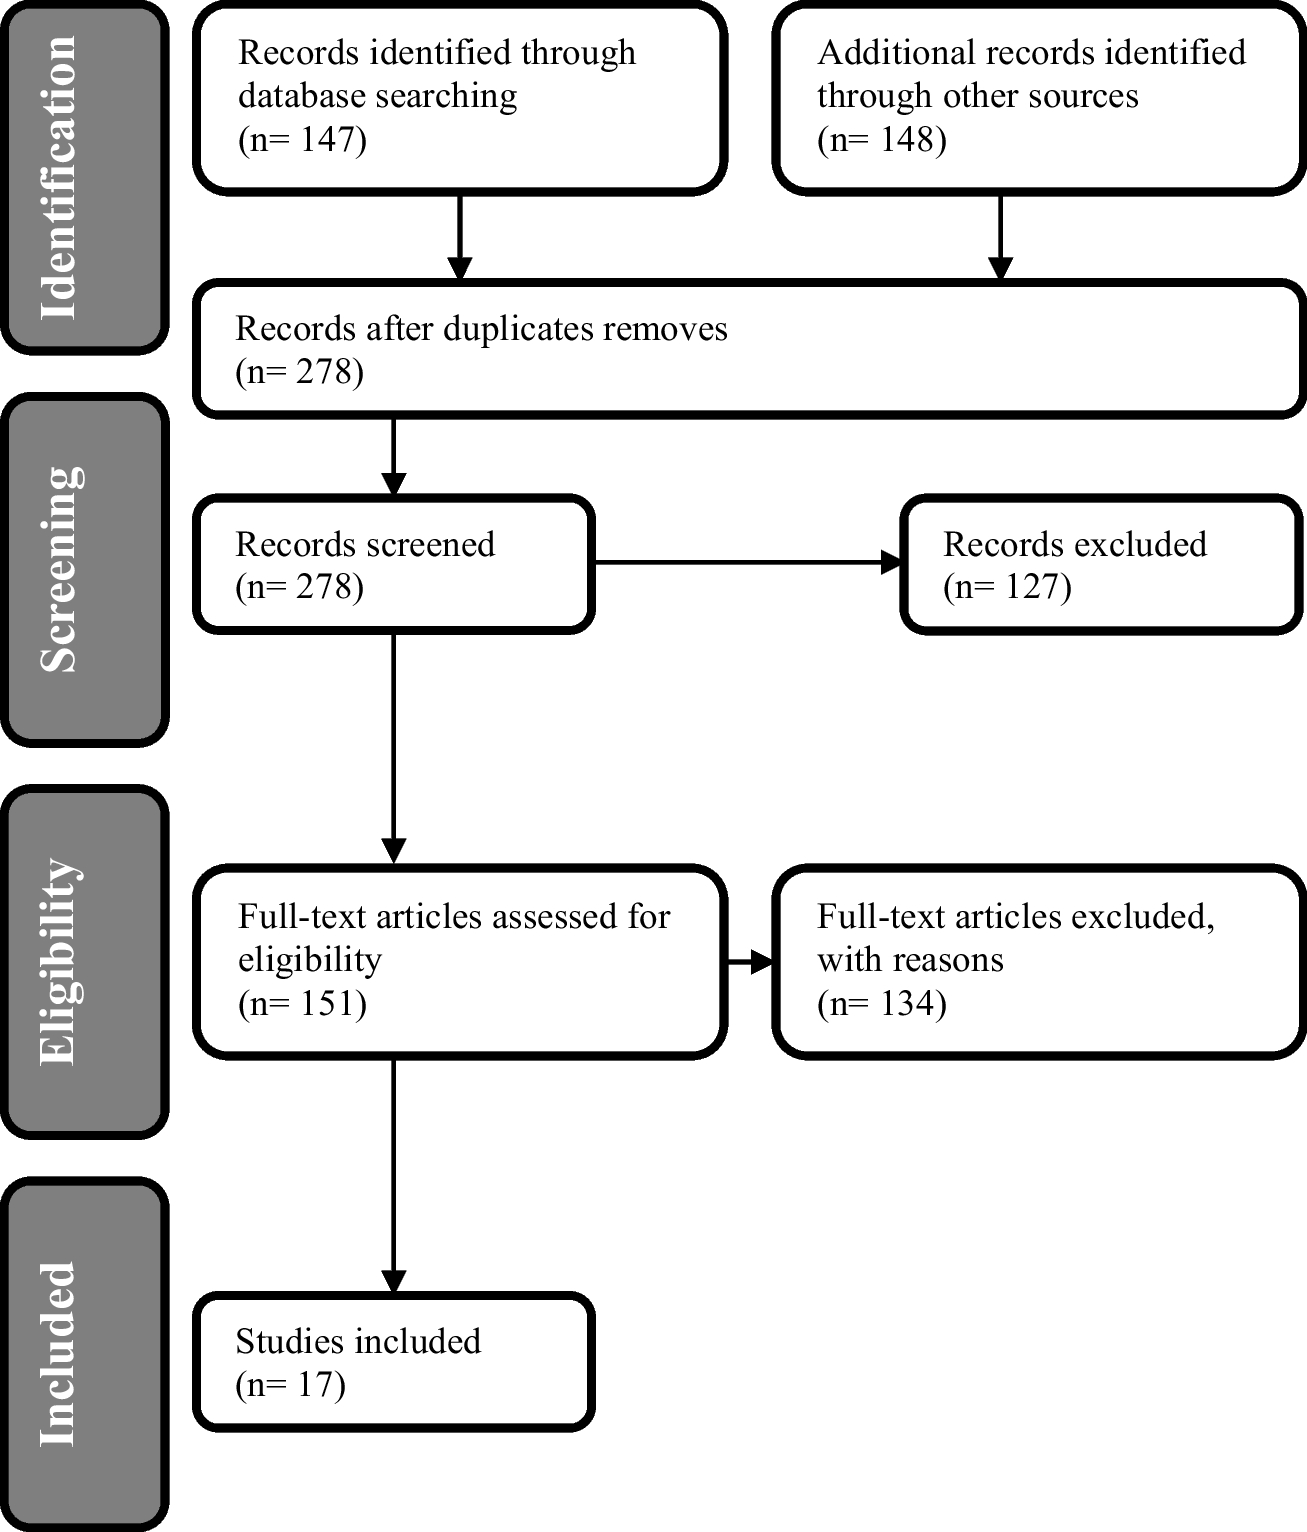
Figure 1 shows the flowchart of the record identification and selection process based on the PRISMA 2020 updated flowchart. Across the search, 14 studies in total were included: quantitative (n = 11), mixed methods (n = 1), and qualitative (n = 2). The final 14 papers included in this review were published between 2011–2023. The study characteristics from each of the included papers are outlined in Table 1.
Fig. 1
Flowchart of the record identification and selection process based on the PRISMA 2020 updated flowchart
Table 1 Study characteristics of included research papersItems/outcome measures used in the quantitative and mixed methods studiesTable 2 summarises the specific items/outcomes used to measure the quality of care and the prevalence of each item. The items/outcomes have been grouped into overarching domains. The prevalence is reported in percentages by totalling the frequency of each item/outcome across the included papers. This was calculated by totalling the number of items in each domain and dividing by the total number of papers with a quantitative measure of care quality (n = 12). Where instruments were specified, this has been included.
Table 2 Synthesised findings of quantified measures of quality of careThe quality items measures were categorised into 16 domains. The most frequently identified measure of quality care across all the items/outcomes in the 12 studies related to the domain of medication. The frequency of medication as a quality measure was 91.6% across all the items. Medication-related data were measured as an indicator of care quality in six of the included studies. The second most frequent measure of care quality was in the domain of nutrition. The prevalence of nutrition factors as a measure of quality care was 83.3%, also across six studies. Other domains identified as measures of quality care included physical restraints, physical incidents, continence care, functional and recreational activities, pressure ulcers, interactions, general quality, pain, BPSD, healthcare service usage, person-centred care, staffing levels, staff time, and others.
The study by Lepore et al. (2023) reported the highest number of quality outcomes measured. This study reported the number of quality measures specific to Alzheimer’s and related dementia across four countries (Germany, n = 10; Switzerland, n = 6; Flanders, Belgium, n = 8; and the Netherlands, n = 34). Some of the quality measures overlap between countries. Anderson and Blair (2021) used 12 care quality measures. They employed multiple methods and items in each of the 12 measures to produce a calculated composite variable for each measure. As they specified 12 quality of care measures, these 12 composite variables are reported in Table 2. The measures used in the study included better staff treatment of residents (ratings), better staff treatment of residents (observed), usage of other healthcare professionals, activities, adverse physical incidents, assessment/treatment of food and fluid, less psychotropic medication, general quality of care, lower restraint use, greater assistance with meals, communicating about residents, and person-centred care. The authors noted that, although it is unusual to use this many measures, they did so to avoid overreliance on standardised measures, which can sometimes be insensitive to change. Anderson and Blair (2021) used a mixed-methods approach, including interviews where questions were asked and rated on a scale from 1 to 5, producing numerical data. For this reason, these have been included in the quantitative synthesis in Table 2.
Kirkham et al. (2022) used ten measures of quality care. They used an overall care quality rating, frequency and severity of responsive behaviours, cognitive function, ADL, mobility, food/fluid intake, presence of pressure ulcers, frequency of falls, use of medications for responsive behaviours, and use of physical restraints. The rationale of the quality measures used was based on standard indicators used for measuring care quality in long-term care settings in Canada. Overall quality and behaviours were measured using a 5-point Likert scale from ‘significantly worse’ to ‘significantly improved’. Cognitive function, ADL, mobility and food/fluid intake had the same ratings with additional ‘I don’t know’, and pressure ulcers, falls, medications, and physical restraints had response values of ‘significantly increased’ to ‘significantly decreased’ and ‘I don’t know’. Data was collected on the basis of self-reported staff perceptions.
Four studies, Nazir et al. (2011), Gordon et al. (2016), Joyce et al. (2018), and River-Hernandez et al. (2019) used quality care items/outcomes using data from the Minimum Data Set (MDS). The MDS is a standardised assessment tool used in long-term residential care facilities to assess the clinical status and care needs of residents. The MDS can be used to collect data on health status, physical functioning, cognitive ability, medication use, and other clinical and personal information. The data is used to develop care plans and inform policy decisions. How each study used MDS data as items/outcomes of care quality varied. Nazir et al. (2011) used items from the behaviours section of the MDS 2.0 to calculate incidences of worsening behaviours. Gordon et al. (2016) used the MDS 3.0 to collect data on 11 care quality items. The primary care quality outcomes were physical restraint and antipsychotic medication use. The secondary quality outcomes were the percentage of long-stay residents with an increased need for help with activities of daily living, residents with self-reported moderate to severe pain, high-risk residents with pressure ulcers, weight loss, continence care, depressive symptoms, and residents experiencing one or more falls with a major injury. Joyce et al. (2018) used the MDS 2.0 for the presence of inappropriate antipsychotic use and the use of physical restraints as quality measures. Additional quality outcomes included the use of feeding tubes and indwelling urinary catheters, the presence of pressure ulcers and the occurrence of hospitalisations. River Hernandez et al. (2019) measured care quality using the number of re-hospitalisations from the MDS and nursing home ratings based on a rating system used in the USA. The nursing home rating score is based on a composite measure of three domains: health inspections, staffing levels, and quality, whereby nursing homes are rated from one to five stars in each of the three domains.
De Boer et al. (2017) assessed quality of care using outcome, structure, and process indicators. The care quality assessment was informed by the factors outlined by Donabedian (2005). The outcome indicators collected were falling incidents during the past 30 days, pressure ulcers, malnutrition, use of psychotropic drugs, and use of physical restraints. The outcome measures used in the study were based on the international prevalence of care problems (de Boer et al. 2017). Structure indicators included information regarding the hours worked per resident per day (HPRD) and the educational level of caregivers. The process indicators were the presence, accessibility, and content of protocols for care delivery.
Chenoweth et al. (2014) used two quality measures: Person-Centred Environment and Care Assessment Tool (PCECAT) (domain 2), measured at the facility level, and Quality of Interactions Schedule (QUIS), measured at the resident level. Resnick et al. (2022) also used the QUIS. Ho et al. (2021) used Dementia Care Mapping (DCM) to measure care quality. DCM is a method of observation in care settings that follows a formal process. The DCM tool is used to measure person-centred dementia care (Alzheimer’s Society 2022). It is used to assess quality improvement and explore experiences of aspects of care, such as mealtimes. Helgesen et al. (2020) used a general quality questionnaire, Quality from the Patient’s Perspective—dementia care (QPP-DC). This was used to gather data from residents’ perspectives about care quality. The questions from the QPP-DC are based on both residents’ perceived reality of care quality and the subjective importance of each of the items, which are centred on the health and well-being support from care staff. QPP-DC was carried out in a face-to-face interview format with residents. The ‘other’ domain mostly contained items from the study by Lepore et al. (2023). This was likely due to the nature of the methodology of the study. Lepore et al. (2023) collated the standard quality measurement data across four European countries, which may explain the variance within the ‘other’ domain.
An outline of the themes from the qualitative dataTo understand how quality care was defined in the literature, the themes extracted from the qualitative papers (n = 2) are presented in Table 3. Sellevold et al. (2013) conducted narrative interviews with 12 dementia healthcare professionals from two different nursing homes. They asked one question: ‘Based on your experience at your workplace, do you have stories illustrating quality care?’ Jakobsen et al. (2019) conducted narrative interviews across two nursing homes with eight relatives of residents living with dementia. They asked one open-ended question, ‘Can you tell me about your experiences with quality care for your relative in this nursing home?’ The data in both qualitative studies were analysed using a phenomenological–hermeneutical approach. The quantitative and qualitative variables are conferred in the discussion.
Table 3 Synthesis of quality care themes from the qualitative research studies
Comments (0)