MR images and definition of diagnosis
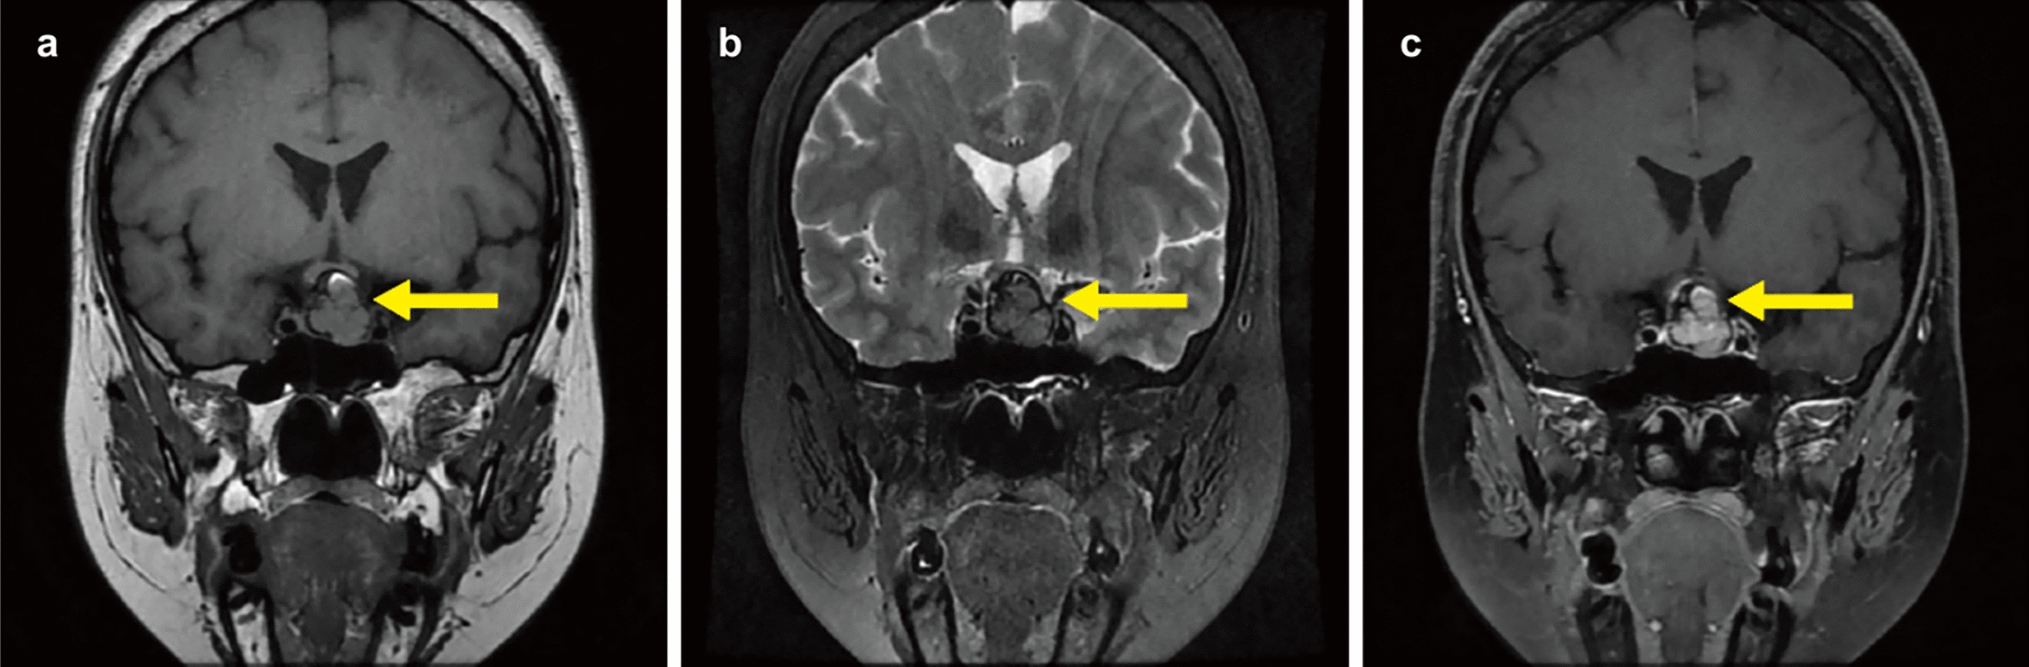
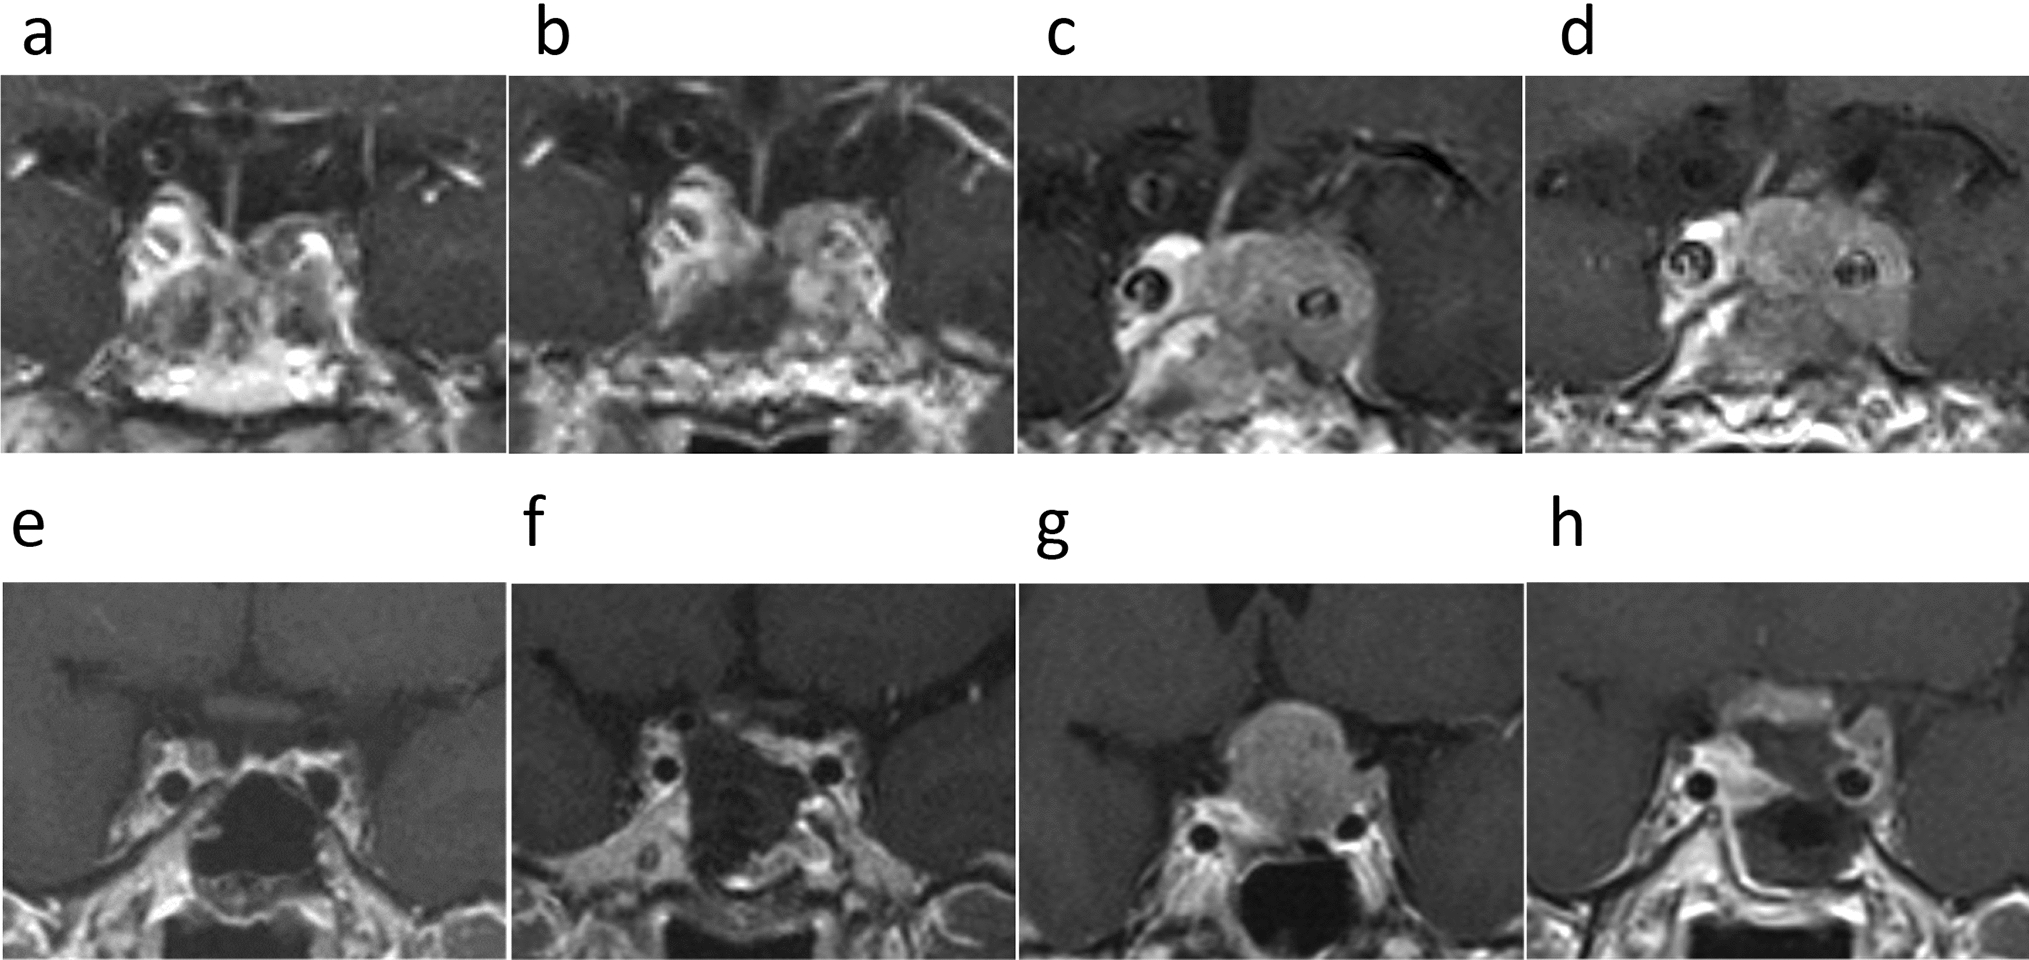
MR images, including cadmium-enhanced T1-weighted, DWI, and arterial spin labeling (ASL) images, were acquired as a part of standard care, before and immediately after surgery, and every three months. These images were acquired using conventional, high-resolution, three-dimensional sequences on a 3.0-T MRI scanner (Signa Excite HDx 3.0 T [GE Healthcare, Little Chalfont, UK] or Philips Ingenia [Philips Healthcare, Best, the Netherlands]). According to the RANO 2.0 criteria [17], patients exhibiting progression of an enhanced lesion in the first 12 weeks after completion of radiotherapy, provided it develops within the radiation field, had a high probability of PsP. However, some studies suggest that PsP can occur during the first 6 months after chemo-radiotherapy [3], extending beyond 12 weeks. In this case of suspected PsP, we performed advanced imaging techniques such as DWI, ASL, and PET imaging. However, a PET study is not covered by national insurance in Japan, and hence, some patients refused to undergo PET because of its cost. To prevent misclassification in this study, the final decision of true progression and PsP was determined through a retrospective review of clinical course, and PsP was diagnosed only upon confirmation of reduction or disappearance of enhanced region during observation periods without any additional treatment (except for temozolomide maintenance therapy for standard care).
Serum and tumor tissue samples
Pooled serum samples collected from the patients with GBM at recurrence (n = 11) and PsP (n = 3) diagnosis. The samples were used for proteomic analysis using data-independent acquisition (DIA) to identify potential biomarkers. The median age of the patients was 66.4 ± 8.6 years. Serum samples for enzyme-linked immunosorbent assay (ELISA) were obtained from 45 patients with GBM (age: 61.2 ± 12.7 years) at the point of appearance of the gadolinium-enhanced lesion after chemo-radiotherapy using MRI. Blood samples were collected in EDTA tubes and stored on ice until further processing. Within 30 min after collection, the samples were centrifuged at 4 °C, 3000 rpm for 5 min, and the supernatant was stored at − 30 °C.
Brain tumor tissues with CNS WHO grade 2 (n = 8), grade 3 (n = 8), and grade 4 (GBM, n = 22) and non-neoplastic brain tissue adjacent to tumors (n = 10) were obtained during neurosurgical resection. Samples were frozen at − 80 °C before use. Tissue samples used for paraffin embedding were immersed in 4% paraformaldehyde. Tumors were classified according to WHO criteria 2021 [1].
Quantitative proteomic analysis
Each sample was measured with a single replicate. Plasma samples were diluted fivefold with 0.1 M Tris–HCl (pH 8.5), and 5 mL of diluted plasma was added to 15 mL of 8 M urea in 0.1 M Tris–HCl (pH 8.5). The proteins were reduced with DTT and alkylated with iodoacetamide. Then, the sample was diluted to 1.2 M urea with 0.1 M Tris–HCl (pH 8.5). The protein was first digested with 0.5 mg lysyl endopeptidase (Fujifilm Wako) for 3 h at 30 °C and subsequently digested with 0.5 mg trypsin for 16 h at 37 °C. The digested peptide was desalted using self-packed StageTips with a CDS Empore SDB-XD sheet (GL Science, Tokyo, Japan), and the peptides were finally eluted with 0.5% formic acid in 50% acetonitrile. After drying, the peptides were reconstituted with 0.1% formic acid in 2% acetonitrile, and peptide concentration was measured using a BCA assay (Thermo Fisher Scientific, Waltham, MA, USA). A digested peptide sample (1 µg peptide) was injected into liquid chromatography–tandem mass spectrometry (MS).
The data acquired using data-dependent acquisition (DDA) for protein identification and spectral library generation and DIA/SWATH modes for protein quantification on a TripleTOF6600 (SCIEX, Framingham, MA, USA) coincided with those obtained using the Eksigent NanoLC400 system (SCIEX). The injected sample was loaded on a trap column (L-column ODS, 5 mm length × 0.3 mm ID, CERI, Tokyo, Japan) and separated in a self-packed emitter column (150 mm length × 75 mm ID) packed with ReproSil C18 (3 μm, Dr. Maisch, Ammerbuch, Germany). The mobile phases comprised (A) 0.1% formic acid in water and (B) 0.1% formic acid in acetonitrile. A linear gradient of 2–35% B for 120 min was employed for both DDA and DIA. For DDA, precursor ions were scanned from 400 to 1250 with an accumulation time of 250 ms, and product ions were scanned from 100 to 1600 with an accumulation time of 50 ms using rolling collision energy. The maximum number of candidate precursor ions for monitoring product ions was 30 ions/cycle, and analyzed ions were excluded for 15 s. For DIA, precursor ions were scanned from 400 to 1250 with an accumulation time of 50 ms, and product ions were scanned from 100 to 1600 with 100 variable isolation windows with rolling collision energy. The cycle time was 3.10 s.
Proteins were identified using ProteinPilot v.5 (SCIEX) with MS data from DDA and UniProt Human reference proteome data with default settings. The data identified from ProteinPilot were imported into PeakView (SCIEX), and a spectral library was generated to analyze the DIA data. DIA-NN version 1.8 was used to analyze the peaks of the peptides with DIA data [18] with default settings using a spectral library constructed as described above. Identified proteins and precursors were filtered by less than 1% FDR. Cross-run normalization was performed using the RT-dependent method built into DIA-NN.
Article selection and literature review
Two authors (S.T. and R.N.) conducted a systematic literature search for articles on the relationship between glioma and the candidate proteins in the PubMed database. Information was extracted from the titles and abstracts to determine whether the articles reported on the relationship between the candidate proteins and glioma. Candidate proteins were listed in an Excel file for further analysis. The review was performed according to Preferred Reporting Items for Systematic Reviews and Meta-Analyses (PRISMA).
ELISA
Serum ATXN2 levels were quantified using competitive ELISA (Human Ataxin 2 ELISA Kit; MyBioSource, San Diego, CA, USA). Serum samples were diluted (1:10) in phosphate-buffered saline (PBS) (pH 7.0–7.2), and 100 µL/well of the samples and appropriate standards were added to a 96-well plate. An equal volume of PBS was used as the blank control. A conjugate solution (50 µL) was added to each well (excluding the blank control). The plates were then incubated for 1 h at 37 °C. Thereafter, the plate was washed five times with a wash solution (350 µL/well/wash). Subsequently, the liquid from each well was removed, and 50 µL of substrates A and B were added to each well, including the blank control. The plate was covered and incubated for 15 min at 37 °C. Next, 50 µL of the stop solution was added to each well, including the blank control. The absorbance was immediately determined at 450 nm using a microplate reader. The absolute concentration of the protein was calculated from the standard curve.
Western blot analysis
The tissue samples were lysed in a radioimmunoprecipitation assay buffer (Fujifilm, Osaka, Japan) containing protease and phosphatase inhibitors (Sigma-Aldrich, St. Louis, MO, USA) and incubated at 4 °C for 20 min. Following sonication on ice twice, samples were centrifuged for 10 min at 14,000 rpm and 4 °C. The protein concentration was calculated using a bicinchoninic acid protein assay kit (Thermo Fisher Scientific). Western blot analysis was performed as previously described [19]. Proteins from GBM cell lines were extracted using the same procedures. The following antibodies were used: anti-ATXN2 (GTX130329, 1:3000; Gene Tex, Irvine, CA, USA), anti-p-ERK (4370S, 1:3000; Cell Signaling Technology, Danvers, MA, USA), anti-ERK (4695S, 1:3000; Cell Signaling Technology), anti-AKT (9272S, 1:1000; Cell Signaling Technology), anti-p-AKT (4058S, 1:1000; Cell Signaling Technology), anti-mTOR (2983S, 1:1000; Cell Signaling Technology), anti-p-mTOR (2971S, 1:1000; Cell Signaling Technology), anti-STAT3 (12640S, 1:1000; Cell Signaling Technology), and anti-p-STAT3 (9134S, 1:1000; Cell Signaling Technology). β-actin was used as a loading control and for calculating the relative density values.
Cell culture
Three human GBM cell lines—U87, U251, and T98G—were used. The cells were purchased from the European Collection of Authenticated Cell Cultures. The cells were maintained in Dulbecco’s modified Eagle’s medium (DMEM) supplemented with 10% heat-inactivated fetal bovine serum (FBS) at 37 °C in an incubator comprising 5% CO2.
Immunohistochemistry and immunocytochemistry
For immunohistochemistry, 4-µm-thick, paraffin-embedded surgical specimen slices were deparaffinized and autoclaved in target retrieval solution (pH 6.0) at 120 °C for 10 min, treated with 3% hydrogen peroxide in methanol for 30 min, and blocked with 5% skimmed milk for 1 h. The slides were incubated with primary antibodies (1:300 dilution, anti-ATXN2 GTX130329; GeneTex) and immunostained using an Envision + kit (K4003, Dako, Agilent Technologies, Santa Clara, CA, USA). The stained sections were visualized using a 3,3ʹ-diaminobenzidine tetrahydrochloride solution for 5 min.
For immunocytochemistry, cells seeded onto circular glass coverslips with a 24-mm diameter at 80% confluence were fixed in 4% paraformaldehyde (168–20,955, Wako Pure Chemicals, Osaka, Japan) for 20 min at 4 °C, washed with PBS twice, and blocked in 5% skimmed milk for 60 min at room temperature (18–25 °C). The cells were treated with anti-ATXN2 (GTX130329; GeneTex) diluted 1:150 in a pre-dilution solution (S3022, Dako, Agilent Technologies) as the primary antibody and covered with a coverslip and incubated in a humidified chamber overnight. The slides were then washed with PBS and incubated for 60 min in a humidified chamber at room temperature with the Alexa Fluor 546-conjugated secondary antibody (1:1000 dilution, A-11035, Thermo Fisher Scientific). The cells were counterstained with a DAPI-containing mounting medium (UltraCruz® Aqueous Mounting Medium with DAPI: sc-24941, Dallas, TX, USA).
ATXN2 gene silencing using small interfering RNA (siRNA)
To silence the target proteins, we used two different sequences of siRNAs targeting ATXN2 and a negative control (Qiagen, Germantown, MD, USA). The target sequence 1 of human ATXN2 (siATXN2-5, SI04192566, Qiagen) was 5ʹ-AAGACGCAGCTGAGCAAGTTA-3ʹ, and the target sequence 2 of human ATXN2 (siATXN2-6, S04292841, Qiagen) was 5ʹ-AGAGGTCGAAACAGTAACAAA-3ʹ. All cells were seeded in flat-bottomed culture plates at a density of 1.5 × 10⁵ cells per well in 2 mL of 10% FBS P/S. After 24 h, the medium was replaced with an all-free medium. U87, U251, and T98G cell lines were transfected with ATXN2-targeting and control siRNAs using Avalanche Omni (EZ Biosystems, College Park, MD, USA), following the manufacturer’s protocol. The final siRNA concentration was 25 nM. Cells were incubated for 48 h after transfection and used for subsequent experiments.
Cell proliferation assay
To assess the proliferation of GBM cells (1 × 10³) treated with siRNA, the cells were passaged into a 96-well plate with 200 µL of culture medium containing 0.5% FBS. After incubating at 37 °C for 4 h, 20 µL of Alamar blue (Biosource, Camarillo, CA, USA) was added to each well. The plates were read using a microplate reader at 0, 24, 48, 72, and 96 h. The average fluorescence values from six wells were calculated and plotted.
Cell migration and invasion assays
To investigate the effect of ATXN2 on glioma cell motility, we performed a migration assay using an uncoated Transwell chamber (6.5 mm diameter, 8 μm pore size). The chambers were pre-incubated in DMEM at 37 °C for 2 h. Glioma cells (1.0 × 10⁵ cells) were added to the upper chamber containing FBS-free DMEM. The Transwell chamber containing cells was incubated in DMEM with 10% FBS for 6 h. The cells that migrated to the lower surface of the chamber were fixed with methanol and stained using the Diff-Quik kit (Sysmex, Co. Ltd., Kobe, Japan). The numbers of invading and migrating cells in five microscopic fields were randomly selected and counted.
The invasion activity was assessed using a Matrigel pre-coated invasion Transwell chamber (6.5 mm diameter, 8 μm pore size; Corning, Bedford, MA, USA). After 2 h of pre-incubation in DMEM at 37 °C, 1.5 × 10⁵ GBM cells were resuspended in DMEM without FBS, and penicillin–streptomycin was added to each well. The Transwell chamber was placed in a 24-well plate (Corning), and DMEM containing 10% FBS was added. After 12 h of incubation, non-invasive cells on the upper surface of the filter were removed, and invasive cells on the lower surface were fixed with methanol and stained using a Diff-Quik kit.
Statistical analysis
Parametric and paired t-tests were used to compare serum ATXN2 levels between the groups. The patients with recurrence were classified into two groups based on the lower and higher expression. Statistical significance for migration, invasion, and proliferation assays was calculated using Dunnett’s tests. We used non-parametric methods since the data did not follow a normal distribution. Multiple logistic regression analyses were performed and receiver operating characteristic (ROC) curves were constructed to investigate the association between serum ATXN2 and disease status. All statistical analyses were performed using GraphPad Prism software version 9.1.2 (MDF Co., Tokyo, Japan) and the JMP Pro statistical analysis software Pro version 16.2.0 (SAS Institute Japan Inc., Tokyo, Japan).


Comments (0)