
Remember me
This retrospective cohort study utilized 100% fee-for-service Medicare claims from 2017 to 2019, the latest available to us at the time of this analysis. Rather than use limited data set files, we procured research identifiable files (RIFs), the latter of which contain information on medications. The database consisted of outpatient, inpatient, skilled nursing facility, home health, sociodemographic, enrollment, functional status, and prescription drug adjudicated claims, that is, costs paid by Medicare.
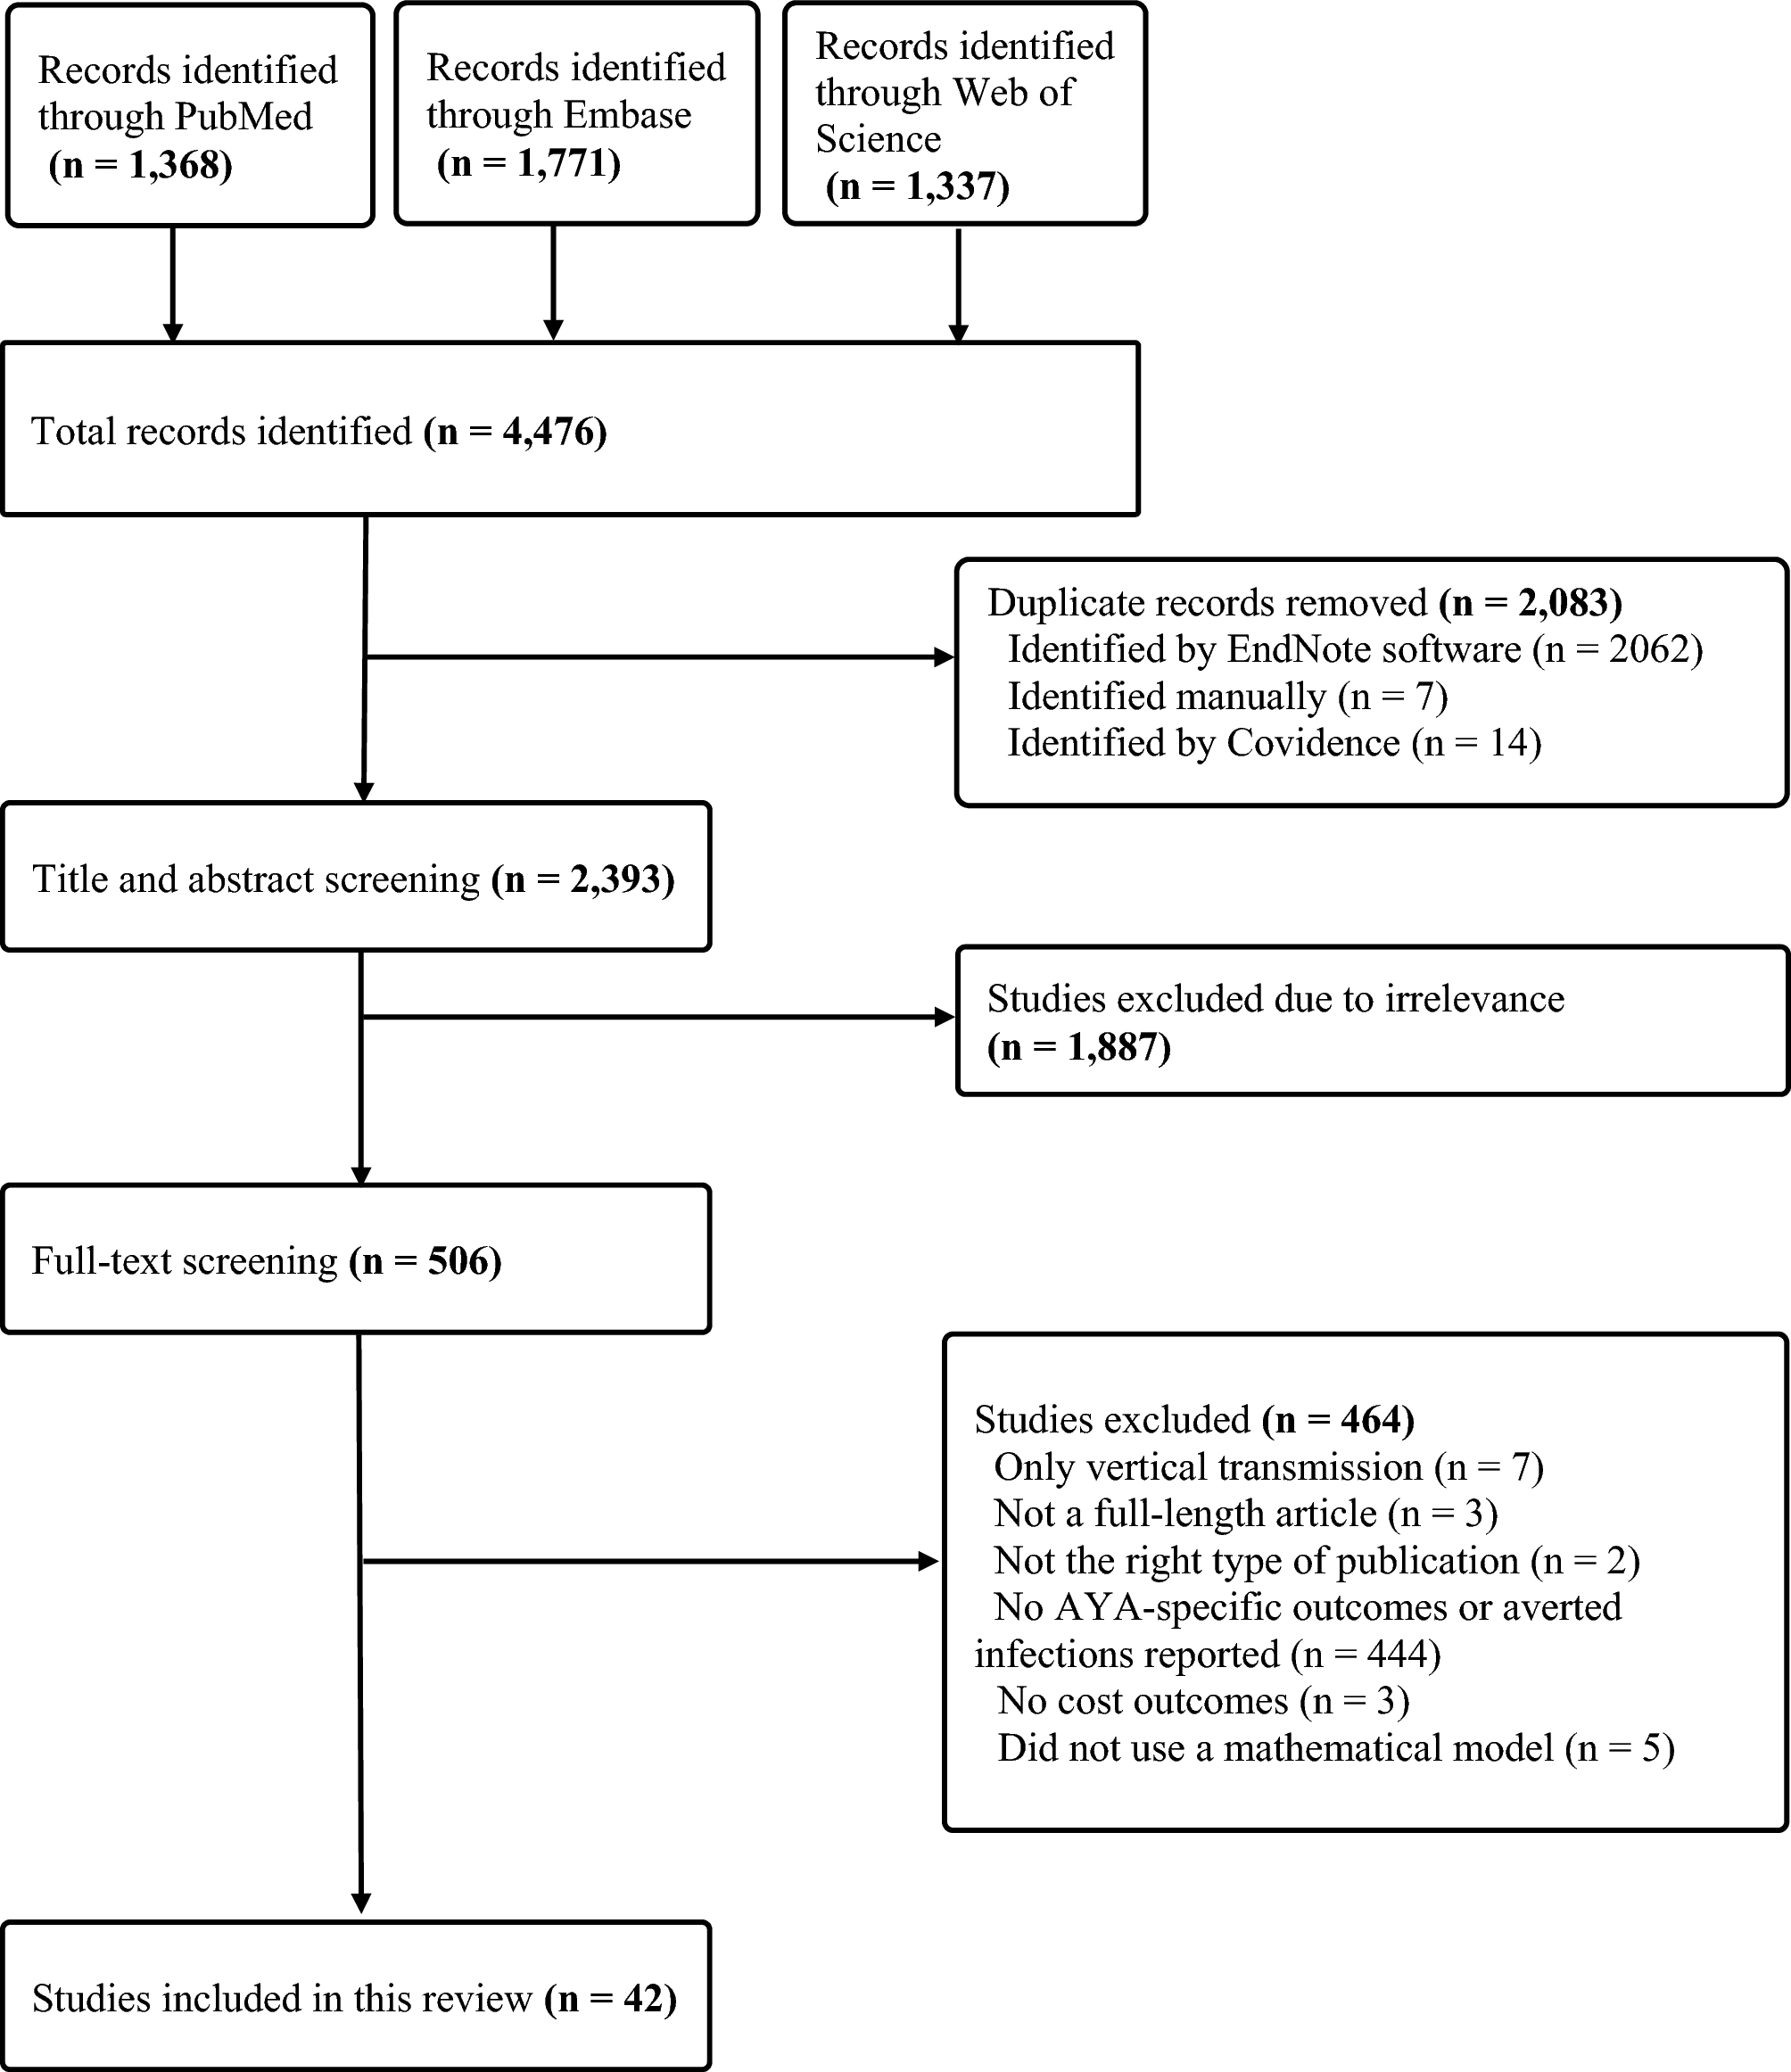
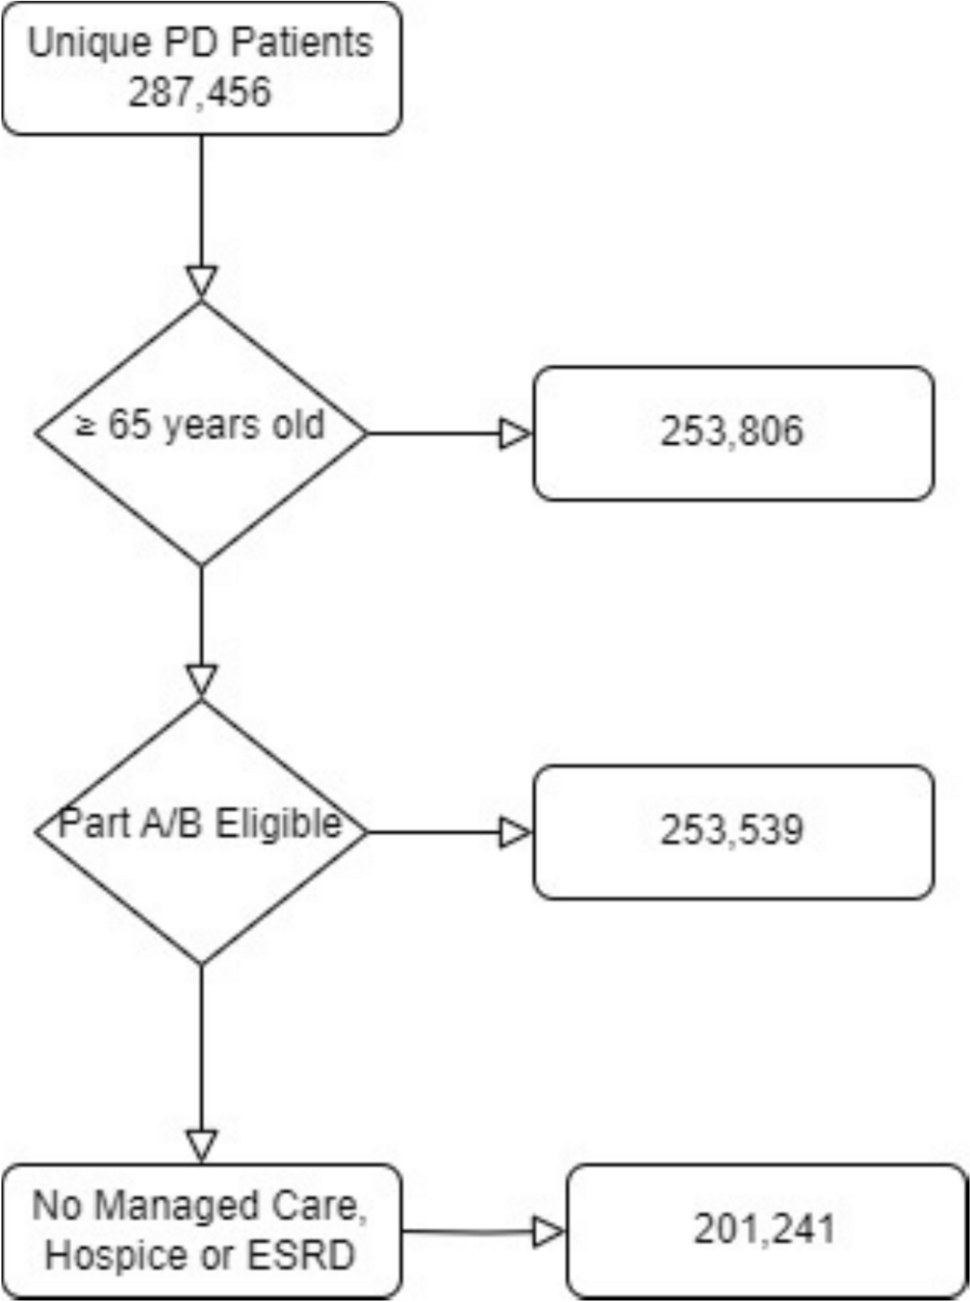
2.2 Analysis PopulationThis was a prevalent population in that it contained data on patients who were previously on therapy, as well as new starts. Specific eligibility criteria were defined to identify the appropriate patient population for the analysis. The study population consisted of adult patients aged 65–90 years with a diagnosis of PD (International Classification of Diseases [ICD]-10 code G20.X) who were prescribed at least one levodopa-containing medication in at least 1 year (2017, 2018, or 2019), were eligible for both Medicare Parts A and B, and were continuously enrolled in Medicare from 2017–2019 (Fig. 1). Dual eligibles were not part of the sample. Using specific PD medications, as well as at least one diagnosis claim for PD maximizes the probability that these are true patients with PD [9, 15, 16]. Patients were segmented according to the type of levodopa-containing medication (primary treatment regimen) that appeared in their first instance in the database: immediate release (IR), immediate-release + controlled release (IR + CR), controlled release (CR) alone, or extended release (ER) levodopa–carbidopa. Baseline was defined as claims up to 1 year prior to the initiation of levodopa medication. Patients were followed from their first PD diagnosis and until they were no longer seen in the database for any reason (i.e., death, lost to follow-up, discharge). Patients were excluded from the study cohort if they had secondary Parkinsonism (ICD-10 code G21.X), were enrolled in a managed-care organization, or had incomplete data.
Fig. 1 2.3 Outcomes
The primary endpoints of this study described healthcare resource utilization (emergency room visits, number and length of stay of hospitalizations, outpatient services, office visits, and residing in skilled nursing or assisted living facilities) and costs (total and by care setting) associated with levodopa-based therapy use from 2017 to 2019. Patterns examined included the percentage of patients receiving each type of formulation of levodopa-containing medication, primary treatment regimen (at first PD medication claim), switch history between primary and other levodopa-containing medications (percent of each levodopa-containing treatment regimen and time to switch), average daily dose for each type of levodopa-based regimen, average treatment duration, and persistence rates. The mean daily dose was calculated over the entire period of available claims for the primary levodopa therapy. The average treatment duration was determined by subtracting the date of the first-ever claim for the primary levodopa medication from the date of the last primary levodopa claim for that medication. Persistence was determined using proportion of days covered (PDC), which was calculated by the total number of days covered by refills in a measurement period divided by the number of days between the first fill and the end of the measurement period.
The secondary endpoint was the rate of use of concomitant medications (dopamine agonists, catechol-O-methyl transferase [COMT] inhibitors, anticholinergics, monoamine oxidase-B [MAO-B] inhibitors, or adenosine A2A antagonists). Medications were considered concomitant if there was a claim within 30 days of levodopa initiation on either side of the first levodopa claim, that is, 30 days before or after the first levodopa medication claim. We used a standardized follow-up period of 3 years for assessing healthcare resource utilization after the index date (initiation of levodopa-containing medication) to ensure that all patients were evaluated over the same time frame, regardless of when they initiated treatment within the 3-year study period. To account for deaths or patients lost to follow-up before the measurement period ended, we censored patients at the date of their last known activity in the database.
Because more advanced patients have greater dopaminergic neuronal loss and therefore require greater dopamine supplementation, levodopa equivalent daily dose (LEDD) was used to estimate the dopamine replacement combining various Parkinson’s medications [17,18,19,20,21]. Outcomes were stratified by both primary (levodopa-containing) regimen and LEDD, the latter of which served as a proxy for disease severity.
2.4 Statistical AnalysisAn intention-to-treat (ITT) strategy was used in the overall evaluation, examining appropriate subgroups according to duration of therapy, comorbidities, and concomitant medications, to minimize selection bias, thereby maintaining the integrity of the original treatment assignment or initial clinical decision. By analyzing all patients according to their initial treatment assignment, ITT minimizes bias for those who switched therapies to avoid artificially inflating treatment efficacy, better reflects real-world effectiveness, and reduces subjective categorization of treatment strategies. The disadvantages of employing an ITT strategy include risk of misclassification of patient treatment groups, possible underestimation of treatment effect, and unmeasured confounders [22]. All analyses were first performed provisionally using logistic regression and then, to account for patients who may have died during the period of follow-up or may have been lost to follow-up, the final analyses were performed using Cox proportional hazards regression.
Descriptive statistics (mean, standard deviation, median, and interquartile range [IQR] for continuous variables; frequency distributions for categorical variables) were used to summarize baseline patient demographics and clinical characteristics. Appropriate statistical tests based on data distribution were performed to examine any differences among subgroups of interest, including age, sex, race/ethnicity, insurance type, comorbid conditions, time on therapy from diagnosis, prior therapies before primary therapy for those in whom treatment was initiated in 2017, and duration of therapy. We first attempted to use propensity score matching to balance the treatment groups due to lack of randomization of assigned treatments using readily available demographic data (age, sex, race) or calculable data (Charlson Comorbidity Score). However, it proved very difficult to balance the treatment groups using multiple matching ratio (e.g., 1:1, 1:2, 1:4, etc.) attempts with this method. Thus, inverse probability of treatment weighting (IPTW) was successfully used as a covariate to adjust for this potential bias inherent in retrospective database analyses and to approximate average treatment effect [23, 24]. IPTW was particularly useful since we had more than two treatment groups to balance. Specifically, model treatment assignment was accomplished using logistic regression including the baseline covariates of demographics (age, sex, race, region), comorbidities, prior healthcare utilization (hospitalizations, outpatient visits), medication history, and socioeconomic factors. Stabilized weights using marginal treatment probabilities were employed to prevent extreme values. To balance diagnostics, we set the standardized mean differences to < 0.1 for all covariates and variance ratios between 0.8 and 1.2 for continuous variables. Additional checks included Kolmogorov–Smirnov tests for distributional equivalence, interaction term analysis in weighted outcome models, and negative control outcomes to detect residual confounding. Weight management included trimming weights at 1st/99th percentiles and assessing weight distribution through effective sample size calculations, weighted versus unweighted cohort characteristics, and sensitivity analyses with alternative truncation thresholds. Lastly, we censored weights for dropout and non-persistence.
LEDD was also used to balance treatment groups and as a proxy for disease severity. To employ LEDD, we first used frequency analysis to understand the datasets and patient distributions. The LEDD [17,18,19,20,21]—or more specifically the 120-day mean daily LEDD—was defined as the mean of the total daily LEDD, calculated over the 120-day post-levodopa initiation period. We varied the LEDD grouping limits multiple times, using Kolmogorov–Smirnov, Cramer–von Mises, and Anderson–Darling tests for normality, until the mean daily LEDD was similar for each grouping. We thus arrived at final LEDD groupings of 150–350 mg as a proxy for mild PD; 351–600 mg for more advanced PD; 601–900 mg for even more advanced PD; and > 900 mg for severe PD.
All data were analyzed using SAS statistical software (version 9.4, SAS Institute, Cary, North Carolina, USA). Statistical significance was set at p < 0.05.
Comments (0)