Datasets and study design
This cross-sectional study used secondary data from the 2016 Nepal Demographic and Health Surveys (2016 NDHS) [19], which included both blood pressure measurements and information needed to calculate the SWPER index [16]. The 2016 NDHS was executed by New ERA under the Ministry of Health of Nepal, with funding from the United States Agency for International Development (USAID) and technical assistance from ICF through The DHS Program, a USAID-funded project. The dataset, anonymized to protect privacy, were accessed from the DHS website [20] after submitting a research proposal, as per their guidelines.
The sampling frame for the 2016 NDHS was an updated version from the 2011 National Population and Housing Census (NPHC), provided by the Central Bureau of Statistics (CBS) [19]. This sampling frame provides details on ward location, residence type (urban or rural), projected number of residential households, and estimated population. The 2016 NDHS employed a two-stage selection process in rural areas and a three-stage process in urban areas. Rural wards were selected as primary sampling units (PSUs), followed by the selection of households from these PSUs. In urban areas, wards served as PSUs, one EA (enumeration area) was selected from each PSU, and households were chosen from these EAs. During the first stage, 383 wards were selected, with the probability of selection proportional to ward size, which is determined by the number of residential households. For large urban wards, a second stage involved randomly selecting one EA from each sample ward. A household listing operation was performed in all selected sampling clusters (rural wards or urban EAs), creating a list that served as the sampling frame for household selection in the subsequent stage. To reduce the task of household listing in clusters containing more than 200 households, such clusters were segmented, and only one segment was chosen for the survey, with the probability proportional to segment size. Finally, 30 households per cluster were selected systematically, with an equal chance of selection from the newly created household list. Further details of the sampling process is given in the DHS report [19]. Survey interviews were conducted exclusively in pre-selected households, and to avoid bias, no replacements or alterations were permitted. All women aged 15–49 who were permanent residents of the selected households were eligible for interviews, and for blood pressure measurements, with a response rate of 98% [19]. This analysis, however, is limited to currently married women who also had measured blood pressure data and the necessary information to calculate the SWPER index (38% of all eligible women).
The 2016 NDHS received ethical approval from the Nepal Research Council and the ICF Macro Institutional Review Board located in Calverton, Maryland, USA. Before proceeding with the interview, each participant gave their informed written consent [19].
The survey-based women emPowERment (SWPER) index
The Survey-based Women emPowERment (SWPER) index was created through a method that employed key questions relating to women’s empowerment from Demographic and Health Surveys (DHS) [15, 16]. Higher scores were allotted to those responses that signified a higher level of empowerment (refer to Supplementary Table S1—for details about the questions and their corresponding scores). We limited the scope of the analysis to women in partnerships, given the nature of specific questions. For women without childbirth history, we used single hot-deck imputation method to infer the age of first birth [16].
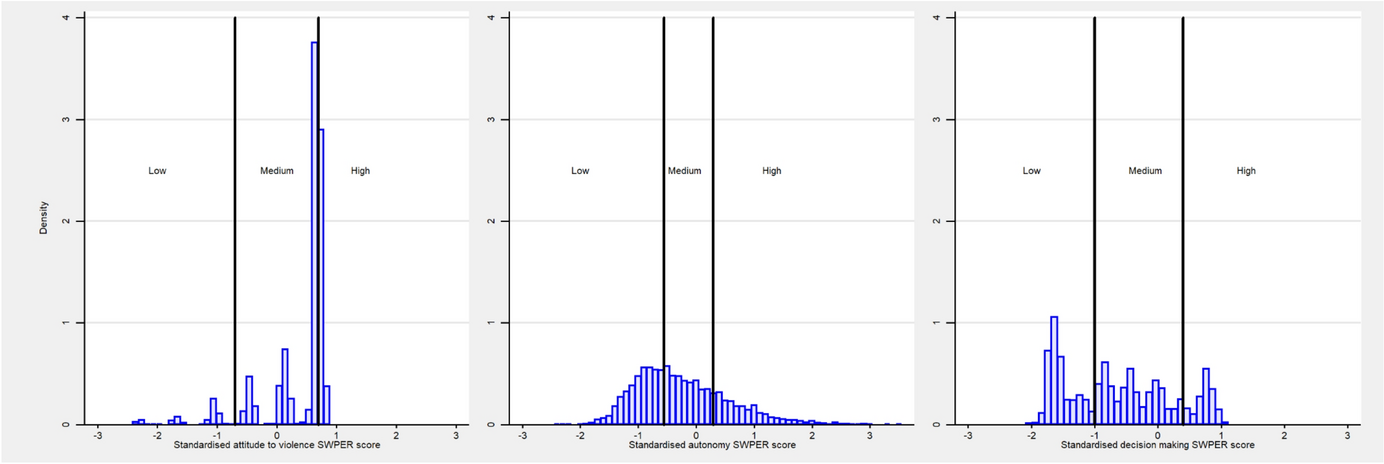
The SWPER index encapsulates three primary domains: ‘attitude towards violence’, ‘social independence’, and ‘decision-making’. The first domain explores women’s attitudes towards the justification of domestic violence in different situations. The second domain, ‘social independence’, assesses a range of factors including a woman’s education, frequency of media interactions such as reading newspapers or magazines, and the age of major life events, like the first childbirth and cohabitation. The disparities in age and education between partners are also considered in this domain, albeit with lower weightings. The third domain, ‘decision-making’, evaluates the extent of a woman’s involvement in key household decisions, serving as a reflection of her autonomy within the home [15, 16].
To formulate the SWPER index, we applied a principal component analysis (PCA) on these 14 elements. Each item was then weighted to reflect its unique contribution to the total empowerment score. To maintain global relevance and comparability, we standardized the scores based on the global mean for LMICs and the standard deviation from a previous study [16]. These standardized scores were then divided into three categories—low, medium, and high levels of empowerment, guided by the standard cut-off points suggested by previous research that roughly splits global scores into tertiles [16].
Outcome variables
We explored three aspects of hypertension: prevalence, awareness among those diagnosed with hypertension, and treatment rates among those aware of their hypertensive status. Blood pressure readings were taken three times from consenting women aged 15 and above, using UA-767F/FAC (A&D Medical) blood pressure monitors, with an interval of 5 min or more between each reading. The average of the last two readings, for both systolic and diastolic pressures, was used to determine hypertension. According to the guidelines set by WHO and the International Society of Hypertension [21], a respondent was defined as hypertensive if they had an average systolic blood pressure of 140 mmHg or more, OR an average diastolic blood pressure of 90 mmHg or more. Furthermore, respondents who reported that they were currently using any antihypertensive medication were also classified as hypertensive.
The term ‘awareness of hypertension’ was defined as those who had been previously diagnosed by a healthcare professional. This was confirmed by asking if they had ever been informed about having high blood pressure or hypertension by a doctor or other healthcare worker. As for the treatment of hypertension, any respondent classified as hypertensive and reported taking antihypertensive medication on the day of the survey was classified as ‘treated’.
Covariates
We included various sociodemographic characteristics in this study, including survey year, age, place of residence, administrative province (Koshi, Madhesh, Bagmati, Gandaki, Lumbini, Karnali, Sudurpashchim), highest educational level of women and household wealth index. Age was categorized into 15–29 years, 30–39 years, and 40–49 years. The definitions of rural and urban residences were guided by country-specific parameters. The socioeconomic status (SES) of the household was derived from the 2016 NDHS household wealth index, which was calculated using principal components analysis based on quantity and variety of consumer goods they own and their housing characteristics, such as source of drinking water, toilet facilities, and flooring materials. We then assigned wealth index values to each household member and divided the population into national wealth quintiles, each containing 20% of the population, from poorest (Q1) to richest (Q5) [19].
Statistical analysis
All analyses were performed in accordance with the DHS guide to analysis [22], utilizing Stata v16.1 software and taking into account the complex survey design with Stata’s “svy” command. We used descriptive statistics to estimate proportions for categorical variables and means and standard deviations for continuous variables in our sample. Chi-square tests was used to investigate the bivariate relationships between Women empowerment status, sociodemographic characteristics, and hypertension variables. Furthermore, we estimated the prevalence, awareness, and treatment of hypertension based on various sociodemographic factors and SWPER domains.
We utilised multiple logistic regressions to investigate the associations of the three SWPER domains with hypertension prevalence, awareness, and treatment. The adjusted odds ratios (aORs) with 95% confidence intervals (CIs) were estimated, with all covariates simultaneously entered into the multiple regression model.
We considered an alpha level (α) of 0.05 as the cut-off for statistical significance and all statistical tests were two-sided.

Comments (0)