
Remember me

Considered in these analyses were 4342 participants to the Cooperative Health Research in South Tyrol (CHRIS) study, with complete genotype and electrocardiographic data included in the second CHRIS data release on participants recruited between 2011 and 2014. Briefly, the CHRIS study is a population-based cohort study being conducted since 2011 in the Val Venosta/Vinschgau district (South Tyrol, Italy) (Pattaro et al. 2015; Noce et al. 2017). Data include socio-demographic, health, and lifestyle information collected through questionnaires-based interviews and quantitative traits assessed through clinical examinations and urine and blood sampling under overnight fasting conditions.
Replication of genetic associations was tested in MICROS and SHIP. The Microisolates in South Tyrol (MICROS) study (Pattaro et al. 2007) was a cross-sectional, population-based study conducted in three Alpine villages of the same Val Venosta/Vinschgau district where also the discovery CHRIS study was conducted. Considered for replication were 636 individuals who did not participate to the CHRIS study, to guarantee sample independence.
The Study of Health in Pomerania (SHIP-TREND) is a longitudinal population-based cohort study in West Pomerania, a region in the northeast of Germany, assessing the prevalence and incidence of common population-relevant diseases and their risk factors. Baseline examinations for SHIP-TREND were carried out between 2008 and 2012, comprising 4,420 participants aged 20 to 81 years. Study design and sampling methods were previously described (Völzke et al. 2022).
Study outcomes and exclusionsPrimary outcomes were the duration of the P-wave, PR, QRS and QT intervals, reflecting atrial and ventricular depolarization and repolarization. We obtained data from 10 s ECGs performed using standard 12-lead ECG workstations: PC-ECG-System Custo 200– Customed (CHRIS); Mortara Portrait, Mortara Inc., Milwaukee, USA (MICROS); Personal 120LD, Esaote, Genova, Italy (SHIP-START and SHIP-TREND). In all studies, participants were asked to remain silent and in supine position during the procedure. Participants with history of atrial fibrillation, myocardial infarction, heart failure, Wolff-Parkinson-White syndrome, assuming class I and III antiarrhythmics and/or digoxin, pacemaker carriers, and pregnant women, were excluded from the analyses as detailed in Online Resource 1 (Table S1). Values of ECG traits outside the range (1st quartile– 3*interquartile range) and (3rd quartile + 3*interquartile range) were further removed. Between-trait pairwise correlations were estimated by the Pearson’s correlation coefficient.
GenotypingCHRIS and MICROS DNA samples were genotyped using the Illumina HumanOmniExpressExome Bead array. Genotyped SNPs were retained if they had call rate > 99%, Hardy Weinberg Equilibrium (HWE) P-value ≥ 3 × 10⁻⁸, and minor allele frequency ≥ 0.01. Samples with evidence of sex mismatch, duplication and labelled as outliers after principal component analysis were removed. Data were imputed against the 1000 Genome Phase 1 dataset (1000G.Ph1) using ShapeIT2 and Minimac3 (Das et al. 2016), on GRCh37 assembly.
In SHIP-START, DNA samples were genotyped on the Affymetrix Genome-Wide Human SNP Array 6.0. Excluded were samples with call rate < 86% and SNPs with position mapping issues, HWE P-value ≤ 0.0001, call rate ≤ 0.8, or monomorphic. In SHIP-TREND, DNA samples were genotyped on the Illumina Human Omni 2.5 array. Excluded were samples with call rate < 94% and SNPs with position mapping issues, HWE P-value ≤ 0.0001, call rate ≤ 0.9 or monomorphic. Samples were excluded from both SHIP-START and SHIP-TREND in case of duplication or sex mismatch. Both studies imputed their genotypes with IMPUTE v2.2.2 (Howie et al. 2009) against 1000G.Ph1 (interim).
Genetic association analysis in the CHRIS studyIn the CHRIS genomic dataset, we selected the regions encompassing linkage disequilibrium (LD) blocks originating inside the desmosomal genes DSP, PKP2, DGS2, DSC2, and JUP, and extending outside the gene boundaries. LD-blocks were defined based on the D' confidence intervals (Zapata et al. 1997) and identified applying LDExplorer to the 1000G.Ph3 European-ancestry panel (Taliun et al. 2014).
Association between dosage levels and ECG traits was tested using a genome-wide association study-like approach based on EMMAX as implemented in EPACTS v3.2.6 (Kang et al. 2010), adjusting for age and sex, assuming a genetic additive model, and accounting for relatedness, estimated on the genotyped autosomal variants. The statistical significance level was set at 2.6 × 10⁻⁴, corresponding to the ratio between the genome-wide significance level of 5 × 10⁻⁸ to the fraction of genome tested (the LD regions around the 5 desmosomal genes covered approximately 3000 megabases; Table 2). Significantly associated variants were re-tested using appropriate linear mixed model fitting through lmekin function implemented in the R package ‘coxme’ v2.2.5: models included fixed effects for age and sex, and random effect for the day of recruitment, to remove potential long-term recruitment effects (Noce et al. 2017). Relatedness was modeled as in EMMAX within the variance-covariance matrix.
We performed two sensitivity analyses: additionally adjusting for RR interval and BMI; and applying the rank-based inverse normal transformation to the ECG traits. Regional association plots were generated with LocusZoom v0.4.8 (Pruim et al. 2010). Full results of EMMAX analyses and scripts are provided in Online Resource 3 (Datasets S1-S12) and Online Resource 4.
Replication testingDirection-consistent replication was tested, based on the same genetic model, in the MICROS study by fitting linear mixed models adjusted for age, sex, village, and relatedness, using the lmekin function as above, and in SHIP-START and SHIP-TREND by fitting a simple linear models adjusted for age and sex. The Bonferroni-corrected significance level for replication was set to 0.017 (0.05 over 3 variants tested for replication).
Functional, molecular, and clinical annotationAssociated SNPs were annotated using the Ensembl Variant Effect Predictor tool available in Ensembl GRCh37 (http://www.ensembl.org/Tools/VEP), the UCSC genome browser (genome.ucsc.edu), and the SCREEN Encode tool (https://screen.encodeproject.org/) (GRCh37). LD of the CHRIS sample was estimated using LocusZoom v0.4.8 (Pruim et al. 2010), using the–vcf option.
We checked whether the associated variants were associated with other traits at the genome-wide significance level of 5 × 10⁻⁸, including diseases, DNA methylation levels, gene expression, and protein levels, interrogating the PhenoScanner v2 (last accessed on 13/02/2024) (Kamat et al. 2019), the Genotype-Tissue Expression GTEx Project database v8 (GTEx Consortium 2020), and the methylation mQTLdb database (Gaunt et al. 2016).
DNA methylation analysesWe accumulated genomic association with DNA methylation sites from the Framingham Heart Study (FHS), SHIP-TREND, and the Kooperative Gesundheitsforschung in der Region Augsburg (KORA) FF4 study.
All details regarding sample preparation, methylation analyses and data analyses are described in the Online Resource 4. Prior to MR, we performed a fixed-effects meta-analysis of the association between rs2076298 and cg02643433 in the three above mentioned studies using the command metan implemented in Stata 18 (details in Online Resource 2, Figure S5).
Mendelian randomization (MR) analysesWe conducted two-sample MR analyses selecting SNPs as instrumental variables (IV) and retrieving summary statistics of association from published GWAS (GTEx Consortium 2020; Gaunt et al. 2016) and from the current analysis in CHRIS. To satisfy the assumption of relevance, we selected genetic variants associated with the exposure at genome-wide significance level (p < 5 × 10⁻⁸) with F statistic > 10. To ensure IVs independency, we selected variants with LD r2 < 0.01. LD was estimated using the Ensemble LD Calculator using the 1000G.Ph3 European ancestry panel as reference (https://www.ensembl.org/Homo_sapiens/Tools/LD).
For each exposure, we could identify only one single SNP satisfying the MR assumptions for use as IV. To exclude the presence of pleiotropy, and hence verifying the exclusion restriction assumption, we inspected available biological evidence from the literature. Following effect allele and direction harmonization between exposures and outcomes, MR estimates were computed as the Wald ratio estimate, with the standard error derived via delta method approximation, using the R package ‘MendelianRandomization’ v0.9.0 (Patel et al. 2023). Because we were interested in dissecting two alternative pathways, significance level was set at 0.05/2 = 0.025. MR scripts and data are provided in Online Resource 4 and Online Resource (Dataset S15).
Statistical colocalization analysesWe performed statistical colocalization analysis (Giambartolomei et al. 2014) of DSP-AS1 expression in left ventricle with DSP expression in the same tissue and with QRS duration (Fig. 3, pathways E, F), using the coloc package v 5.1.0 implemented in R. The data used for the analyses described in this manuscript were obtained from the GTEx Portal on 11/15/24. All analyses were conducted within ± 100 kb from rs2076298, which was selected as instrumental variable in the MR analysis.
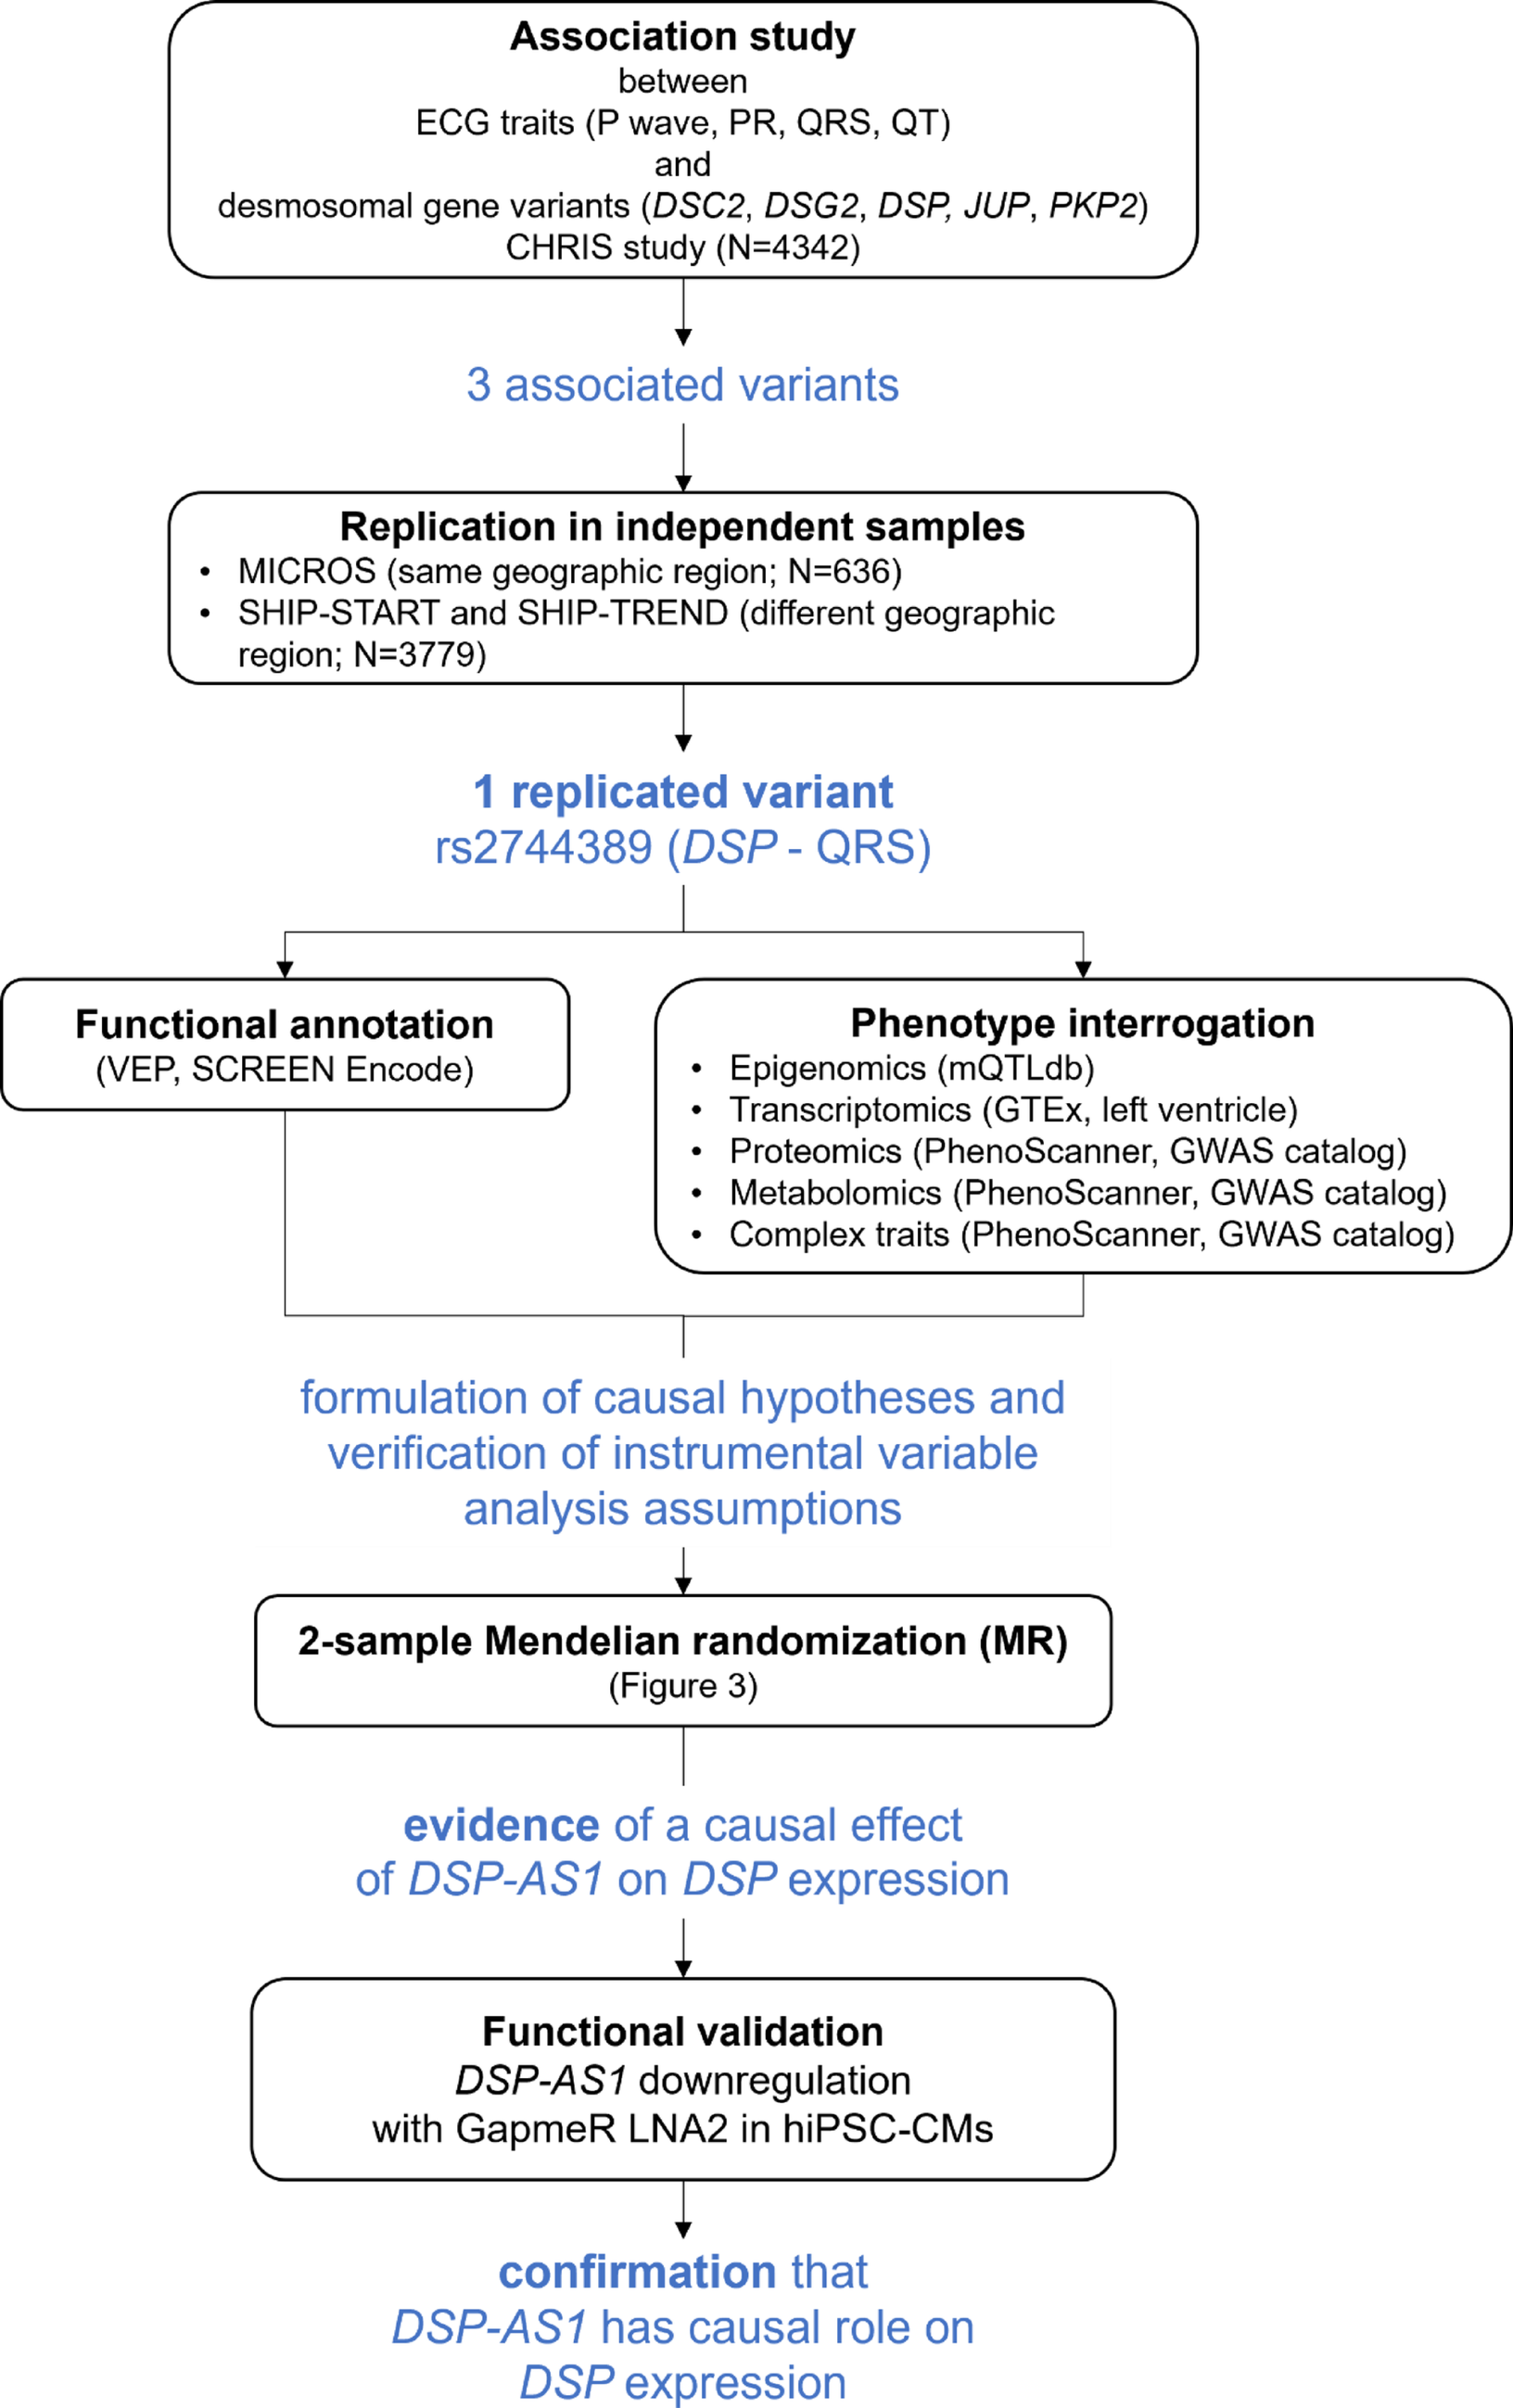
Fig. 1
Analysis flowchart and main results
Fig. 2
Regional association plot showing association of the DSP genomic context with QRS length. A -log10(P-value) of the SNP-QRS association (y-axis) against SNP genomic position (GRCh37; x-axis) at DSP. The purple diamond indicates the most associated SNP (position 7,543,123); its LD with the other SNPs is based on the r2 estimated on the CHRIS sample. B Annotated genomic context, including validated pseudogenes, ReMap track showing multiple regulatory elements condensed, and ClinVar track. Orange vertical line: rs2744389 location. LD with rs2076298, selected IV for MR, is also highlighted. Figure source: UCSC genome browser
Fig. 3
Mendelian randomization analysis scheme. Upper panel: overview of the two hypothesized biological pathways underlying DSP regulation, possibly contributing to QRS duration. Lower panel: decomposition of the pathways by individual analysis with indication of the instrumental variable and data sources. Causal effect of cg02643433 methylation on DSP-AS1 mRNA level (A), DSP mRNA level (B), and QRS duration (C); causal effect of DSP-AS1 RNA level on cg02643433 methylation (D), DSP mRNA (E, experimentally validated), and QRS duration (F). The causal effect of DSP mRNA on desmoplakin protein levels was not tested due to the lack of proteome-wide association studies including desmoplakin. *denotes significant MR results (Table 4)
Functional follow-upCell culturesFor the initial analysis of endogenous DSP and lncRNA expression, we used human induced pluripotent stem cells (hiPSC), hiPSC-derived cardiomyocytes (iPSC-CMs), commercial adult human primary keratinocytes (HPK), and human embryonic kidney HEK293T cell lines. HPK were cultured in keratinocyte growth medium (Human EpiVita Serum-Free Growth Medium 141-500a, Cell Applications) HEK293T cells were grown as previously described (Obergasteiger et al. 2023). The hiPSCs line available for this study derives from one healthy individual who was previously characterized (De Bortoli et al. 2023; Meraviglia et al. 2021). Briefly, hiPSCs were cultured in feeder-free conditions on 6-well plates coated with Matrigel (Corning), using a ready-to-use, commercially available medium (StemMACS™ iPS-Brew XF; Miltenyi Biotec). The cardiomyogenic differentiation was induced with the PSC Cardiomyocyte Differentiation Kit (Thermo Fisher Scientific). After 22–25 days of cardiomyogenic differentiation, the beating monolayer of cells was dissociated by Multi Tissue Dissociation Kit 3 (Miltenyi Biotec) to obtain a purified iPSC-CMs population, through the depletion of non-CMs cells, by using PSC-Derived Cardiomyocyte Isolation Kit (Miltenyi Biotec). The purified hiPSC-CMs were replated on matrigel coated 24-well plates (150.000-200.000 cells/well) in a basal medium (High Glucose DMEM; Gibco), 2% Hyclone Fetal Bovine Defined (GE Healthcare Life Sciences), 1% non-essential Amino Acids (Gibco), 1% Penicillin/Streptomycin (Gibco) and 0.09% β-mercapto-ethanol (Gibco) for further experiments. After 3–4 days of recovery, the purified hiPSC-CMs were treated with GapmerRs as described below.
GapmeRs design and delivery in hiPSC-CMsFor the lncRNA knockdown, specific locked nucleic acid (LNA) antisense GapmeRs targeting RP3-512B11.3 lncRNA (Transcript Annotation ENST00000561592.1_1) were designed using the Qiagen RNA Silencing tool, available at https://geneglobe.qiagen.com/us/customize/rna-silencing. The tool ranked several GapmeRs at the highest score. Two were selected, named LNA1 and LNA2, and tested in hiPSC-CMs together with the GapmerR negative control A (NC; LG00000002-FFA, Qiagen).
Four different conditions were tested, at GapmeRs concentrations of: (1) 500nM for 5 days; (2) 500nM for 10 days; (3) 1000nM for 5 days; and (4) 1000nM for 10 days. In all conditions, the delivery of GapmeRs into hiPSC-CMs was performed through an unassisted “naked” uptake, that is, GapmeRs were directly added to cell medium without transfection reagents. This approach, also known as gymnosis, is less toxic for the cells and shows a higher efficiency in cells that are difficult to be transfected as hiPSC-CMs (Anderson et al. 2020; Trembinski et al. 2020). To perform gymnosis, the in vivo ready high-quality grade (HPLC purification with a final step of sodium salt exchange) was required for the GapmeRs production. For conditions 2 and 4, after 5 days of treatment, the culture medium was replaced with fresh medium containing the same concentration of GapmerR.
RNA isolation and ddPCR analysis.
Total RNA was extracted from cultured cells by TRIzol reagent and Direct-zol RNA Kit (Zymo Research). Then, reverse transcription of 50ng RNA was performed using SuperScript VILO cDNA Synthesis Kit (Invitrogen) in a total volume of 20 µl. Droplet Digital PCR (ddPCR) was performed using a QX200 system (Bio-Rad) according to manufacturer’s recommendations. The reactions (22 µl total volume) contained 2× ddPCR™ Supermix for Probes (no dUTP) (Bio-Rad), 20× primer/probe assay for each target, except for DSP for which it contained 31.5× primer/probe assay, 1 ng of cDNA for DSP and 4ng of cDNA for the DSP-AS1 lncRNA, and water up to the total volume. For the specific detection of the lncRNA DSP-AS1, DSP and the reference RPP30 gene, the following primer/probe assays were used: Bio-Rad qhsaLEP0147498 (FAM), Bio-Rad dHsaCPE5047954 (FAM) and Bio-Rad dHsaCPE5038241 (HEX), respectively. The droplets were generated with the QX200™ Droplet Generator (Bio-Rad), mixing 20 µl of the reactions described above and 70 µl of Droplet Generation Oil for Probes (Bio-Rad), loaded in the proper lanes of DG8™ cartridges. Droplets were then transferred to a 96-well PCR semi-skirted plate and the reaction was performed using a GeneAmp™ PCR System 9700 (Applied Biosystems), according to the following program: 95 °C for 10 min, then 45/40 (DSP/DSP-AS1) cycles of (94 °C for 30 s, 57/60°C (DSP/DSP-AS1) for 2 min), 98 °C for 10 min and 4 °C for the storage. Amplification signals were read using the QX200™ Droplet Reader (Bio-Rad) and analyzed using the QuantaSoft software (Bio-Rad). All ddPCR details are described following the Minimum Information for Publication of Digital PCR Experiments (dMIQE) guidelines checklist (dMIQE Group 2020) and are available in Online Resource 1 (Table S10).
Desmoplakin protein expression analysisRIPA lysis buffer, composed of 10 mM Tris-HCl pH 7.4, 150 mM NaCl, 1% Igepal CA630 (NP-40), 1% sodium deoxycholate (NaDoc), 0.1% SDS (Sodium Dodecyl Sulfate), 1% Glycerol, supplemented with protease and phosphatase inhibitors (Complete Tablets, Mini EASYpack, Roche) was used to lysate hiPSC-CMs, after GapmeRs treatment. The protein level was quantified using Pierce™ BCA Protein Assay Kit (Thermo Scientific).
hiPSC-CMs lysates were tested for desmoplakin protein (sc-390975 mouse anti desmoplakin I/II (A-1), Santa Cruz) and total protein (Total Protein Detection Module, Bio-Techne) using a 66–440 kDa Separation Module (Bio-Techne) on the Protein Simple Wes™ system (Bio-Techne). Lysates were diluted with 0.1X Sample Buffer to a final concentration of 0.2 µg/µl, then mixed with 5X Fluorescent Master Mix and heated at 95 °C for 5 min. Mouse anti-desmoplakin antibody was used at 1:25 dilution, total protein biotin labelling reagent reconstitution mix was prepared following the manufacturer’s instructions and then loaded with prepared samples and other reagents (ladder, blocking antibody diluent, HRP-conjugated anti mouse secondary antibody (Anti-Mouse Detection Modules, Bio-Techne), total protein streptavidin HRP and the luminol-peroxide mixture) in the assay plate. We used the following specific instrument settings: total protein size as assay type, separation run at 475 V for 30 min, incubation time of 30 min for total protein biotin labelling, total protein streptavidin HRP, primary and secondary antibodies. High dynamic range (HDR) function was applied for luminol/peroxide chemiluminescence detection.
Data analysisResults of these laboratory experiments were visually inspected via paired dot-plots (“pairplot”). Given hiPSC-CMs obtained from the same differentiation were split into two groups, one treated with LNA2 and the other with LNA-CN, distributions of mRNA expression and protein levels were compared across using the Wilcoxon matched-pairs signed rank test to account for the matched conditions. Because prior evidence was either available or could be hypothesized for the direction of the effect, we applied a one-sided test.
Statistical analysis softwareWhen not otherwise specified, statistical analyses of population data were performed using the R software package (www.R-project.org) (R Core Team 2017). Laboratory experiment data were analyzed with GraphPad version 9.3.1.471.
Comments (0)