
Remember me
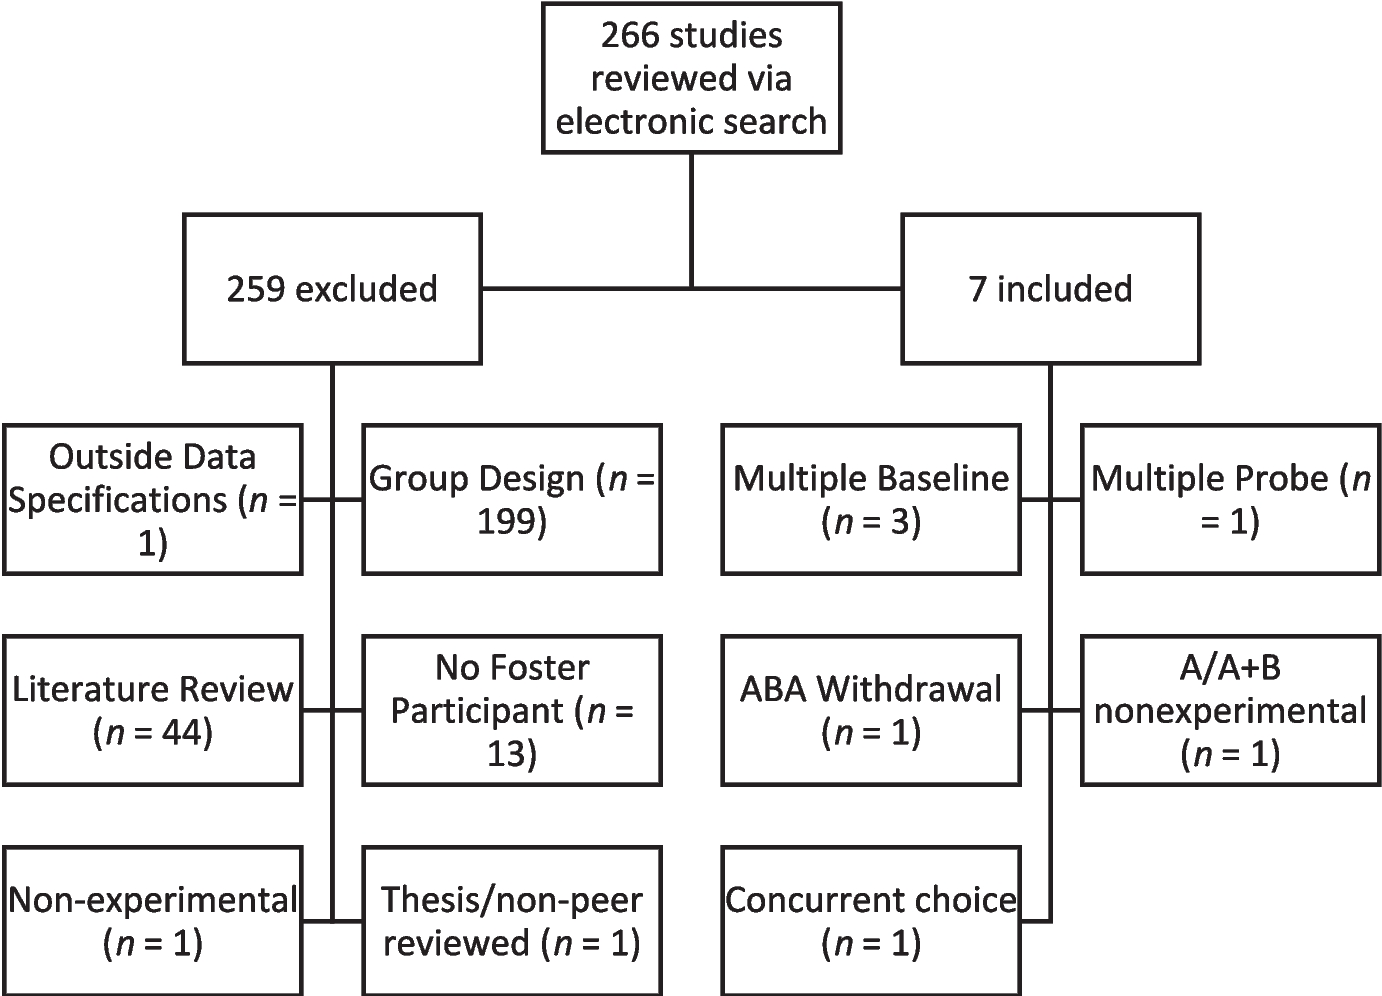
Participants were cyclists who arrived at or left the university campus during the observation periods. No personal data were recorded—only whether they wore or carried a helmet. As no personal data were collected, informed consent was waived. A total of 932 cyclists were observed throughout the study. Because the cyclists were not individually identified, it is not possible to say how many people were involved (many cyclists were indeed observed repeatedly at several observation sessions).
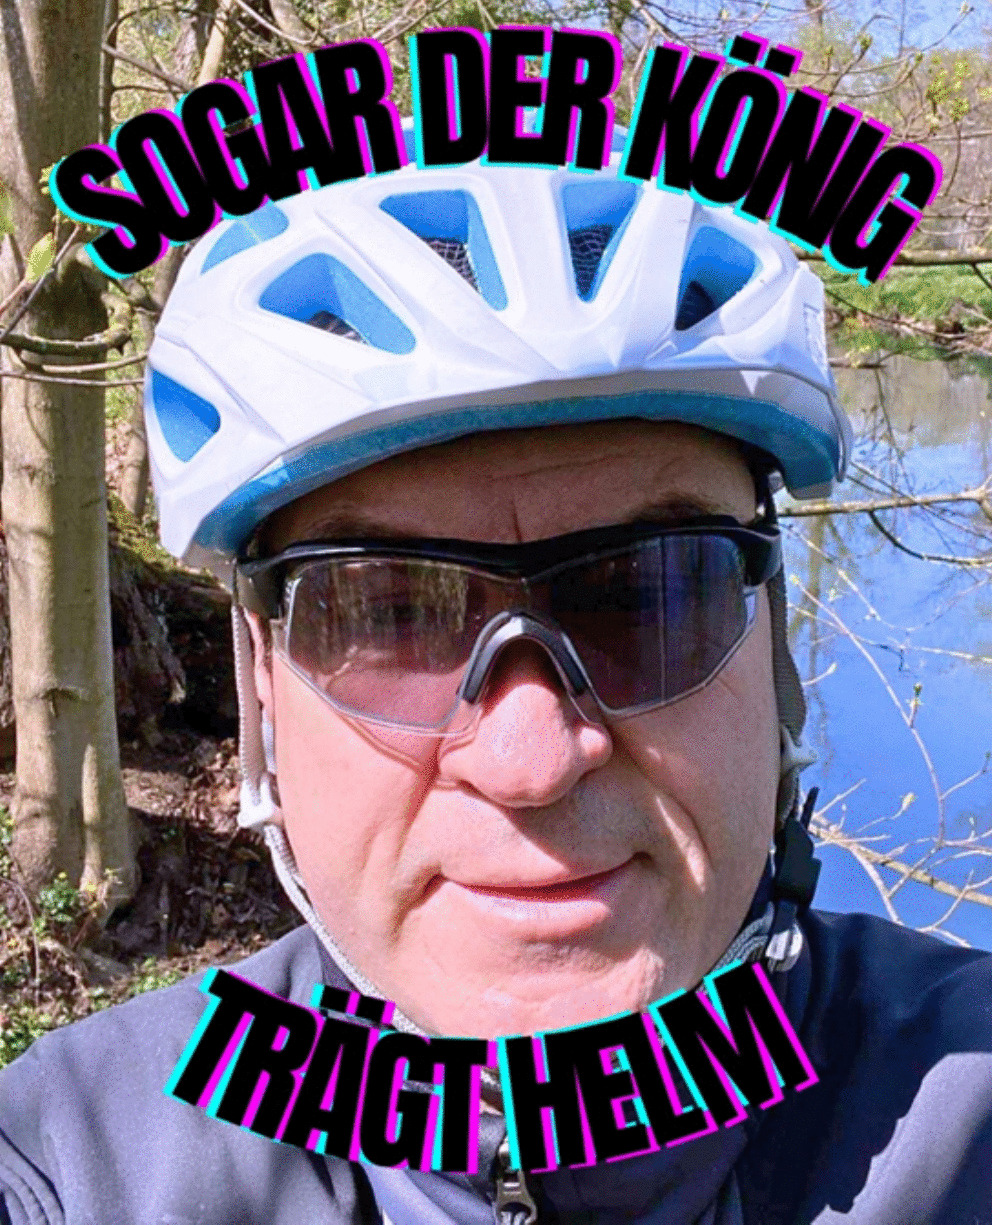
The study took place in front of the university’s main building. Students designed a sticker with Markus Söder, Bavaria’s State Prime Minister, wearing a bicycle helmet. A total of 200 stickers were printed (cost: €101.82), with two slogans: “Even the king wears a helmet” (Fig. 1) and “Looks like shit but saves my life” (Fig. 2).
Fig. 1
Sticker used in intervention, slogan 1 (“Even the king wears a helmet”)
Fig. 2
Sticker used in intervention, slogan 2
The first slogan references a German Federal Ministry of Transport campaign featuring models in helmets and underwear (Runter vom Gas, 2019). The second plays on Söder’s leadership style, often compared to that of the Sun King (Dürrholz, 2020). The image of the prime minister with a helmet is widely recognized in Bavaria, particularly among social media-savvy students who use him as a meme.
Dependent Variables and Interobserver AgreementThe dependent variable was the percentage of cyclists wearing helmets. Only individuals riding or pushing a bicycle were counted. Eligible vehicles included traditional bicycles and e-bikes with two wheels aligned in a single line. Scooters, electric scooters, and motorcycles were excluded.
A helmet wearer was defined as someone wearing a helmet or carrying one while pushing their bike. Non-helmet wearers were all other cyclists. The percentage of helmet wearers was calculated as follows:
$$\mathrm\;\mathrm\;/\;(\mathrm\;\mathrm\;+\;\mathrm-\mathrm\;\mathrm)\;\mathrm x\;100$$
To assess interobserver agreement (IOA), a second observer recorded data in 25% of sessions across all study phases. IOA was calculated separately for helmeted and non-helmeted cyclists. Agreement was slightly higher for helmet wearers, ranging from 91.7% to 100% (M = 98.6%). For non-helmet wearers, agreement ranged from 94.7% to 100% (M = 97.2%).
Social ValidityAfter the observations were completed, an online survey on social validity was conducted. The survey link was shared in various social media groups, such as WhatsApp and Instagram. The questions covered topics such as how often participants cycled to the university and whether they wore a helmet while doing so. Additionally, they were asked if they had noticed the stickers and received one themselves, how they rated the stickers and the campaign, and whether they believed the sticker had influenced their behavior.
Design and ProcedureAfter the assessment, an A-B design with follow-up measurements was carried out.
AssessmentBefore the planning of the intervention, a contingency analysis was conducted to determine the reasons why cyclists do or do not wear helmets. Cyclists who stopped at a traffic light near the university (but not at the same place where the actual study took place) were interviewed for two hours. A questionnaire (see supplemental material) with closed and open questions was filled out. Cyclists who wore helmets and those who did not were asked why. Helmet wearers were also asked how often they wore their helmets, how they remembered to wear them, and how they transported or stored them when not wearing them.
BaselineObservations took place Monday to Thursday during 15-min lecture breaks to capture as many cyclists as possible. Sessions varied daily based on observer availability.
Observers positioned themselves for a clear view of the observation area and used a smartphone counter app to track helmet use. This method made them appear occupied with their phones, minimizing interaction with cyclists during baseline observations. The baseline phase lasted 16 days.
InterventionThe intervention prioritized safety over aesthetics, using prompts to help cyclists remember their helmets. Observers distributed stickers to all cyclists—helmet wearers as positive reinforcement and non-helmet wearers as a reminder. Interactions were kept lighthearted to avoid resistance. Cyclists were briefly addressed, with non-helmet wearers encouraged to use the stickers as reminders, and helmet wearers simply offered a sticker.
Observations followed the same method as in the baseline phase. The intervention lasted eight days until all 200 stickers were distributed.
Follow-UpAfter the Intervention phase, the baseline conditions were reinstated. Observations during the follow-up phase lasted nine days in total.
Comments (0)