
Remember me
This retrospective study was approved by the Hiroshima University Ethics Committee (approval number: E2023-0269) and was conducted in compliance with the 1975 Declaration of Helsinki, as amended in 1983. Informed consent was obtained through an opt-out method, in accordance with the guidelines of the local institutional ethics committee.
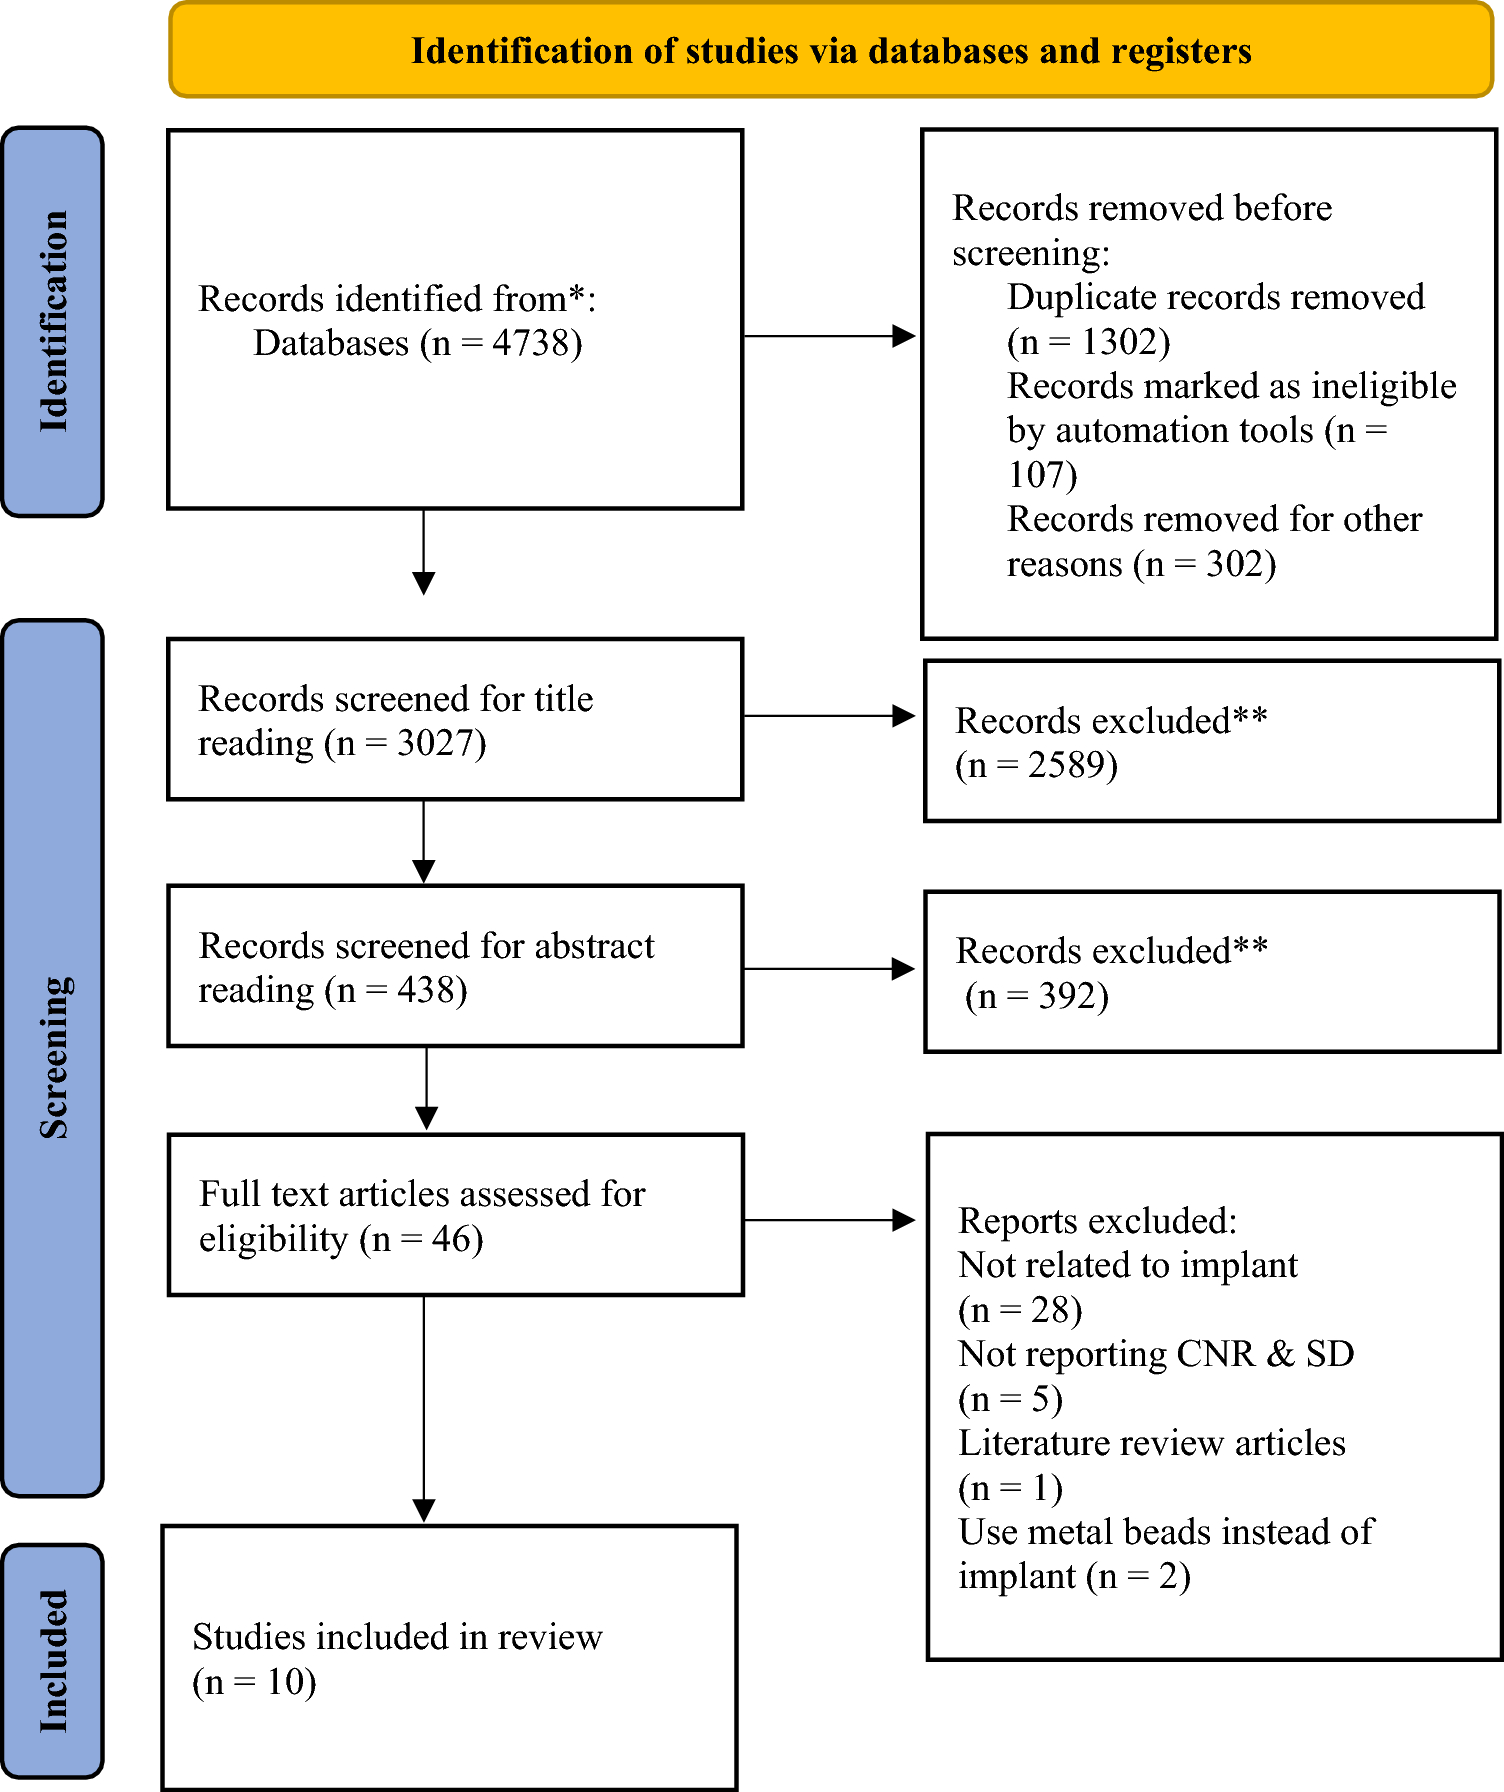
PatientsThe patient selection process is shown in Fig. 1. Patients scheduled to receive bone resorption inhibitors at Hiroshima University Hospital between May 2007 and December 2021 and who had panoramic radiographs taken prior to the administration were enrolled in the study. A total of 168 patients were selected, of whom 152 were confirmed to have received bone resorption inhibitors. Among the 152 patients, 33 developed MRONJ, whereas 119 did not. From the MRONJ group, 1 patient with MRONJ affecting only the maxilla was excluded, leaving 32 patients included in the final analysis as the MRONJ group. In the non-MRONJ group, patients who had been followed for less than 2 years after receiving bone resorption inhibitors were excluded. Hence, only 57 patients who had been followed for more than 2 years were included in the non-MRONJ group. The diagnosis of MRONJ was established based on the following criteria [14]: (1) a history of current or past treatment with antiresorptive therapy, either alone or in combination with immunomodulatory or angiogenesis inhibitors; (2) exposed or explorable bone through an intraoral or extraoral fistula in the maxillofacial region persisting for at least 8 weeks; and (3) no history of radiation therapy or metastasis to the jaw. Ultimately, 32 MRONJ and 57 non-MRONJ patients were included in the final analysis (Table 1). All panoramic radiographs were obtained using Hyper X or AUGE X ZIO CM (ASAHIROENTGEN IND. CO., LTD., Kyoto, Japan).
Fig. 1
Flow diagram showing the participant selection process
Table 1 Patient characteristicsThe patient data were randomly divided into the training (n = 53), validation (n = 18), and test (n = 18) groups for machine-learning evaluation using a statistical software (Table 2). No significant differences were found among the three groups in terms of MRONJ status, age, sex, medication type, time until MRONJ development, or follow-up period in the non-MRONJ group.
Table 2 Patient characteristics in the training and validation groupsRegion of interest segmentation and radiomics feature extraction and selectionRegion of interest (ROI) segmentation of the mandible was performed on panoramic radiographs taken prior to medication administration using an open-source software, 3D slicer (https://www.slicer.org/) [15]. On panoramic radiographs, the mandible was segmented from the mental foramen to the anterior mandibular antegonial notch and from the superior border of the mandibular canal to the inferior border of the mandible (Fig. 2). The segmentation of this region was designed to avoid the influence of the teeth, the cervical spine in the anterior region, and the pharyngeal cavity and the contralateral mandibular ramus in the posterior region. The reason for including the cortical bone along the lower border of the mandible is as follows. Although MRONJ typically develops from the alveolar bone in cases of periodontitis or after tooth extraction, it can also occur from the mylohyoid muscle line or the bony prominences of the jaw [16]. MRONJ develops from either cancellous or cortical bone. Therefore, cancellous and cortical bone were included in the ROI segmentation in this study. Image features (radiomics) were extracted using the open-source software Pyradiomics package (Pyradiomics 3.0; http://pyradiomics.readthedocs.io) [17, 18] with a three-dimensional slicer. Radiomics features serve as one of the key image biomarkers [19].
Fig. 2
Example of segmentation using panoramic radiographs. A Original panoramic radiograph before treatment. B Segmentation of the mandible before treatment
Image texture analysis was used to extract and quantify image features from the region, including first-order statistical, shape-based, histogram-based, and texture-based features. These texture-based features include gray-level co-occurrence, gray-level run length, gray-level size zone, gray-level distance zone, neighboring gray-level dependence, and neighborhood gray-tone difference matrices. Higher-order statistical features were extracted using a wavelet imaging filter, incorporating low-pass and high-pass filters to reduce interference from gas [10]. The image features within the segmentation region were extracted and quantified, resulting in a total of 850 image features. These included 13 shape, 18 histogram-based, 75 texture-based, and 744 wavelet features (related to histogram and texture). To identify valid features, the least absolute shrinkage and selection operator (LASSO) was used. LASSO is the method that simultaneously performs radiomics feature selection and data fitting by building a classification model trained on the data. A leave-one-out cross-validation approach was employed for internal validation to avoid overfitting during model fitting and hyperparameter optimization [12]. In addition, an early stopping function was used to prevent overfitting.
Support vector machine (SVM) and neural network of multilayer perceptron (MLP) were used as machine-learning models [12]. The models were evaluated for sensitivity, specificity, accuracy, and precision. The area under the curve (AUC) was evaluated using the receiver operating characteristic (ROC) curve. The MLP model, which utilized backpropagation on the measurements to classify the likelihood of developing MRONJ, consisted of an input layer, an output layer, and a hidden layer (intermediate layer). The TanH function was employed as the activation function in this study. All neurons in the input, hidden, and output layers were connected (Fig. 3). In addition, a boosting method was implemented, in which several small models (base models) were fitted sequentially, and their results were combined to create a composite model. During boosting, a small model is fitted, and its residuals (scaled residuals) are calculated. The residuals are then refitted to the subsequent small model in an iterative process. Finally, the small models are combined to produce the final model. The model was evaluated using the validation set to determine the number of iterations for fitting the smaller models. The boosting performance was set to 6 models and a training rate of 0.1. MLP classification was conducted using JMP Pro (version 18.0; SAS Institute, Cary, NC, USA).
Fig. 3
Construction of the MLP neural network. Radiomics feature 1: Maximum2DdiameterColumn. Radiomics feature 2: Wavelet-LHL_firstorder_Skewness, Radiomics feature 3: Wavelet-LHH_firstorder_Skewness, Radiomics feature 4: Wavelet-HHL_firstorder_Range, Radiomics feature 5: Wavelet-LLL_firstorder_Maximum, Radiomics feature 6: Wavelet-LHH_GLSZM_ HighGrayLevelZoneEmphasis, Radiomics feature 7: Wavelet-LHH_GLSZM_ LowGrayLevelZoneEmphasis, Radiomics feature 8: Original_GLRLM_RunLengthNonUniformity, Radiomics feature 9: Wavelet-HLH_GLRLM_ HighGrayLevelRunEmphasis, Radiomics feature 10: Wavelet-HLH_GLRLM_ LowGrayLevelRunEmphasis
Statistical analysesStatistical analyses were performed using the Wilcoxon rank-sum test for numerical data and Chi-square or Fisher’s exact tests for nominal data. All statistical analyses were carried out using JMP Pro (version 18.0; SAS Institute, Cary, NC, USA). A P value of < 0.05 was considered significant.
Comments (0)