The Ethics Committee at Tokyo Kasei University approved this research project (approval number: Ita-E2023-16). Following the guidelines set forth in the Declaration of Helsinki, researchers obtained informed consent from all participants before their involvement in the study.
Participants
The data analyzed in the in-person survey was collected from November to December 2023. The sample comprised 168 students from public and private senior high schools in Tokyo. Of these students, 128 (52 males, 70 females; mean age: 16.55 ± 0.64 years) who completed the following measures and who had a sleep debt index (SDI) score of ≥0, based on a previous study [16], were selected and analyzed.
MeasuresLoneliness-related measures
Loneliness Orientation Test (LOT). To evaluate loneliness orientation, we developed the LOT using a semantic differential method. The scale asked for responses to each of seven pairs of words (Table 1) regarding their image of “loneliness,” using a seven-item method (−3 to 3). Negative and positive scores indicated negative and positive orientations towards loneliness, respectively.
Table 1 Result of an EFA and CFA of the LOTThree-Item Loneliness Scale (TILS). The scale is a validated self-report tool that measures loneliness intensity through three questions [17, 18]. A higher total score indicates greater feelings of loneliness.
Sleep-related measures
Athens Insomnia Scale (AIS). This eight-item self-report questionnaire evaluates insomnia severity [19,20,21]. Total scores are calculated by adding individual responses, with higher scores reflecting more severe insomnia symptoms. Participants scoring 6 or above were classified as having clinical insomnia, based on the established cutoff point of 5.5.
SDI. The scale is calculated from responses to three questions about sleep duration: (1) sleep duration on weekdays, (2) sleep duration on weekends, and (3) preferred sleep duration when free from obligations. Following Okajima et al.’s methodology [16], the SDI calculation produces higher scores for greater sleep debt.
Circadian Energy Scale (CIRENS). This validated two-item scale measures chronotype (morning vs. evening preference) using energy ratings from 1 (very low) to 5 (very high) [22]. The final score is calculated by subtracting morning energy from evening energy, resulting in a range from -4 (strong morning preference) to +4 (strong evening preference).
School-refusal-related measures
Feeling of School-Avoidance Scale (FSAS). The scale measures attitudes toward school attendance [23]. This tool includes six items that assess aversion to school, such as “I want to miss school” and “I want to go home as soon as classes are over.” Higher scores indicate stronger resistance to school attendance.
Number of absences. Participants were asked to provide information on the number of days absent between April 2023 and the time of the survey.
Sample size
The sample size was calculated using a power analysis that examined the correlation coefficients (r) among AIS, TILS, and FSAS in Okajima's study [9]. Previous findings showed significant correlations (p<0.01) between all three measures: AIS–TILS (r=0.33), AIS–FSAS (r=0.43), and TILS–FSAS (r=0.49). Using a statistical power of 0.8, the analysis indicated that between 44 and 102 participants would be needed. To ensure adequate sampling, the researchers aimed to recruit at least 110 participants.
Statistical analysis
Descriptive statistics were computed using the R statistical software (version 4.4.0; R Project for Statistical Computing, Vienna, Austria). We utilized the R packages as follows: “pwr,” “psych,” for descriptive statistics, “GPArotation,” “lavaan,” for factor analysis, “NbClust,” “factoextra,” “Rmisc” for cluster analysis, “tidyyverse,” “MASS,” “dplyr,” “easystats,” “ggeffects,” “lme4” “effectsize” for generalized linear models (GLM), and “compute.es.” for Hedges’ g.
First, the structural validity of the LOT was evaluated using exploratory factor analysis (EFA) with a maximum likelihood solution method. The factors were determined based on the shape of the scree plot using parallel analysis. In addition, we estimate a goodness of fit of the factor structure using confirmatory factor analysis (CFA).
Second, correlation analysis was conducted between the scales. To confirm the association between sleep problems, loneliness, and school refusal, we conducted a regression analysis using a GLM with (1) sleep problems (AIS, SDI, and CIRENS) and the LOT as independent variables and the TILS as the dependent variable using the Gamma distribution with a log-link function; (2) sleep problems, the LOT, and TILS as independent variables, and school refusal as dependent variables using the Gamma distribution with a log-link function; and (3) sleep problems, the LOT, and TILS as independent variables, and the number of absences as dependent variables using the Poisson distribution with a log-link function.
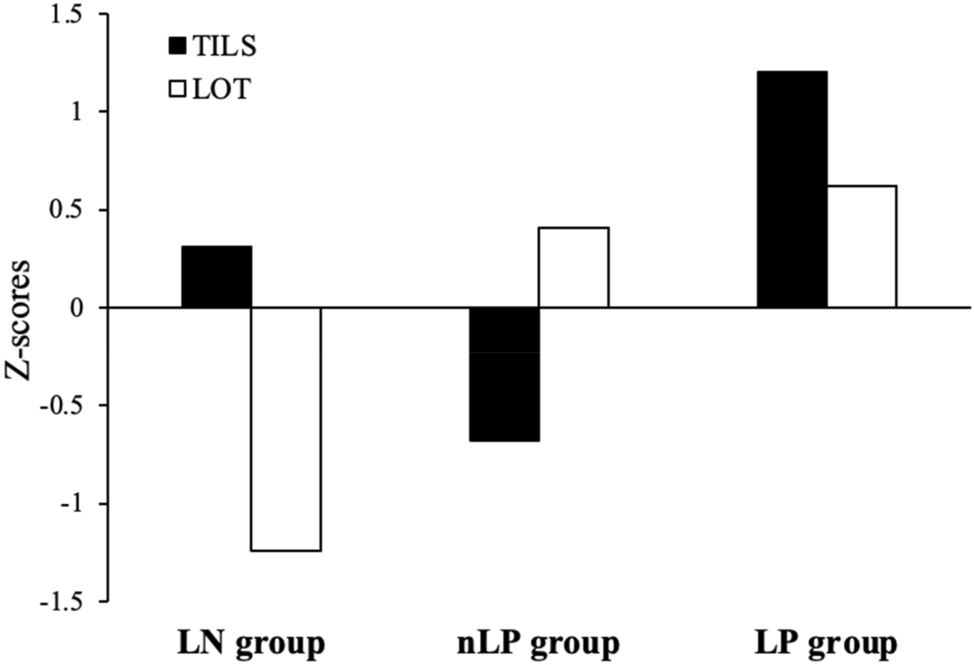
Third, we performed a hierarchical cluster analysis (CA) with Ward method to investigate the combination of feelings of loneliness (TILS) and loneliness orientation (LOT). We determined the best number of clusters based on the results of some methods such as silhouette and gap statistic. We then conducted an analysis of variance using a GLM. Multiple comparisons were performed using Dunnett’s method when the estimated values were significantly different. We estimated the effect sizes of scales between the cluster groups using Hedges’ g. In general, an absolute g value of 0.2 indicates a small effect size, a value of 0.5 indicates a moderate effect size and a value of 0.8 indicates a large effect size [24].
For some parameters, 95% confidence intervals (CIs) were used; if the CI did not equal zero, it was considered statistically significant.


Comments (0)