
Remember me


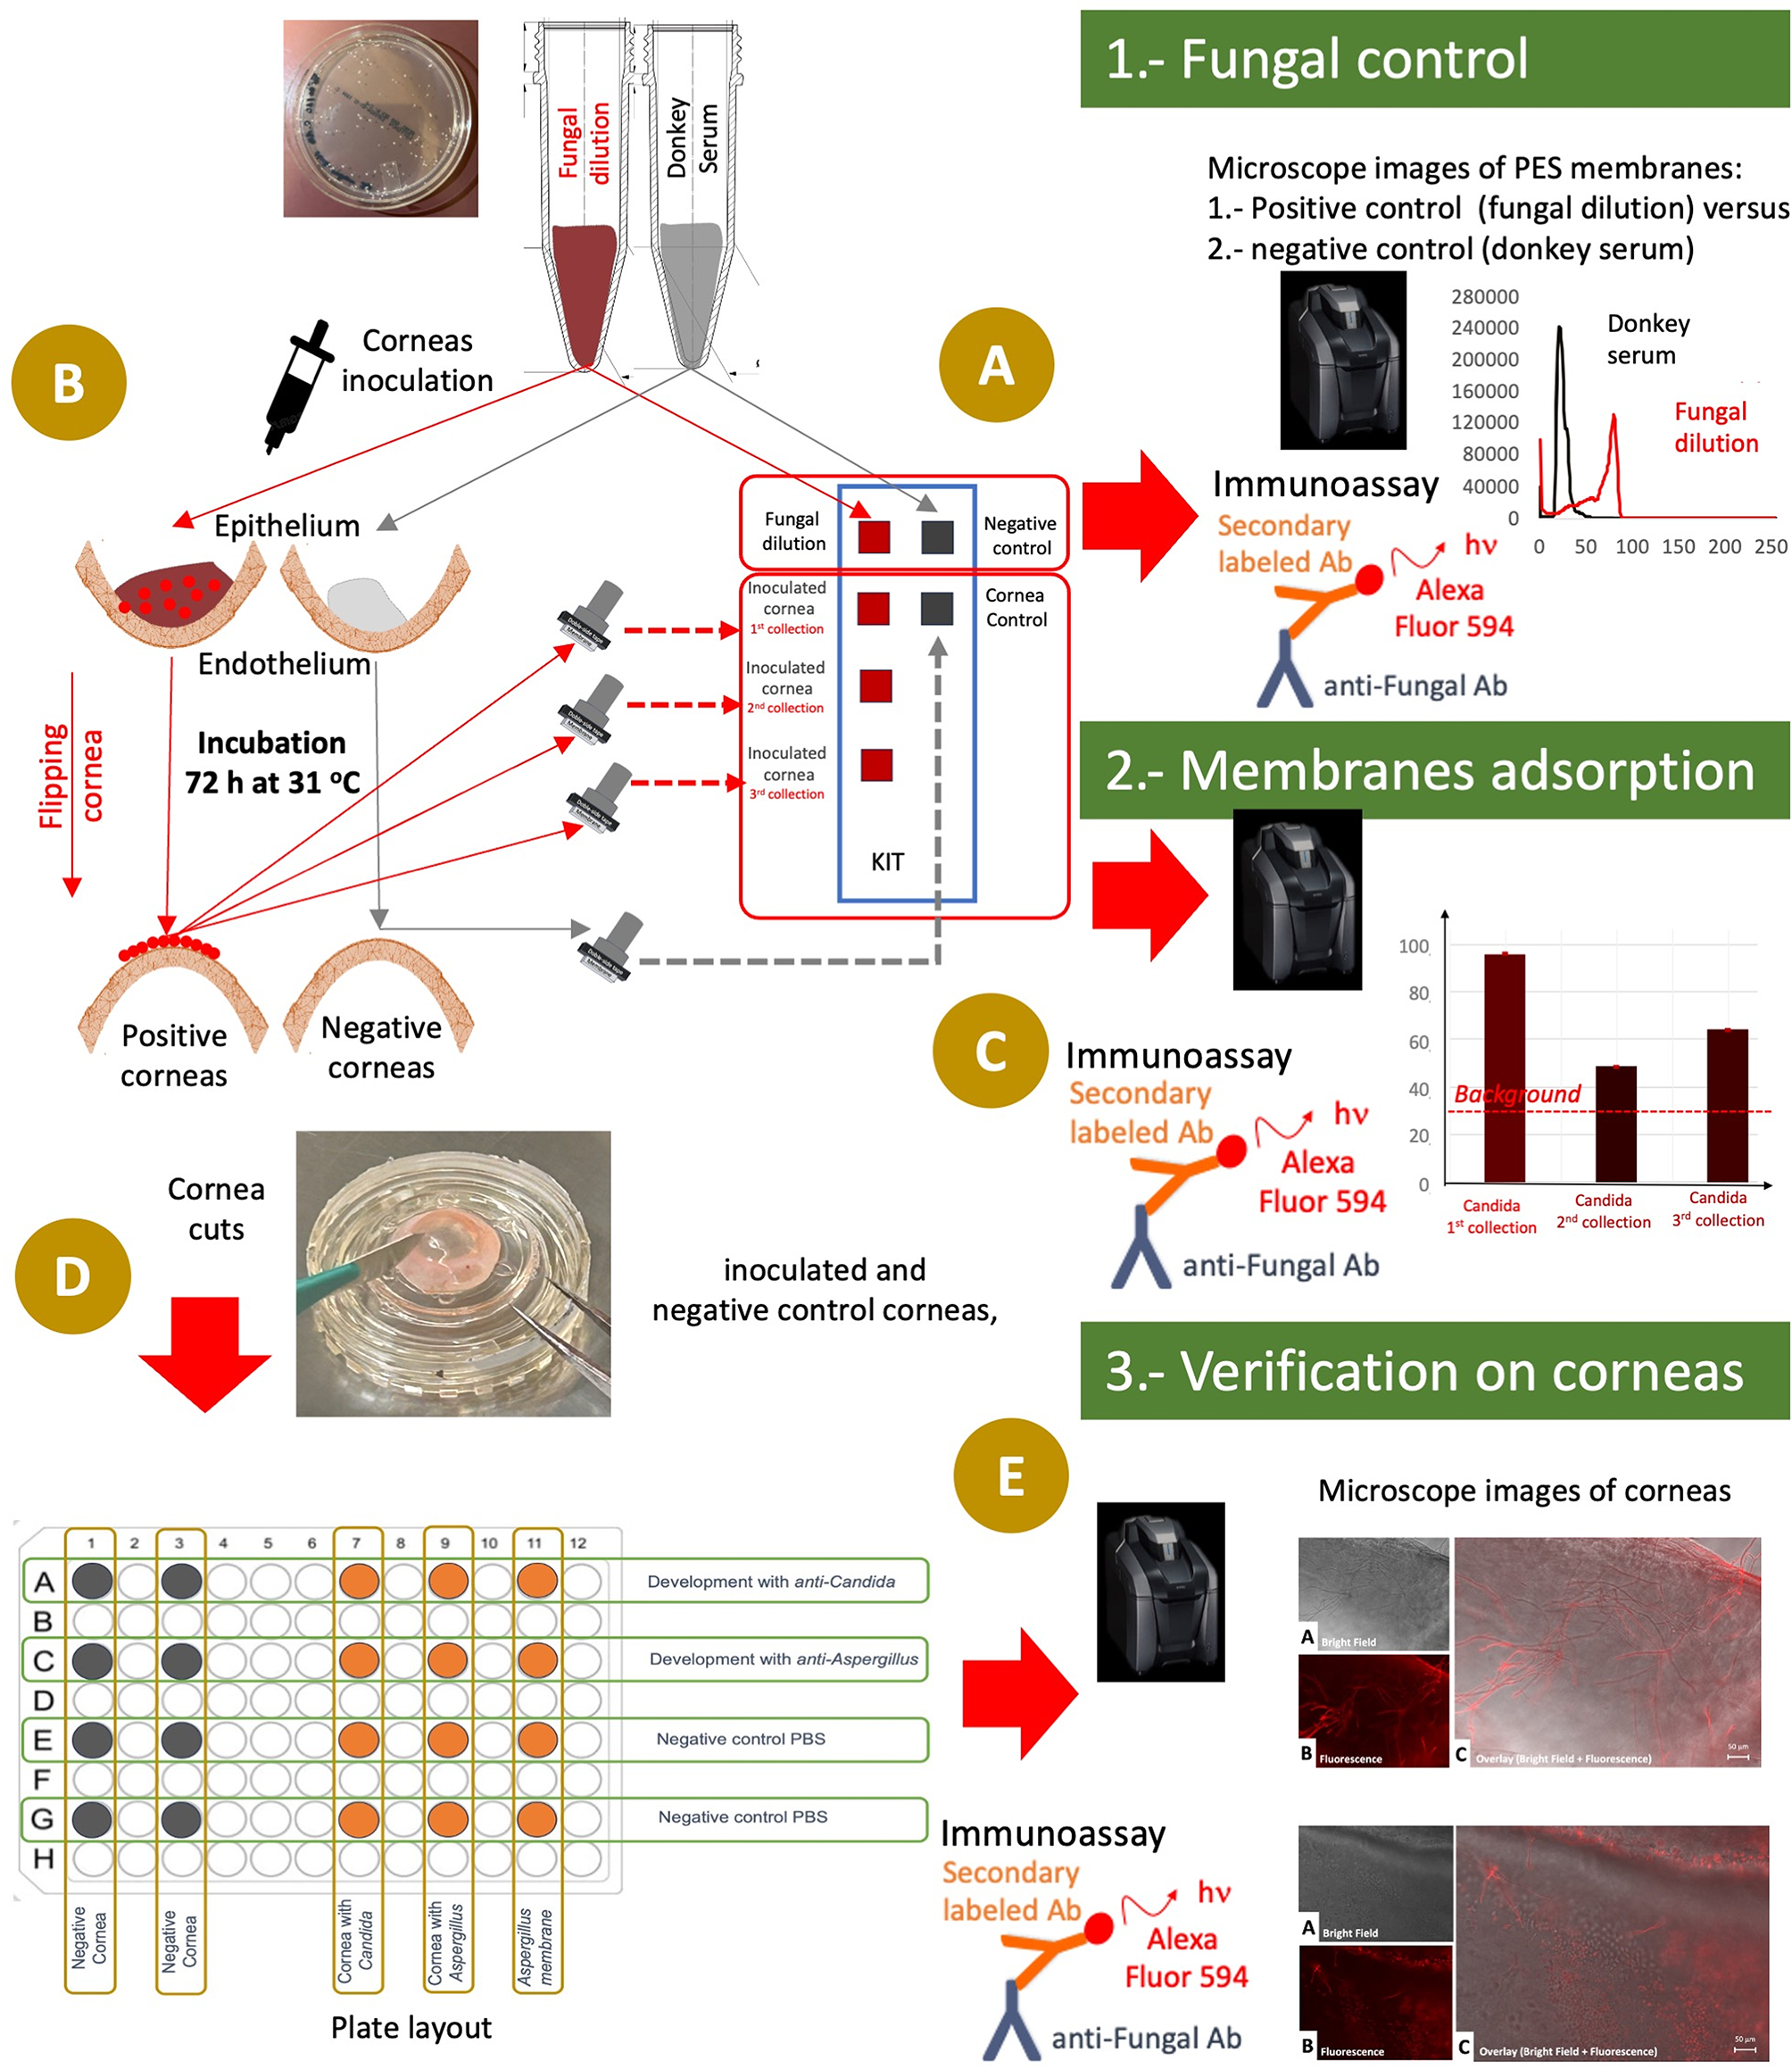
In Fig. 1 can be observed the flow chart showing the whole experimental process from (1) the fungal control, (2) the adsorption of the PES membranes and (3) Verification on the results in the corneas where we proceeded to collect the samples by the PES membranes.
Fig. 1
Experimental flow chart. A) First step to control that the fungal dilution, we call this positive and negative control because this dilutions are directed placed on the PES membranes. The results are obtained by fluorescence immunoassay, and this is a step to control the fungal dilution. B) Second step to flip the corneas and inoculate with the fungal dilutions carrying out in parallel a negative cornea and incubate 72 h at 31 °C. C) Third step to proceed to collect with the PES membranes from the epithelium corneas surface. These membranes are glass specimen (the KIT) and evaluate the membranes adsorption by immunofluorescence. D) Fourth step to cut the corneas in pieces and put these in a plate to check and compare the results obtained with the PES membranes. E) Final step to verify the results by immunofluorescence directly in the corneas we used for the collection in order to observe and compare the results
Corneal acquisition and preparationExperiments were conducted in accordance with the tenets of the Declaration of Helsinki for biomedical research involving human tissue. A total of six human donor research quality corneas were acquired from the Beauty of Sight Eye Bank (Miami, FL) with each cornea assigned to a different condition. Each cornea was inverted so that the epithelial face had concave up orientation, creating a corneal epithelial pit (Fig. 1A). Prior to acquisition, all corneas were stored in standard corneal storage vials with Optisol-G at 4 °C per eye banking protocol. The vials were filled with culture media composed of CTS OptiMem I (Gibco, Carlsbad, CA), 2% fetal bovine serum, 10,000 units/mL penicillin, and 10,000 µg/mL streptomycin. Culture media was filled up to the point of contact with the inferior side of the cornea to ensure isolation of fungal inoculate. The corneal epithelial surface was not in contact with the corneal culture media.
Corneal inoculationCandida albicans and Aspergillus fumigatus isolates were cultured on Sabouraud dextrose agar containing 50.0 mg of chloramphenicol and 5.0 mg gentamicin for 72 h. A 0.5 McFarland solution of C. albicans and A. fumigatus equivalent to ~ 106 CFU/mL was prepared by dilution in Dulbecco’s Phosphate Buffered Saline (DPBS). Fungal concentration of the stock solution was confirmed through culture and colony counting using a hemocytometer.
Corneas were acquired in donor pairs. Corneas originating from the left eye were inoculated with a fungal suspension while corneas originating the right eye were used as negative controls and inoculated with Phosphate-Buffered Saline (PBS). For the treatment corneas, at the center of the corneal pit and on the epithelial aspect of the cornea, 10 µL of the stock fungal solution was pipetted. For control corneas 10 µL of PBS was pipetted. The resulting preparation was cultured at 31 °C with 5% CO2 for a period of 48 h (Fig. 2A and B).
Fig. 2
Scheme of corneal preparation (picture), inoculation, immunoassay and observation
PES membrane and collection of the fungal samplesAt 48 h of culture, corneas were removed from their chamber, and inverted resulting in the original corneal orientation (Fig. 1B) with the epithelium facing up. The 48 h time point was chosen in accordance with prior literature [8]. The corneas were placed in a cell culture plate and on top of a Millicell cell culture insert (MilliporeSigma, Burlington, MA) as scaffolding. The corneas were kept in this orientation for two minutes to dry the epithelial surface for sample collection (Fig. 3A). PES membranes (Ref. SF15161 Tisch scientific, Cleves, OH) were used for sampling of the corneal surface. An immunoassay was applied for specific detection of fungal presence. The PES membranes were cut to obtain a dimension of approximately 4 × 4 mm2 and adhered to a sample collection stick using double sided tape. This size permits easy collection of the sample from the cornea. After sample collection, the PES membranes together with double sided tape were removed from the sample collection stick and adhered to a standard glass slide KIT. The resulting KIT allowed for monitoring the fluorescence on each membrane individually (Fig. 3C-E).
For all cornea, the samples were collected through placement of the PES membrane on the corneal epithelial surface with gentle pressure for three seconds (Fig. 3B). For negative control corneas, only one sample was collected. In corneas with fungal inoculation, three consecutive samples were collected from the same location on each cornea. This process was done for the Candida albicans inoculated cornea and its negative control cornea. Then also conducted for the Aspergillus fumigatus inoculated cornea and its negative control cornea. The PES membranes were removed from the sample collectors and secured to a glass slide with the orientation depicted (Fig. 3C-E). We call this glass slide KIT.
Two additional membranes were placed onto the glass slide KIT for each fungus. The first additional membrane was used as a positive control and 10 µL of Candida albicans or Aspergillus fumigatus stock suspension were pipetted onto the PES membrane. The second membrane acted as a donkey serum based negative control. All samples were kept at 4 °C for same day processing.
In situ fluorescence monitoring on the membranes through immunoassayAn immunoassay methodology was applied to stain the collected samples. The same bioreagents used for the monitoring in the corneas were also used for monitoring the membranes. However, the immunoassay steps were adapted into the following steps: immobilization or sample collection, blocking to avoid the unspecific adsorption, specific recognition with primary antibody, and development with a labeled secondary antibody. This process was previously optimized to ensure a correct specific detection of the collected samples coming from the inoculated ex vivo corneas with Aspergillus fumigatus, Candida albicans, and non inoculated corneas as negative control on the PES membranes. Also a positive and negative control was considered to ensure that the results of the specific detection of the fungal infections considered were significant.
Figure 3C and D show the different membranes employed for controls and samples collected, positive control (fungal suspension), negative control (donkey serum), cornea control (non-inoculated cornea) and the corresponding collection of the inoculated corneas. For the donkey serum negative controls and for the fungal suspension positive controls the first step was performed by immobilization of the respective solutions onto their PES membranes. In the case of the negative control 5 µL of 1:2 diluted donkey serum was pipetted onto the PES membrane. For the fungal suspension positive control, the first step was conducted by pipetting 5 µL of fungal dilution (106 CFU/mL) onto its respective membranes (See Fig. 3C).
For all other samples, the first step was conducted through PES sample collection from their respective corneas and by transfer of the PES membrane onto the glass slide KITs in their respective positions (Fig. 3B-C).
For this immobilization collection step an incubation time of 1 h at 37 ºC was used followed by a washing step involving submerging of the KITs into a 50 mL Falcon tube containing ultrapure water and gentle shaking for 10 min.
After immobilization, a blocking step was performed to avoid the nonspecific adsorption. This was carried out by pipetting 5 µL of donkey serum on all membranes of the KIT. The KITs were then incubated for 30 min at 37 ºC in a humid chamber and a washing step of 10 min was conducted as described before.
For fungal recognition, the same specific polyclonal antibodies against Aspergillus fumigatus and Candida albicans mentioned prior were applied by pipetting 5 µL of the corresponding antibodies in all membranes of the KITs. An incubation of 3 h at 37 ºC in a humid chamber was performed followed by 10 min of washing with shaking.
Finally, the same secondary antibody mentioned prior (goat anti-Rabbit antibody conjugated with Alexa Fluor 594) was used for developing the cornea and 5 µL of the secondary was applied to each membrane of the KIT. The KITs were incubated for 1.5 h at 37 ºC in humid conditions. The assay was concluded with a final 10 min washing step under shaking conditions. The KITs were dried with air prior to imaging.
The resulting KITs slides were imaged using a Keyence BZ-X810 (Keyence, Osaka, JP) fluorescent microscope which conditions were optimized for Candia and Aspergillus resulting in standard resolution at 0.5 s acquisition time for Candida and high resolution with an acquisition time of 1 s for Aspergillus. It is very important to remark that these PES membranes were of a size about 4 × 4 mm2 and the microscope objective employed for the evaluation of each membrane was 4x, with a numerical aperture of 0.2, a working distance of 20 mm that permit a field of view of 3.623 × 2.728 mm2, a size similar to the whole size of the corresponding membranes.
The images were centered around the PES membranes and were acquired using the same exposure time. For analysis, every red pixel in the image was counted and grouped by red tone value. Mean red tone for each image was calculated and the standard error of this mean was computed.
Fig. 3
A.- Plate with the ex-vivo corneas. B.- Detail of a cornea where the collection with the PES membrane takes place. C.- Layout of the glass slides KITs containing membranes adhered with double-sided tape for Aspergillus evaluation. D.- Layout of the glass slides KITs containing membranes adhered with double-sided tape for Candida evaluation. E.- Practical implementation of the glass slide KITs. It is in these KITs where the immunoassay is carried out
In situ fluorescence monitoring on the corneas through immunoassayThe resulting corneas were preserved using 4% paraformaldehyde diluted in PBS for six hours. They were then transferred into a solution of 30% sucrose for deswelling until corneas were observed to have dropped to the bottom of their respective solutions. Each cornea was then divided into four quadrants (Fig. 1D). For inoculations of Aspergillus fumigatus, the superficial mycelium overlying the cornea was also separately removed, divided into quadrants, and imaged.
Each tissue was specifically recognized with primary antibodies for Candida albicans and Aspergillus fumigatus and incubated. Immunoassays were carried out to monitor the corresponding fungal infections on the corneas. Specific rabbit IgG polyclonal antibodies against Aspergillus fumigatus (ThermoFisher Scientific Ref. PA1-7202, Waltham, MA) and against Candida albicans (ThermoFisher Scientific Ref. PA1-7206, Waltham, MA) were prepared at a concentration of 40 µg/mL, pipetted directly into the plates completely covering the corneal cuts, and incubated for 3 h with humidity at 37 °C. After incubation, the corneas were washed with DPBS. Next, the corneas were developed with the secondary goat anti-rabbit antibody conjugated with Alexa Fluor 594 (ThemoFisher Scientific, Waltham, MA) with excitation from 561 nm to 594 nm and emission in the red spectral range. A concentration of 4 µg/mL was pipetted completely covering the cornea and incubated for 1.5 h at 37 ºC. The cornea was washed with DPBS. For all corneas, one set of corneal cuts was kept in DPBS to act as a baseline negative control. This process was implemented under the optimization of previous experiments to ensure a correct monitoring of the infection on ex vivo corneas and to be sure of the correct infection of the corneas with Aspergillus fumigatus and Candida albicans in comparison with the uninfected corneas used as negative control. We monitored the whole pieces of cornea with the different microscope objectives observing homogeneity and we concluded that there were not significant differences of the inoculation.
After this, the corneas were ready for fluorescent monitoring. The resulting tissues were imaged using a Keyence BZ-X810 (Keyence, Osaka, JP) fluorescence microscope (Fig. 2C-D) with microscope objectives 10x (field of view 1.449 × 1.091 mm2) and 20x (field of view 0.725 × 0.546 mm2). Images for 4x (field of view 3.623 × 2,728 mm2) can be observed in supplementary information.
Statistical analysisFluorescent images were acquired and centered around the membranes placed on the KITs. To compare the different experimental outcomes, Fig. 8 (for Candida albicans) and Fig. 9 (for Aspergillus fumigatus) shows the results obtained in the corresponding glass slide KITs, where the different PES membranes were placed: A.-negative versus positive controls (dilution of donkey serum versus fungal dilution), B.- Cornea negative control (cornea without fungal inoculation) versus cornea positive control (cornea with fungal inoculation) and C.- different fungal collections in infected corneas. For each fluorescent membrane image, a histogram was produced. In other words, the number of pixels with each possible red tone (from 0 to 255) was counted and graphed. Next, the statistical expected value of the red tone or average signal was calculated for each image as follows: We firstly obtained the corresponding histograms of the immunofluorescence experimental results observed in the different PES membranes or experiments. The total number of points of the image analyzed for each membrane were 2,764,800 for obtaining these corresponding histograms in each PES membrane. The different levels of red intensity, or red tone, obtained in the image of each PES membrane is developed by using a secondary goat anti-rabbit antibody conjugated with Alexa Fluor 594, whose fluorescence emission is in red tone. Thus, the red tone value obtained was divided in 255 levels to construct the histograms for each experiment. This can be observed in the corresponding Fig. 8 (for Candida albicans) and 9 (for Aspergillus fumigatus) of the manuscript. Thus, for each histogram we obtained the statistical expected value (weighted red tone average, \(\:E\left(x\right)=\stackrel\)) of the red tone, or in other words, the average red value of each PES membrane or experiment carried out. This expected value mathematically defined as the red tone average of each experiment, is calculated by the equation:
\(\:E\left(x\right)=\sum\:__\) Eq. 1
Where \(\:_\) is the red tone from i = 0 to i = 255 levels represented in the horizontal axis (x-axis, or abscissa) in each of the histograms of Figs. 8 and 9, which in turn represent the results of each of the experiments performed. It should be noted that each membrane corresponds to its own experiment. Thus, \(\:_\) is the weighted red intensity (y-axis or ordinate axis of the histogram) calculated as the intensity at each red tone, where \(\:_\) is the number of pixels for each red tone, divided by the total intensity. This intensity is obtained in the histogram as the number of pixels observed in each corresponding red tone. Therefore, we obtained \(\:_\) as follows:
Finally the standard error of the average or the statistical expected value (weighted red tone average) was calculated to obtain the uncertainty of the measurement for each signal of the image. After the calculation of the expected value the variance of the red tone is calculated by the equation:
\(\:Var\:\left(x\right)=\varSigma\:_-\stackrel\right)}^\:_\:\) Eq. 3
and thus, it can be easily calculate the experimental standard deviation (s) as the square root of the variance (\(\:Var\:\left(x\right)\). The standard uncertainty u(x) of the average red tone (\(\:\underset\)) or the statistical standard error can be calculated following the recommendation of the Guide to the expression of Uncertainty in Measurement (GUM) as:
\(\:u\left(\stackrel\right)=\frac}\) Eq. 4
where the estimated \(\:\mu\:\) is \(\:\underset\) corresponding to the average red tone \(\:E\left(x\right)\) and “i” is the number of statistical samples, for this case the 255 red tones considered for the constructed histogram. we can consider the expanded uncertainty as:
\(\:\left(\stackrel\right)=\:k\cdot\:\:u\:\left(\stackrel\right)\) Eq. 5
where k is the coverage factor. The value of the coverage factor k is chosen on the basis of the level of confidence required and generally, k will be in the range 2 (for an estimated significance level of 95%) to 3 (for a significance level of 99%). We have calculated the error bars for a coverage factor of k = 3, and therefore the estimated significance level is 99% [31]. The resulting values were depicted as bar graphs (Figs. 8 and 9) which values were very small. Differences between average red signal values were considered significant if they had non-overlapping the expanded statistical uncertainty. Moreover, a difference of means test was carried out to ensure the evidence of the reported results.
Comments (0)