
Remember me
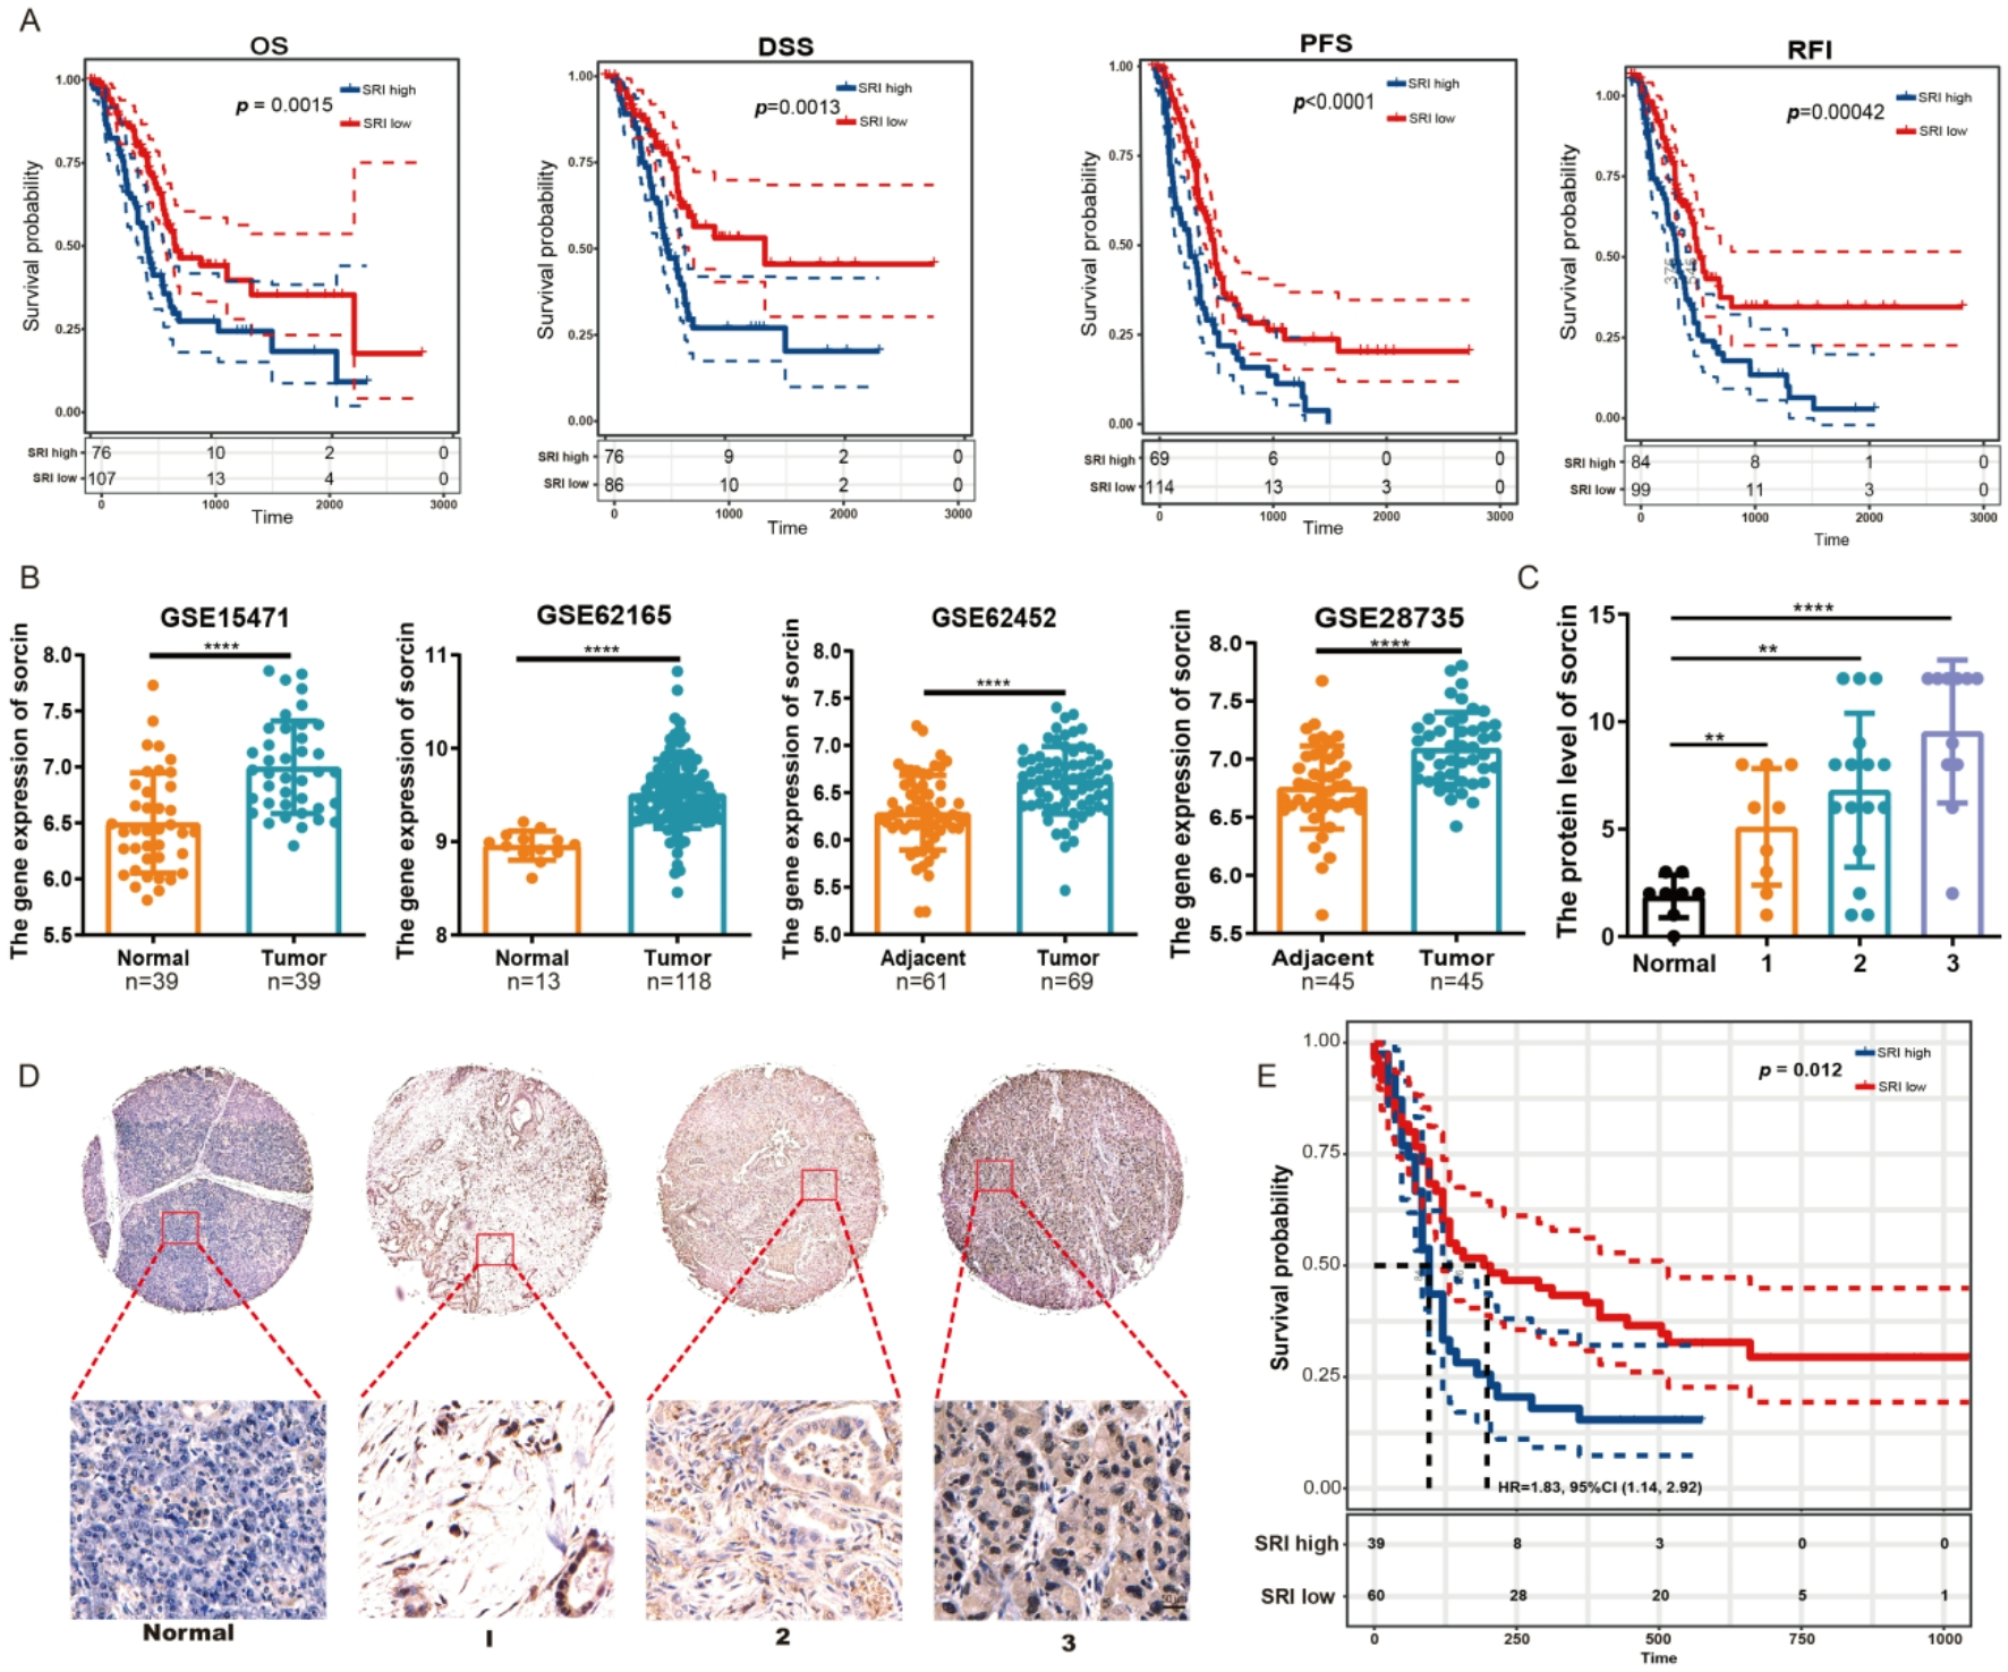


To evaluate the potential relationship between sorcin function and cancer progression, we analyzed sorcin expression in the TCGA database. The results revealed that patients in the high sorcin expression group exhibited significantly shorter overall survival (OS), disease-specific survival (DSS), progression-free survival (PFS) and recurrence-free interval (RFI) than those in the low sorcin expression group (Fig. 1A). Moreover, sorcin gene expression was greatly increased in tumor tissues compared with normal tissues, as shown in the GSE15471, GSE62165, GSE62452 and GSE28735 datasets (Fig. 1B). Moreover, a stage-specific analysis was performed to determine the correlation between sorcin protein levels and the clinical stage of pancreatic cancer. The immunohistochemical staining results revealed that the sorcin protein was overexpressed in pancreatic cancer tissues compared with normal pancreatic tissues, and higher sorcin protein levels were significantly associated with higher histological grades (Fig. 1C and D). In addition, an immunohistochemical assay on a tissue microarray that included samples from 98 primary pancreatic cancer patients revealed that high sorcin protein levels were significantly associated with poor overall survival (P < 0.05) (Fig. 1E). These results revealed that sorcin might participate in pancreatic cancer progression and may represent a novel prognostic index for predicting the progression of pancreatic cancer or the overall survival of patients with pancreatic cancer.
Fig. 1
Sorcin was overexpressed in cancer tissues and its overexpression was correlated with survival. (A) Survival analysis, including analysis of overall survival (OS), disease-specific survival (DSS), progression-free survival (PFS) and the recurrence-free interval (RFI), of patients with pancreatic cancer with different sorcin expression levels in the TCGA database. (B) Sorcin gene expression levels in normal and tumor tissues in GEO datasets, including the GSE15471, GSE62165, GSE62452 and GSE28735 datasets. (C) IHC analysis of sorcin protein levels in pancreatic cancer tissues of different clinical stages. (D) Representative images of immunohistochemical staining for sorcin protein expression in normal pancreatic tissues and pancreatic cancer tissues of different stages. (E) Overall survival analysis of 98 patients with pancreatic cancer stratified according to sorcin expression
Sorcin promoted pancreatic cancer progressionThe function of sorcin in pancreatic cancer is still unclear. To analyze the effect of sorcin on cancer progression, the expression levels of the endogenous sorcin gene in pancreatic cancer cell lines were measured. The results indicated that sorcin was highly expressed in PANC-1, Capan-2 and AsPC-1 cells (Fig. 2A). ALDH1A1, which promotes the self-renewal of cancer stem cells (CSCs) and contributes to cancer progression, is considered the most important biomarker of CSCs. Our results indicated that ALDH1A1 expression was significantly reduced after sorcin knockdown but obviously increased after sorcin overexpression in PANC-1, AsPC-1, Capan-2, PaTu8988T and MIA Paca-2 cells (Fig. 2B). Next, we examined the effects of silencing sorcin on the migration and invasion of pancreatic cancer cells. The results demonstrated that the migration and invasion rates were obviously inhibited after sorcin knockdown but increased after sorcin overexpression (Fig. 2C and E, Figure S1). Tumorsphere formation analysis indicated that sorcin knockdown significantly reduced tumorsphere numbers, whereas sorcin overexpression markedly increased tumorsphere numbers (Fig. 2F). Additionally, the percentage of ALDH+ PANC-1 and Capan-2 cells clearly decreased after sorcin knockdown (Fig. 2G and J). Moreover, an animal assay revealed that knockdown of sorcin significantly inhibited pancreatic tumor growth (Fig. 2K and L), and an IHC assay demonstrated that ALDH1A1 expression was clearly reduced in the sorcin-knockdown group (Fig. 2M). These findings suggested that sorcin promoted cancer progression and increased ALDH1A1 abundance.
Fig. 2
Sorcin promoted pancreatic cancer progression. (A) The expression level of sorcin in pancreatic cancer cells. (B) Western blotting analysis of sorcin and ALDH1A1 expression in PANC-1, AsPC-1, Capan-2, PaTu8988T and MIA Paca-2 pancreatic cancer cells after sorcin was knocked down by shRNA or overexpressed. (C) Representative images of the migration and invasion of PANC-1, Capan-2 and AsPC-1 cells after sorcin was knocked down by shRNA or overexpressed. (D-E) Statistical analysis of the migration and invasion of PANC-1, Capan-2 and AsPC-1 cells after sorcin was knocked down by shRNA or overexpressed. (F) Representative images and statistical analysis of the tumorsphere formation rate after sorcin knockdown or overexpression. (G-H) Representative images and statistical analysis of ALDH+ PANC-1 cells after sorcin knockdown. (I-J) Representative images and statistical analysis of ALDH+ Capan-2 cells after sorcin knockdown. (K-L) Images and growth rates of tumors from mice engrafted with sorcin-knockdown PANC-1 cells, n = 5. (M) Representative images of immunohistochemical staining and statistical analysis of sorcin and ALDH1A1 expression levels in xenograft tumor tissues
Sorcin was identified as a suppressor of ferroptosisThe ALDH1 family plays important roles in the detoxification of aldehydes produced from lipid peroxidation, which accumulate to execute ferroptosis; this suggested that sorcin could mediate ferroptosis by regulating ALDH1A1 levels. We first examined the effects of silencing sorcin on the level of lipid peroxidation, which is a cardinal feature of ferroptosis. The results indicated that lipid ROS levels were clearly increased after sorcin knockdown but decreased after sorcin overexpression in PANC-1 and Capan-2 cells (Fig. 3A and H). These results suggested that sorcin knockdown promoted ferroptosis and that sorcin overexpression inhibited ferroptosis. Malondialdehyde (MDA), which is a product of membrane lipid peroxidation that is positively associated with ferroptosis, was strongly increased after sorcin knockdown but obviously reduced after sorcin overexpression (Fig. 3I and J). Furthermore, the observation of mitochondrial morphology by electron microscopy suggested that after sorcin knockdown, the number of mitochondrial cristae was reduced, the mitochondria were darkly stained, and the mitochondria were wrinkled; these phenomena are hallmark morphological features of ferroptosis (Fig. 3K).
Fig. 3
Sorcin was identified as a suppressor of ferroptosis. (A-B) Lipid ROS levels in PANC-1 cells after sorcin was knocked down by shRNA. (C-D) Lipid ROS levels in PANC-1 cells after sorcin was overexpressed. (E-F) Lipid ROS levels in Capan-2 cells after sorcin was knocked down by shRNA. (G-H) Lipid ROS levels in Capan-2 cells after sorcin was overexpressed. (I) The intensity of malondialdehyde in PANC-1 and Capan-2 cells after sorcin was knocked down by shRNA. (J) The intensity of malondialdehyde in PANC-1 and Capan-2 cells after sorcin overexpression. (K) Changes in mitochondrial morphology observed by transmission electron microscopy after sorcin was knocked down by shRNA or overexpressed. (L) Representative images and statistical analysis of the apoptosis of PANC-1 and Capan-2 cells after sorcin was knocked down by shRNA or overexpressed. (M) GSDMD-N protein levels in PANC-1 and Capan-2 cells after sorcin was knocked down by shRNA. (N) GSDMD-N protein levels in sorcin-knockdown cells after incubation with liproxstatin-1
To investigate the multiple forms of cell death that are induced by sorcin, we assessed the apoptosis of sorcin-knockdown and sorcin-overexpressing cells by flow cytometry. The results revealed no significant change in the rate of apoptosis, which suggested that the primary function of sorcin was not to induce apoptosis (Fig. 3L). The pyroptosis-related protein GSDMD-N-terminal domain (GSDMD-N) is the ultimate executor of pyroptosis. We then analyzed the GSDMD-N levels in sorcin-knockdown cells by Western blotting, and the results revealed that the GSDMD-N levels were strongly increased after sorcin knockdown; these results indicated that sorcin knockdown induced pyroptosis (Fig. 3M). Recent studies have revealed that crosstalk occurs between different forms of programmed cell death. Next, we analyzed whether the promotion of GSDMD-N cleavage was induced by ferroptosis. The results suggested that the ferroptosis inhibitor liproxstatin-1 clearly inhibited the sorcin knockdown-induced cleavage of GSDMD-N, which suggested that sorcin knockdown induced pyroptosis through ferroptosis (Fig. 3N).
Sorcin decreased susceptibility to ferroptosisTo further confirm that sorcin knockdown promoted ferroptosis, we determined whether the genetic suppression of sorcin expression enhanced susceptibility to ferroptosis. In this process, we used RSL3 and erastin, which are two specific inducers of ferroptosis. The results showed that sorcin knockdown markedly amplified the RSL3- or erastin-induced accumulation of lipid ROS (Fig. 4A and D). Additionally, sorcin overexpression obviously suppressed the RSL3- or erastin-induced accumulation of lipid ROS (Fig. 4E and H). Furthermore, sorcin knockdown clearly increased cell death after treatment with ferroptosis inducers (Fig. 4I), whereas sorcin overexpression reduced death (Fig. 4J). To investigate whether the ability of sorcin to suppress ferroptosis resulted in the metastasis of pancreatic cancer, a transwell assay was performed with the combination of sorcin knockdown with ferroptosis inducers or ferroptosis inhibitors. The combination of sorcin knockdown with ferroptosis inducers had synergistic effects on migration and invasion, whereas the combination of sorcin knockdown with ferroptosis inhibitors had antagonistic effects on migration and invasion (Fig. 4K and N). These results suggested that sorcin knockdown increased the susceptibility to ferroptosis induced by ferroptosis inducers.
Fig. 4
Sorcin decreased susceptibility to ferroptosis. (A-D) Representative images and statistical analysis of lipid ROS levels in shRNA-induced sorcin-knockdown cells after treatment with RSL3 or erastin for 48 h. (E-H) Representative images and statistical analysis of lipid ROS levels in sorcin-overexpressing cells after treatment with RSL3 or erastin for 48 h. (I) Analysis of the viability of shRNA-induced sorcin-knockdown cells after treatment with RSL3 or erastin for 36 h. (J) Analysis of the viability of sorcin-overexpressing cells after treatment with RSL3 or erastin for 48 h. (K) Statistical analysis of the migration of the indicated PANC-1 and Capan-2 cells after treatment with RSL3 (0.5 µM), erastin (1 µM), Ferro (5 µM), or Lipro (2 µM) for 48 h. (L) Representative images of the migration of the indicated Capan-2 cells. (M) Statistical analysis of the invasion of the indicated PANC-1 and Capan-2 cells after treatment with RSL3 (0.5 µM), erastin (1 µM), Ferro (5 µM), or Lipro (2 µM) for 48 h. (N) Representative images of cell invasion of the indicated Capan-2 cells
Sorcin suppressed ferroptosis by regulating ALDH1A1 abundanceTo further determine whether sorcin regulates ferroptosis by regulating ALDH1A1 expression, we first investigated the effect of ALDH1A1 on ferroptosis. We then constructed stable ALDH1A1-knockdown cell lines and detected lipid ROS with a fluorescent probe and flow cytometry. The results suggested that lipid ROS levels were strongly increased after ALDH1A1 knockdown in PANC-1 and Capan-2 cells (Fig. 5A and D). The malondialdehyde levels were also significantly increased after ALDH1A1 expression was suppressed (Fig. 5E). The Transwell results indicated that the migration and invasion of pancreatic cancer cells were obviously decreased after ALDH1A1 knockdown (Fig. 5F and G). Furthermore, suppression of ALDH1A1 expression clearly amplified the cell death that was induced by ferroptosis inducers (Fig. 5H). Additionally, lipid ROS intensity assays suggested that ALDH1A1 knockdown further increased erastin-induced and RSL3-induced increases in lipid ROS levels (Fig. 5I and J), and this effect was negatively correlated with ferroptosis inducer-mediated cell viability (Fig. 5K). These results indicate that ALDH1A1 was involved in ferroptosis and that the knockdown of ALDH1A1 induced ferroptosis.
Fig. 5
Sorcin suppressed ferroptosis by regulating ALDH1A1 abundance. (A) Western blotting analysis of ALDH1A1 protein levels in negative control and shRNA-induced ALDH1A1-knockdown PANC-1 cells. (B) Representative images and statistical analysis of lipid ROS intensity in PANC-1 cells after ALDH1A1 was knocked down by shRNA. (C) Western blotting analysis of ALDH1A1 protein levels in negative control and ALDH1A1-knockdown Capan-2 cells. (D) Representative images and statistical analysis of lipid ROS intensity in Capan-2 cells after ALDH1A1 was knocked down by shRNA. (E) Analysis of malondialdehyde intensity in PANC-1 and Capan-2 cells after ALDH1A1 was knocked down by shRNA. (F) Representative images of PANC-1 cell migration and invasion after ALDH1A1 was knocked down by shRNA. (G) Statistical analysis of PANC-1 cell migration and invasion after ALDH1A1 was knocked down by shRNA. (H) Analysis of the viability of the indicated PANC-1 and Capan-2 cells after treatment with RSL3 or erastin for 36 h. (I-J) Representative images and statistical analysis of lipid ROS levels in the indicated PANC-1 and Capan-2 cells after treatment with RSL3 (0.5 µM) or erastin (1 µM) for 48 h. (K) Comparison of the viability and lipid ROS levels of the indicated cells after treatment with RSL3 or erastin. (L) Representative images and statistical analysis of lipid ROS levels after treatment with DEAB for 48 h. (M) Representative images and statistical analysis of lipid ROS levels after treatment with disulfiram (DSF) for 48 h. (N) Viability of the indicated PANC-1 and Capan-2 cells treated with DEAB combined with RSL3 or erastin for 72 h. (O-P) Viability of the indicated PANC-1 and Capan-2 cells treated with DSF combined with RSL3 or erastin for 72 h. (Q) Representative images and statistical analysis of lipid ROS levels in sorcin-knockdown PANC-1 cells after transfection with the ALDH1A1 plasmid. (R) Representative images and statistical analysis of lipid ROS levels in sorcin-knockdown Capan-2 cells after transfection with the ALDH1A1 plasmid
On the basis of the results described above, we hypothesized that ALDH1A1 enzyme inhibitors may also induce ferroptosis in pancreatic cancer cells. As a result, ALDH1A1 enzyme inhibitors, including disulfiram (DSF) and 4-diethylaminobenzaldehyde (DEAB), were selected. The results suggested that DSF and DEAB both increased the lipid ROS intensity in a dose-dependent manner, which further demonstrated the effect of ALDH1A1 on ferroptosis (Fig. 5L and M). Moreover, the results of the cell viability assays suggested that DSF and DEAB promoted erastin-induced and RSL3-induced cell death (Fig. 5N and P).
To further confirm the regulatory relationship between sorcin and ALDH1A1 in the induction of ferroptosis, we transfected an ALDH1A1-overexpressing plasmid into sorcin-knockdown cells and measured lipid ROS levels by flow cytometry. These results suggested that ALDH1A1 expression can rescue sorcin knockdown-induced ferroptosis, which suggested that sorcin knockdown induced ferroptosis by inhibiting ALDH1A1 abundance (Fig. 5Q and R).
These data demonstrated that ALDH1A1 was involved in ferroptosis and that sorcin mediated ferroptosis by regulating ALDH1A1 abundance.
Sorcin regulated ALDH1A1 levels through its noncalcium binding functionSorcin participates in the regulation of calcium homeostasis by binding to calcium. Therefore, silencing sorcin would be expected to increase the level of intracellular Ca2+. We compared endogenous calcium levels after sorcin knockdown, and the results showed that the knockdown of sorcin could increase the calcium levels (Fig. 6A and B). The addition of the calcium chelating agent BAPTA-AM reduced ALDH1A1 expression. Moreover, the addition of BAPTA-AM increased the sorcin knockdown-mediated inhibition of ALDH1A1 expression (Fig. 6C). These results suggested that Ca2+ might promote ALDH1A1 expression. Since the knockdown of sorcin significantly reduced the expression of ALDH1A1, sorcin performed a noncalcium binding function in regulating the ALDH1A1 level. However, the detailed mechanism is still not clear.
Fig. 6
Sorcin regulated ALDH1A1 levels through its noncalcium binding function
To further elucidate the mechanism by which sorcin regulates ALDH1A1 abundance, a proteomics assay was performed, and the proteins whose expression changed the most were analyzed. The results suggested that FBXL12 expression was most significantly changed after sorcin knockdown compared with negative control, and this result indicated that sorcin may regulate FBXL12 expression (Fig. 6D). The gene expression assay revealed that FBXL12 gene expression was significantly increased after sorcin knockdown but decreased after sorcin overexpression (Fig. 6E). Western blotting analysis demonstrated that sorcin knockdown increased FBXL12 protein expression and that sorcin overexpression decreased FBXL12 protein expression in PANC-1, Capan-2 and AsPC-1 cells (Fig. 6F and I). We then explored FBXL12 expression in primary pancreatic cancer tissues and adjacent tissues via an IHC assay, and the results suggested that FBXL12 was expressed at lower levels in cancer tissues than in adjacent normal tissues (Fig. 6J and K). Furthermore, the clinical correlation between FBXL12 gene expression and survival time in the TCGA database was analyzed. The results revealed that low FBXL12 gene expression was significantly associated with poor disease-specific survival (DSS), overall survival (OS), progression-free interval (PFI), progression-free survival (PFS) and the recurrence-free interval (RFI) (Fig. 6L). These results indicated that sorcin regulated ALDH1A1 protein levels by altering FBXL12 gene expression and that FBXL12 was negatively correlated with tumorigenesis.
FBXL12 inhibited pancreatic cancer progression by inhibiting ALDH1A1 levelsTo further elucidate the function of FBXL12 in pancreatic cancer progression, Transwell, tumorsphere and Western blotting assays were performed. The Transwell assay results revealed that the migration of pancreatic cancer cells was strongly increased after FBXL12 knockdown but reduced after FBXL12 overexpression (Fig. 7A and B). The tumorsphere formation rate was significantly increased after FBXL12 knockdown but decreased after FBXL12 overexpression (Fig. 7C and D). Western blotting analysis revealed that the ALDH1A1 levels were increased after FBXL12 knockdown but reduced after FBXL12 overexpression (Fig. 7E and F).
Fig. 7
FBXL12 inhibited pancreatic cancer progression by inhibiting ALDH1A1 levels. (A) Representative images of PANC-1 and Capan-2 cell migration after FBXL12 was knocked down by siRNA or overexpressed. (B) Statistical analysis of cell migration after FBXL12 was knocked down by siRNA or overexpressed. (C) Representative images of tumorsphere formation by PANC-1 and Capan-2 cells after FBXL12 was knocked down by siRNA or overexpressed. (D) Statistical analysis of tumorsphere formation after FBXL12 was knocked down by siRNA or overexpressed. (E-F) Western blotting analysis and statistical analysis of FBXL12 and ALDH1A1 expression in PANC-1, Capan-2 and AsPC-1 cells after FBXL12 was knocked down by siRNA or overexpressed. (G) Representative images of lipid ROS levels in sorcin-knockdown cells after transfection with FBXL12 siRNAs. (H) Statistical analysis of lipid ROS levels in sorcin-knockdown cells after transfection with FBXL12 siRNAs. (I) Western blotting analysis of ALDH1A1 expression in sorcin-knockdown cells after transfection with FBXL12 siRNAs
To determine whether sorcin regulated ALDH1A1 levels to induce ferroptosis via FBXL12, a rescue experiment was performed. FBXL12 siRNA was transfected into sorcin-knockdown cells, after which the ALDH1A1 levels and lipid ROS levels were analyzed. The flow cytometry results suggested that FBXL12 knockdown suppressed sorcin knockdown-induced increase in lipid ROS levels, which suggested that FBXL12 knockdown suppressed sorcin knockdown-induced ferroptosis (Fig. 7G and H). Furthermore, the Western blotting results indicated that FBXL12 knockdown reversed the sorcin knockdown-induced reducing in ALDH1A1 levels (Fig. 7I). These results indicated that sorcin regulated ALDH1A1 abundance through FBXL12.
FBXL12 mediated ALDH1A1 ubiquitinationFBXL12 plays important roles in a wide variety of cellular functions by mediating ubiquitination. To determine whether FBXL12 mediated ALDH1A1 ubiquitylation in pancreatic cancer cells, we treated pancreatic cancer cells with the proteasome inhibitor MG132 and the protein synthesis inhibitor cycloheximide (CHX). The results showed that ALDH1A1 protein levels increased after treatment with MG132 in a time-dependent and dose-dependent manner (Fig. 8A and C, S2A), whereas ALDH1A1 protein levels decreased after treatment with cycloheximide in a time-dependent and dose-dependent manner (Fig. 8B and D, S2B); these results suggested that ALDH1A1 was modified by ubiquitination. Moreover, FBXL12 knockdown inhibited the effect of cycloheximide on ALDH1A1 degradation, indicating that FBXL12 is involved in the ubiquitination and degradation of ALDH1A1 (Fig. 8E and F). To further analyze whether ALDH1A1 ubiquitylation was mediated by FBXL12, an immunofluorescence assay and a coimmunoprecipitation assay were performed. Immunofluorescence analysis revealed that ALDH1A1 colocalized with FBXL12 in PANC-1 and Capan-2 cells (Fig. 8G). Additionally, the interaction between FBXL12 and ALDH1A1 after overexpression of a Flag-tagged FBXL12 protein was analyzed by coimmunoprecipitation with an anti-Flag antibody; the results suggested that FBXL12 directly interacted with ALDH1A1 (Fig. 8H). The interaction between FBXL12 and ALDH1A1 was further confirmed by overexpressing an HA-tagged ALDH1A1 protein and performing coimmunoprecipitation with an anti-HA antibody (Fig. 8I). Moreover, we verified that the level of ubiquitinated ALDH1A1 was obviously decreased after FBXL12 knockdown but increased after FBXL12 overexpression (Fig. 8J). Finally, coimmunoprecipitation analysis with an anti-ubiquitin antibody revealed that ALDH1A1 was ubiquitinated (Fig. 8K). Taken together, these results suggested that sorcin regulated the gene expression of FBXL12 and that FBXL12 is an authentic E3 ligase that regulated the ubiquitination and degradation of ALDH1A1.
Fig. 8
FBXL12 mediated ALDH1A1 ubiquitination. (A) Western blotting analysis of ALDH1A1 protein levels in PANC-1, Capan-2 and AsPC-1 cells after treatment with MG132 at 10 µM for the indicated times. (B) Western blotting analysis of ALDH1A1 protein levels in PANC-1, Capan-2 and AsPC-1 cells after treatment with the protein synthesis inhibitor cycloheximide at 10 µM for the indicated times. (C) Statistical analysis of ALDH1A1 protein levels in PANC-1, Capan-2 and AsPC-1 cells after treatment with MG132 at 10 µM for the indicated times. (D) Statistical analysis of ALDH1A1 protein levels in PANC-1, Capan-2 and AsPC-1 cells after treatment with CHX at 10 µM for the indicated times. (E) Western blotting analysis of ALDH1A1 protein levels in FBXL12-knockdown PANC-1, Capan-2 and AsPC-1 cells after treatment with CHX at 10 µM for the indicated times. (F) Statistical analysis of ALDH1A1 protein levels in shRNA-induced FBXL12-knockdown cells after treatment with CHX at 10 µM for the indicated times. (G) Immunofluorescence analysis of ALDH1A1 colocalization with FBXL12 in PANC-1 and Capan-2 cells. (H) Analysis of the interaction between FBXL12 and ALDH1A1 after transfection with the pCMV-Flag-FBXL12 vector by coimmunoprecipitation with an anti-Flag antibody followed by Western blotting analysis. (I) Analysis of the interaction between FBXL12 and ALDH1A1 after transfection with the pCMV-HA-ALDH1A1 vector by coimmunoprecipitation with an HA antibody followed by Western blotting analysis. (J) Analysis of ALDH1A1 ubiquitylation after FBXL12 knockdown or overexpression by coimmunoprecipitation. (K) Analysis of the ubiquitylation of ALDH1A1 by coimmunoprecipitation with an anti-ubiquitin antibody followed by Western blotting analysis with antibodies against the indicated proteins
Sorcin mediated the nuclear translocation of PAX5 to regulate FBXL12 transcriptionTo identify the specific mechanism by which sorcin regulated FBXL12 to affect ALDH1A1 levels, proteomics results were analyzed. The GO analysis results indicated that the primary functions of the sorcin protein might be interacting with proteins and transcription factors (Fig. 9A and B). As a result, we hypothesized that sorcin would bind to some transcription factors that regulate FBXL12 transcription. However, the transcription factor that regulates FBXL12 has rarely been studied. To explore the transcription factors that regulate the gene expression of FBXL12, fragments of the FBXL12 promoter sequence named P1 (nucleotides − 1750 - +251), P2 (nucleotides − 1750 - -1250), P3 (nucleotides − 1250 - -750), P4 (nucleotides − 1750 - -750), P5 (nucleotides − 1750 - -492), and P6 (nucleotides − 492 - +251) were inserted into the pGL3-basic vector (Fig. 9C). The luciferase signals of P6 were significantly greater than the luciferase signals of P1, P2, P3, P4 and P5 in PANC-1 and Capan-2 cells (Fig. 9D). These results indicated that P6 was the core promoter region. We predicted the transcription factor that regulates FBXL12 expression by analyzing the core promoter region with http://alggen.lsi.upc.es/ (Fig. 9E). The transcription factor PAX5 exhibited the highest frequency of occurrence, and PAX5 was hypothesized to be the main transcription factor that regulates FBXL12 expression. Furthermore, the binding site of PAX5 in the promoter was determined by a Ch-IP assay. The results suggested that site 2 and site 4 were the main binding sites of PAX5 (Fig. 9F). Moreover, luciferase activity was greatly reduced after the PAX5 binding site 2 and site 4 were mutated, and site 2 played a more important role than site 4 (Fig. 9G). Therefore, PAX5 mainly bound to site 2 in the promoter of FBXL12. Western blotting analysis also revealed that PAX5 knockdown clearly decreased FBXL12 protein expression, whereas PAX5 overexpression increased FBXL12 protein expression in PANC-1, AsPC-1 and Capan-2 cells (Fig. 9H).
Fig. 9
Sorcin mediated the nuclear translocation of PAX5 to regulate FBXL12 transcription. (A) GO analysis of proteins whose expression significantly changed after sorcin was knocked down by shRNA according to the proteomics results. (B) GO proteomics analysis of proteins whose expression significantly changed after sorcin overexpression. (C) Schematic illustration of the cloned fragments in the human FBXL12 promoter. (D) Luciferase activity of the FBXL12 promoter fragments in PANC-1 and Capan-2 cells. (E) Base frequency rule and possible transcription factor-binding site analysis. (F) Ch-IP analysis of the five predicted PAX5 binding sites in the FBXL12 promoter sequence. IgG was used as a negative control. (G) Luciferase activity of the P6 promoter after mutation of site 2 or site 4 in PANC-1 and Capan-2 cells. (H) Western blotting analysis of PAX5, FBXL12 and ALDH1A1 expression in PANC-1, Capan-2 and AsPC-1 cells after PAX5 knockdown or overexpression. (I) Analysis of the interaction between PAX5 and sorcin after transfection with the pCMV-Flag-sorcin vector by coimmunoprecipitation with an anti-Flag antibody followed by Western blotting analysis. (J) Analysis of the interaction between PAX5 and sorcin after transfection with the pCMV-Flag-PAX5 vector by coimmunoprecipitation with an anti-Flag antibody followed by Western blotting analysis. (K) Immunofluorescence analysis of PAX5 nuclear translocation in sorcin-knockdown xenograft tumor tissues. (L) Statistical analysis of the immunofluorescence intensity of PAX5 nuclear translocation in sorcin-knockdown xenograft tumor tissues. (M) Western blotting analysis of PAX5 expression in the nucleus and cytoplasm of PANC-1, AsPC-1 and Capan-2 cells after sorcin knockdown and overexpression. (N) Immunofluorescence analysis of PAX5 levels in the nucleus and cytoplasm in PANC-1 cells after sorcin knockdown and overexpression
However, how sorcin regulates the expression of FBXL12 via PAX5 still needs to be explored. The above results prompted us to hypothesize that sorcin might interact with PAX5 and affect its nuclear translocation. First, we detected the interaction between PAX5 and sorcin after the overexpression of a Flag-tagged sorcin protein by performing a coimmunoprecipitation assay with an anti-Flag antibody, and the results suggested that PAX5 directly interacted with sorcin (Fig. 9I). Furthermore, the interaction between PAX5 and sorcin after Flag-tagged PAX5 protein overexpression was confirmed by performing a coimmunoprecipitation assay with an anti-Flag antibody (Fig. 9J). We then assessed the nuclear translocation of PAX5 by immunofluorescence, and the results revealed that the fluorescence intensity in the nuclei of xenograft tumor tissues was significantly increased after sorcin knockdown (Fig. 9K and L). Moreover, the PAX5 protein levels in the cytoplasm and nucleus were also analyzed by Western blotting. Nuclear PAX5 levels were significantly increased after sorcin knockdown and decreased after sorcin overexpression, whereas cytoplasmic PAX5 levels were significantly decreased after sorcin knockdown and increased after sorcin overexpression (Fig. 9M). Immunofluorescence staining of pancreatic cancer cells demonstrated that sorcin knockdown promoted PAX5 nuclear translocation, whereas sorcin overexpression inhibited this process (Fig. 9N). These findings indicated that the expression of sorcin was negatively correlated with the nuclear translocation of PAX5. These results demonstrated that sorcin decreased FBXL12 transcription by reducing the nuclear translocation of PAX5.
Identification of celastrol as a natural product that bound to SorcinOur findings suggested that sorcin regulates ferroptosis by interacting with PAX5, thus regulating FBXL12 gene expression and ultimately inducing ALDH1A1 ubiquitination-mediated degradation; these results indicated that sorcin may be a promising target for searches focused on identifying novel ferroptosis inducers. As a result, we endeavored to discover novel agents that induce ferroptosis by binding to sorcin. An in-house screen of 304 natural products was performed via a SPR assay (Fig. 10A), which led to the identification of celastrol, which is a naturally occurring triterpenoid (Fig. 10B) and interacted most strongly with the sorcin protein (Kd value of 2.13 µM) (Fig. 10C). Next, we evaluated the cytotoxic effects of celastrol on different pancreatic cancer cells. The cytotoxicity results suggested that celastrol inhibited the proliferation of pancreatic cancer cells, including PANC-1, Capan-2, AsPC-1 and PaTu8988T cells, in a dose-dependent manner (Fig. 10D and E). A colony formation assay revealed that celastrol strongly decreased the number of colonies (Fig. 10F). Moreover, celastrol significantly inhibited the migration of the PANC-1, AsPC-1 and Capan-2 pancreatic cell lines (Fig. 10G). Temperature-dependent cellular thermal shift assays (CETSAs) demonstrated that celastrol increased the thermal stability of the sorcin protein when exposed to high temperature (Fig. 10H and I). Moreover, a CETSA performed with different doses of celastrol suggested that celastrol increased the stability of sorcin in a dose-dependent manner, indicating a direct interaction between sorcin and celastrol (Fig. 10H and J).
Fig. 10
Identification of celastrol as a natural product that bound to sorcin
To further investigate whether celastrol directly and covalently bound to the sorcin protein in cells, we first designed and synthesized probe 2 (Fig. 10K), which has better anti-pancreatic cancer activity as celastrol (Fig. 10L). Probe 2 was used to perform an in situ click chemistry assay, and it could replace celastrol to tag the potential cellular target of celastrol in the native cellular environment. The in situ pull-down experiment further indicated that sorcin was directly pulled down by probe 2, which demonstrated that celastrol directly bound to sorcin intracellularly (Fig. 10M and N). Moreover, biotin-conjugated probe 4 was synthesized to further verify the binding effect in vitro (Fig. 10K). Pancreatic cancer cell lysates were incubated with probe 4 at different concentrations. Then, probe 4 was removed, and the proteins were incubated with streptavidin‒agarose beads overnight. After affinity purification, the proteins that were precipitated by the streptavidin‒agarose beads were resolved, followed by Western blotting analysis (Fig. 10O). The results showed that sorcin was specifically pulled down by probe 4 in a dose-dependent manner, which further confirmed that celastrol directly targeted sorcin (Fig. 10P and Q). Furthermore, we purified the sorcin protein and incubated it with celastrol alone. The binding curve of sorcin and probe 4 indicated time-dependent saturation, which was consistent with an irreversible binding mechanism with a Kobs value of 0.067/min (Fig. 10R). Celastrol bound to the sorcin protein in a dose-dependent manner, with a Ki value of 1.12 µM (Fig. 10S). Moreover, the quinine methide triterpenoid of celastrol is a reactive Michael acceptor. We hypothesized that celastrol covalently binds to the sorcin protein and that some conserved cysteine residues in sorcin may be binding sites of celastrol. To elucidate the specific binding site of celastrol, molecular docking calculations were conducted. An online tool, namely, POCASA 1.1, was used to predict the potential binding sites of small molecules, and several candidates were identified. After an analysis, the site near Cys194 was chosen as the docking pocket (Fig. 10T). To construct the structure of the covalent docking complex involving sorcin and celastrol, the pose of 5MRA was selected as the basis of manual connection between the double-bonded carbon atom and the sulfur atom of Cys194 and subsequent energy minimization. As a result, we proposed (with the aid of computer docking) that cysteine 194, which is located in the pocket of sorcin, would be the main binding site of celastrol (Fig. 10T). To verify this hypothesis, we mutated cysteine 194 in sorcin to serine. The wild-type Cys194 mutant sorcin proteins were subsequently purified, incubated with probe 4 to perform a pull-down assay, and detected by Western blotting. The results indicated that the amount of the sorcin protein that was pulled down by probe 4 was significantly reduced after cysteine 194 was mutated (Fig. 10U), which suggested that Cys194 of sorcin was critical for the covalent binding of celastrol.
Celastrol induced ferroptosis by promoting the nuclear translocation of PAX5Our mechanistic research demonstrated that sorcin interacted with PAX5, inhibiting the nuclear translocation of PAX5, thereby decreasing FBXL12 transcription, and eventually increasing ALDH1A1 protein levels to suppress ferroptosis. However, whether celastrol, which is a specific interacting partner of sorcin, affects the interaction between sorcin and PAX5 and induces ferroptosis needed to be investigated. A coimmunoprecipitation assay revealed that celastrol disrupted the interaction between sorcin and PAX5 in pancreatic cancer cells by directly targeting sorcin (Fig. 11A). Then, we detected the nuclear translocation of PAX5 by Western blotting and immunofluorescence assays. The results revealed that the nuclear PAX5 protein levels were significantly increased, whereas the cytoplasmic PAX5 protein levels were significantly decreased after celastrol treatment (Fig. 11B). The fluorescence intensity of PAX5 in the nucleus was significantly increased, whereas that in the cytoplasm was decreased after celastrol treatment (Fig. 11C). These results confirmed
Comments (0)