
Remember me
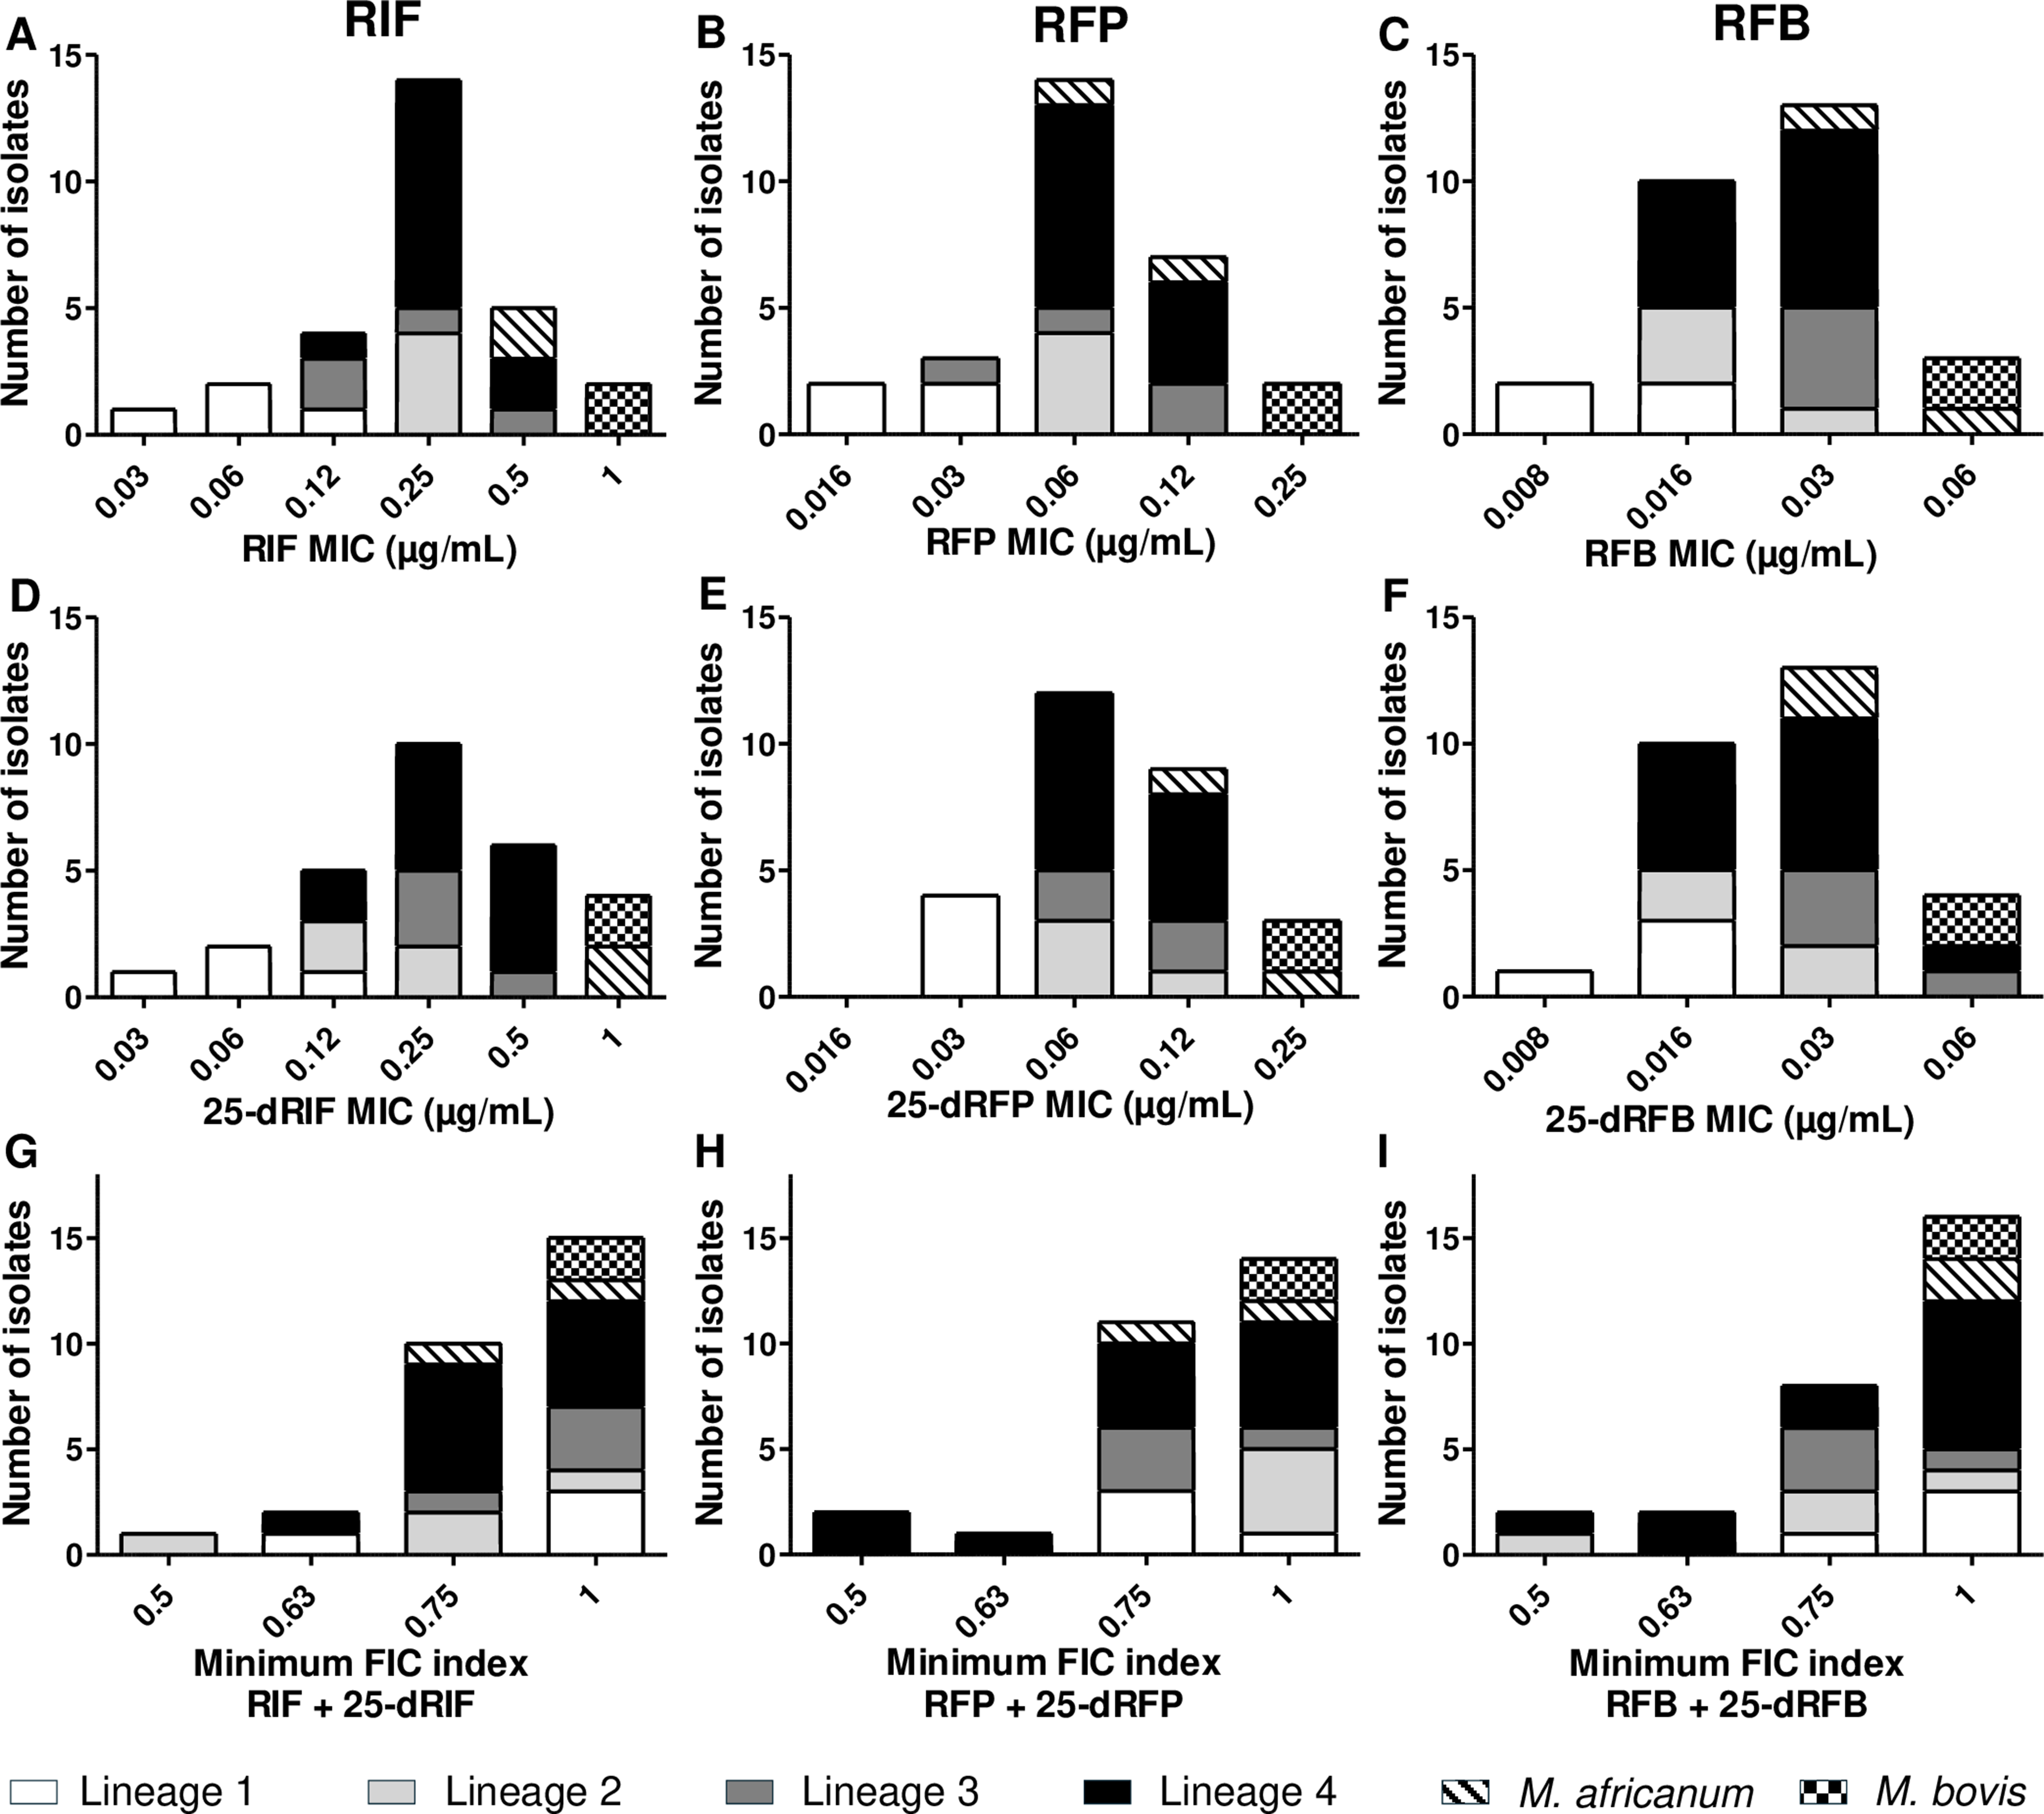


Using standard microdilution method, MICs of rifamycins and their metabolites were evaluated for the 14 MTBC strains selected (Fig. 1). For RIF and 25-dRIF, MICs ranged from 0.03 to 1 µg/mL, with the majority of strains (14/28) displaying values of 0.25 µg/mL. In comparison, MICs for RFP and 25-dRFP were generally lower, ranging from 0.016 to 0.25 µg/mL, with most strains (14/28) showing MIC of 0.06 µg/mL. RFB and 25-dRFB exhibited the lowest MICs, ranging from 0.008 to 0.06 µg/mL, with the majority of values (22/28) at 0.016–0.03 µg/mL. Strains from lineage 1 presented the lowest MICs, while M. bovis strain showed the highest values. Notably, there was no significant difference between the MICs of the rifamycins and their corresponding metabolites.
Fig. 1
MIC and minimum FIC index of rifamycins and their metabolites
Fourteen clinical MTBC strains were selected to represent the main lineages, lineage 1 (white), lineage 2 (light grey), lineage 3 (dark grey), lineage 4 (black), M. africanum (hatched) and M. bovis (checkerboard pattern). Minimum inhibitory concentrations (MIC) for rifampicin (RIF, A), rifapentine (RFP, B), rifabutine (RFB, C) and their metabolites 25-deacetyl-rifampicin (25-dRIF, D), 25-deacetyl-rifapentine (25-dRFP, E), 25-deacetyl-rifabutine (25-dRFB, F), were determined by standard microdilution assay. Minimum fractional inhibitory concentration (FIC) index for RIF + 25-dRIF, RFP + 25-dRFP and, RFB + 25-dRFB combinations were determined by checkerboard assay. FIC < 0.5 indicates synergy; FIC between 0.5 and 1 indicates an additive effect; FIC between 1 and 4 indicates no interaction; FIC > 4 indicates antagonism. Experiments were performed in duplicate.
In combination, the minimum FIC indices for RIF + 25-dRIF, RFP + 25-dRFP, and RFB + 25-dRFB were all between 0.5 and 1, indicating additive effects of all combinations (Fig. 1). The results were consistent across different MTBC lineages, with no significant influence of bacterial lineage on the interaction between rifamycins and their metabolites.
To further explore the clinical relevance of these interactions, the FIC indices were calculated at different ratios of metabolite to rifamycin (Fig. 2), based on the typical metabolite-to-parent drug ratios observed in PK/PD studies [6,7,8,9]. At a ratio of 100% and 50% 25-d-rifamycin/rifamycin, the FIC values were similar to the minimum FIC values, between 0.5 and 1.25. When the ratio of rifamycin to metabolite was reduced to 25% or 12.5%, the FIC values ranged between 0.625 and 1.25, indicating either additive effects or no significant interaction between the parent drug and its metabolite. At the lowest tested ratios of 6.2% or 3.1%, the FIC indices ranged between 1.02 and 1.13, confirming that no antagonism occurs even when the metabolite concentration was minimal. This suggests that the metabolites do not diminish the activity of the parent rifamycins and may still contribute to the overall antibacterial effect.
Fig. 2
FIC indices at various ratio of metabolite/rifamycin
Fourteen clinical MTBC strains were selected to represent the main lineages (lineage 1, lineage 2, lineage 3, lineage 4, M. africanum and M. bovis) and rifamycin and metabolite combinations were evaluated using checkerboard assay. Fractional inhibitory concentration (FIC) indices were calculated at different ratios of metabolite to rifamycin, for 25-deacetyl-rifampicin (25-dRIF) + rifampicin (RIF, A), 25-deacetyl-rifapentine (25-dRFP) + rifapentine (RFP, B) and 25-deacetyl-rifabutin (25-dRFB) + rifabutin (RFB, C). These values were compared to the minimum FIC value obtained in each experiment. FIC < 0.5 indicates synergy; FIC between 0.5 and 1 indicates an additive effect; FIC between 1 and 4 indicates no interaction; FIC > 4 indicates antagonism. Experiments were performed in duplicate. Median values were compared using the Friedman test followed by Dunn’s post-hoc test. *p < 0.05, ** p < 0.01, *** p < 0.001.
Comments (0)