
Remember me
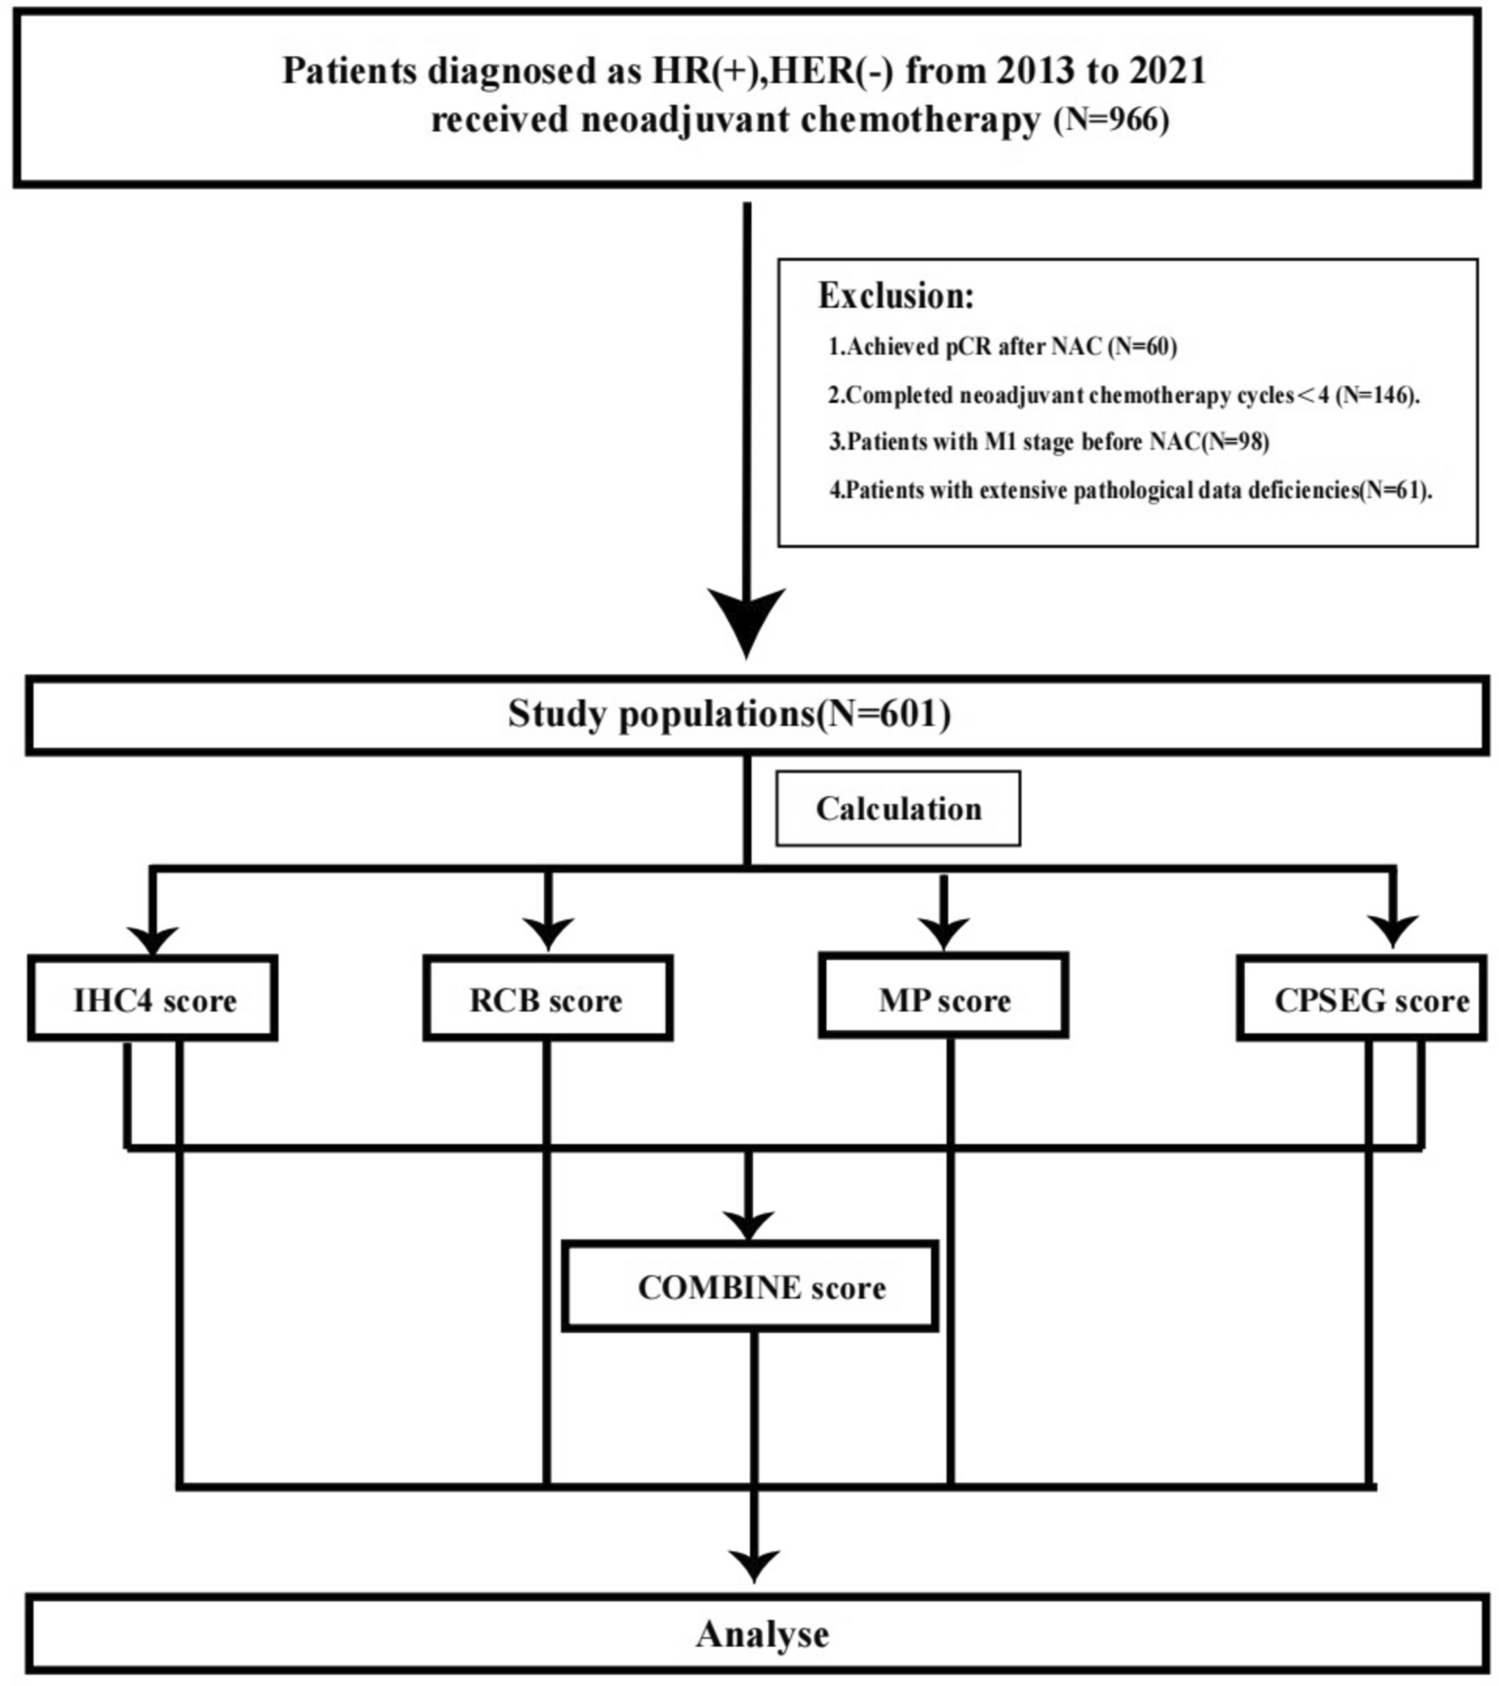
A micro-simulation Markov model to simulate DCIS, SimDCIS, was developed (Fig. 1). With the model, a virtual cohort of an arbitrarily large number of women can be created to mimic a true population. Within this cohort, each woman is followed yearly from birth until they reach one of the following states: death, IBC, screen-detection of DCIS, or clinical detection of DCIS. At every age, each individual woman has an age-dependent chance to die, and an age-dependent chance to develop DCIS. If a woman develops DCIS, she has a probability to die, remain in DCIS state, progress to IBC, regress to healthy state, or be clinically or screen- detected. The age-dependent death probability in DCIS state is equal to that in the healthy state, as DCIS without progression to IBC does not change the death probability since death of DCIS is extremely rare [6, 16]. Each DCIS grade has its own probability of regression, detection, and grade-dependent probability of progression to IBC. Direct progression from healthy to IBC is assumed to be possible but is outside the scope of this model [6]. Progression from DCIS to IBC made it possible to determine the number of DCIS cases that become invasive, which is important to consider in, for example, overdiagnosis estimations. Regression was only possible for DCIS, where regression of IBC was assumed not possible [6]. The SimDCIS model can be used to simulate different scenarios, where for one scenario, the model output can be averaged over several cohorts.
Fig. 1
Visual representation of the SimDCIS model. Transition probabilities P1 to P6 per year (y), age, and grade
Model input parametersThe model input consists of four main transition probabilities (death, DCIS onset, regression of DCIS, progression to IBC), four screening parameters (screening age, frequency, participation, sensitivity), and one clinical detection parameter. All model input parameters were independently derived from existing literature and data (Table 1).
Table 1 Input parameters of SimDCIS for the Dutch screening settingTransition probabilitiesDeath probability (P1) was age-dependent and calculated for each year of age from Dutch mortality data from 2011 from the Central Bureau of Statistics (CBS) [19]. The probability to develop DCIS (P2) was determined from the average age- and grade-dependent incidence of DCIS from the Netherlands Cancer Registry (NCR) of 2015–2022, excluding data from 2020 because of data variations due to the COVID-19 pandemic [5]. This DCIS onset probability was calculated for each age and grade. Regression (P3) was included from DCIS to a healthy state and set to 5%, independent of age and grade, as the literature showed that regression was estimated below 10% [6, 20]. If a DCIS regressed and a woman returned to healthy state, probability to transition to DCIS again remained equal to P2. The probability of DCIS progression to IBC (P4) was derived from age-dependent data from the US National Cancer Institute’s Surveillance, Epidemiology, and End Results program of 1992–2014 [21]. Grade dependency was derived from NCR data and assumed equal to grade dependency of DCIS onset [5]. Estimation of transition probabilities is described in detail in Appendix B1.
Screening parametersThe model requires the input of four screening parameters: screening age, frequency, participation, and sensitivity. Sensitivity (P5) can be adjusted, so multiple screening detection methods could be studied. For this study, the base input of the model was adjusted to the Dutch screening program (Table 1). The breast cancer screening program was rolled out across the Netherlands between 1989 and 1998 [22]. All women aged 50–75 years without a history of breast cancer are invited for a biennial mammographic examination, which has a DCIS-specific sensitivity of 86% [23, 24]. Screening participation rate was 76% in 2019 [23].
Clinical detectionA present DCIS can be either screen- or clinically detected. Clinical detection entails all detections outside of the screening program, e.g. opportunistic or high-risk screening, and symptomatic and accidental detections [7, 25]. The probability of a present DCIS to be clinically detected was 5% per year (P6), independent of age, and DCIS grade [7].
Model outputThe raw model output consists of the yearly state for each individual woman and a summary table (Appendix B2). The summary table includes the number of DCIS per grade, regressed DCIS, women removed from the model per state (death, screen detected, clinically detected, or IBC), and mammograms. In addition, the data can be used to extract the average age of all events and the detection rate per 1,000 screened women stratified by age and grade. Through comparison of multiple scenarios, additional outcomes, such as overdiagnosis rate, can also be calculated. The main model outcome can be determined to fit the research question.
ValidationTo fully validate the model, internal, external, and cross-validation were performed [18]. Internal validation of the model was performed by comparison of simulated 95% confidence intervals (95%CI) with observed NCR data from 2019 (Table 1, Appendix A1) [5]. The outcome used for internal validation was DCIS screen-detection rate (number of screen-detected DCIS per 1,000 screened women) stratified by age and grade. For this comparison, the base scenario in Dutch screening setting was simulated, with biennial screening from age 50 to 75 and 76% screening compliance [23]. External validation was performed by comparison with observed data from the National Health Service (NHS) of 2021 [26]. To simulate the UK screening setting, the base scenario was adjusted to triennial screening, screening age 50–71 years, and UK mortality rates from 2019 (Appendix A2) [26, 27]. For external validation, the main outcome was DCIS screen-detection rate stratified by age. In addition, cross-validation was performed by comparison of the number of DCIS detected in the UK Frequency trial simulated by SimDCIS and MISCAN-FADIA (Appendix A3) [28].
Sensitivity analysesTo fully analyse the robustness and uncertainty of the model, univariate sensitivity analyses (USA) and a probabilistic sensitivity analysis (PSA) were performed. USA were performed to evaluate robustness of the model. For each input parameter, the lower and upper 95%CI were applied (Appendix A4.1). Changes in DCIS screen- and all-detection rate were recorded overall, stratified by age and grade, and summarized in tornado plots. In addition, a PSA was performed to evaluate the overall model uncertainty through simulation of 100 Monte Carlo scenarios with random selection within the 95%CI of all input parameters (Appendix A5.1). The main outcome of the PSA was screen-detection rate of DCIS per 1,000 screened women.
DCIS estimatesFor each simulated scenario of the PSA (Appendix A6), output was summarized to provide an overview of DCIS estimates within SimDCIS in various circumstances within the setting of population-based screening. Included estimates were percentages of DCIS regression, progression to IBC, screen detection, clinical detection, and the distribution of grades 1, 2, and 3 in screen-detected DCIS.
Comments (0)