Patients
This prospective study was approved by the Human Ethics Review Committee of our institute and signed informed consent was obtained from all study subjects. Patient records and information were anonymized and de-identified prior to analysis.
Consecutive patients who underwent clinically indicated gadoxetic acid-enhanced MRI at our institution were enrolled between February 2023 and January 2024. The exclusion criteria were as follows: (1) pediatric patients; (2) patients who failed to achieve all HBP scanning protocols; (3) contraindications for MRI (e.g., cardiac pacemakers or metal implants).
Using the hospital information system we obtained patient data recorded within 30 days of their MRI studies. They included the patient gender and age, the serum albumin-, asparate aminotransferase (AST), alanine aminotransferase (ALT), total bilirubin, platelet levels, the prothrombin time-international normalized ratio (PT–INR), and the Child-Pugh score.
MRI protocolIntracellular enhancement technique
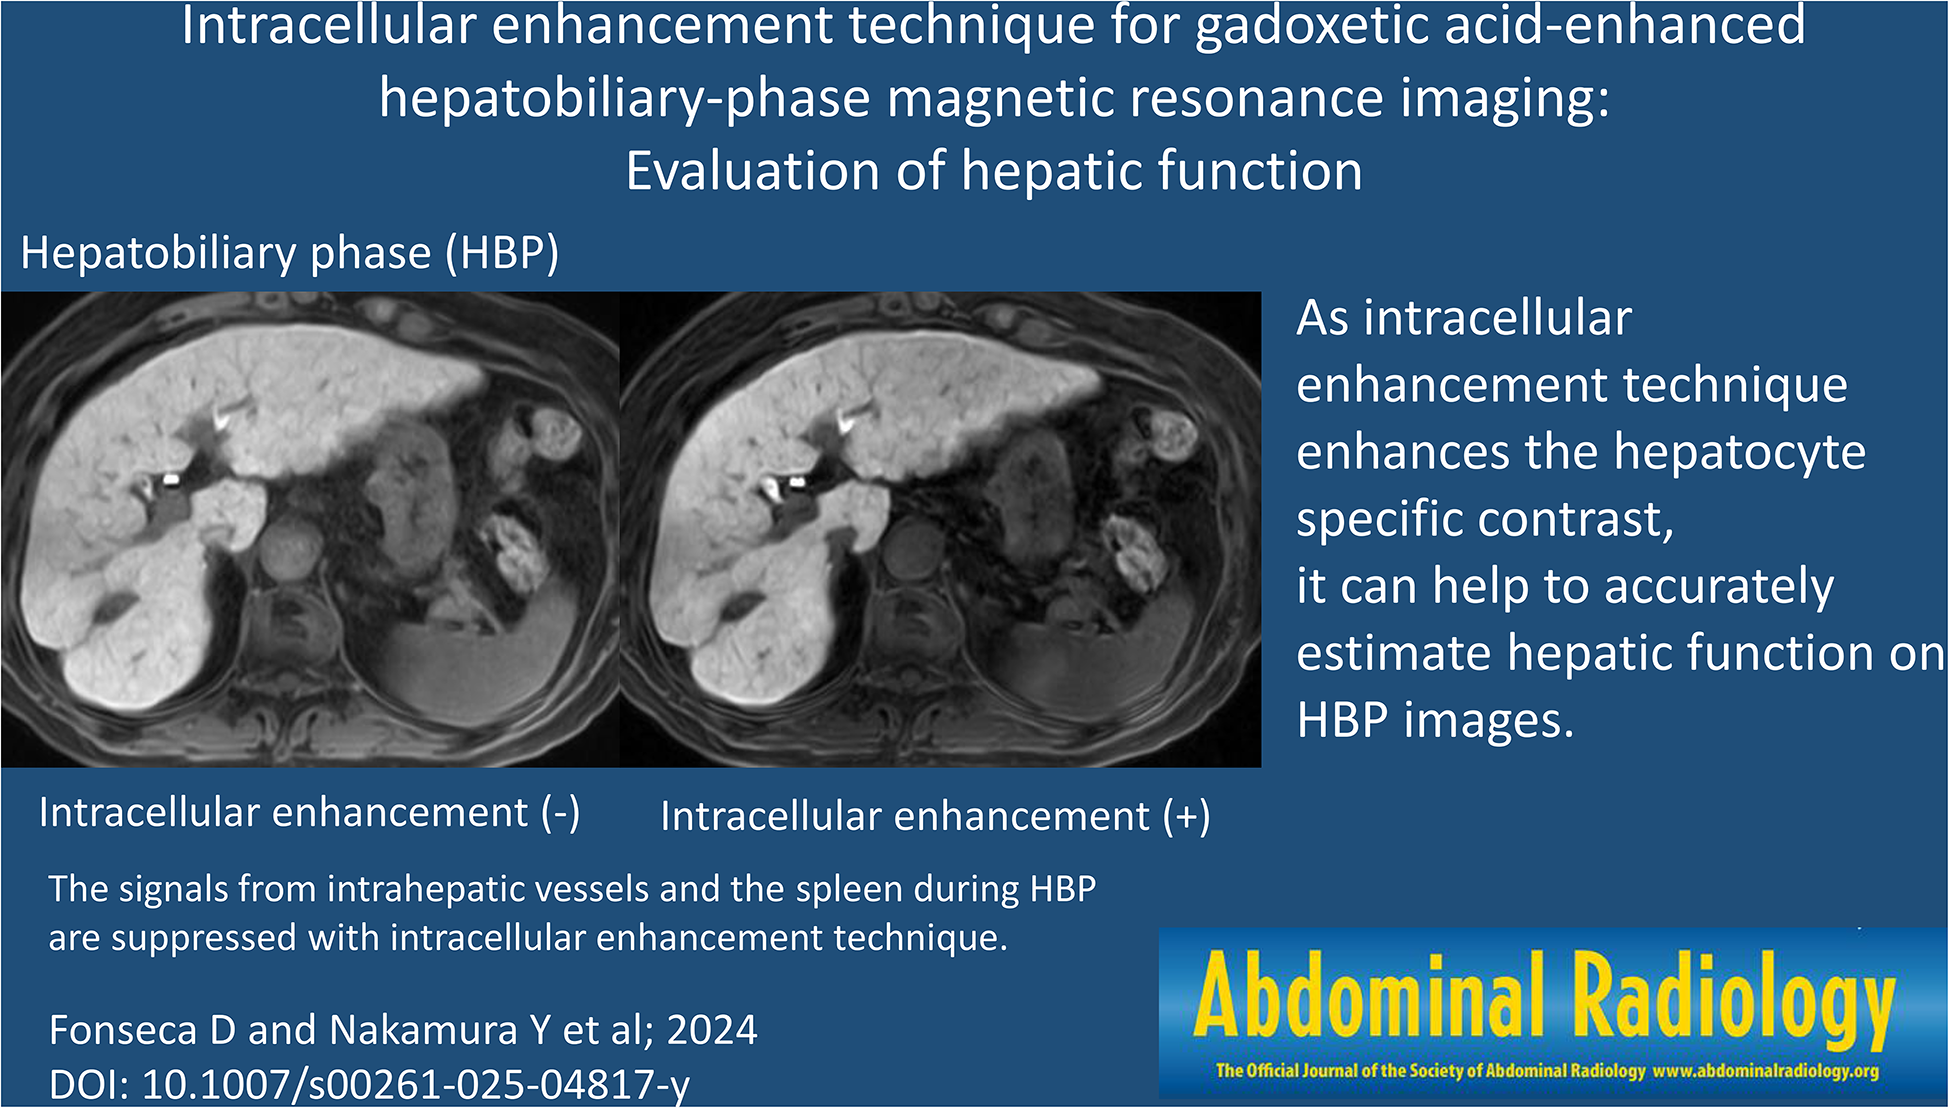
The motion-sensitized driven equilibrium (MSDE) pulse suppresses signals from the blood flow by adding motion-proving gradients (MPGs) with a low b-value [13, 14]. Thus it increases hepatocyte-specific enhancement during HBP by suppressing signals from the blood flow in the extracellular space. The ICE technique combines MSDE and fat-saturated T1-weighted gradient-echo nature of the sequence (TIGRE) to increase hepatocyte-specific contrast enhancement on HBP images [12]. Briefly, the MSDE pulse is composed of three composite radiofrequency hard pulses, MPGs, and spoiler gradients. The fat saturation pulse is comprised of chemical shift-selective pulses and spoiler gradients. The MSDE pulse (b-value 60 s/mm2, duration 21 ms) is applied immediately before the fat saturation pulse (duration 100 ms). The 3D RF-spoiled gradient-echo sequence is applied after the MSDE pulse and the fat saturation pulses to acquire T1-weighted signals modified by the preparation pulses.
Image acquisition
Scanning was on a 3T MRI instrument (FUJIFILM Corporation, Tokyo, Japan) using a 28-channel coil. Twenty-five µmol/kg of gadoxetic acid (EOB-Primovist, Bayer Yakuhin, Osaka, Japan), was injected intravenously at a rate of 2.0 mL/s followed by 20 mL of saline delivered at the same rate using a power injector (Sonic Shot 50; Nemoto-Kyorindo, Tokyo, Japan). HBP imaging was started 20 min after the contrast injection. Imaging was with TIGRE with parallel imaging (rapid acquisition through a parallel imaging design; RAPID, FUJIFILM Corporation).
Diffusion-weighted images of the liver feature low resolution, noise, and artifacts [15]. As the MSDE pulse used in the ICE technique suppresses signals from the blood flow by adding motion-proving gradients with a low b-value [13, 14], ICE may degrade the image quality due to the MSDE pulse. Wavelet denoising with geometry factor weighting (g-denoising) can reduce the image noise by adapting to spatially varying noise levels induced by parallel imaging; it yields better image quality than conventional HBP images [16]. Thus, g-denoising was added to our ICE protocol for HBP scanning.
As ICE and g-denoising may affect the contrast on HBP images acquired with our ICE scanning protocol, we scanned them using 3 protocols to examine the effect of ICE and g-denoising separately. The imaging protocols involved conventional HBP- (c-HBP), HBP with g-denoising- (g-HBP), and HBP with g-denoising and ICE (i-HBP) scanning.
The scan parameters for HBP were section thickness and interval 4.0 mm, TR/TE 4.0 msec/1.8 msec, flip angle 15°, field of view 36 cm, matrix 320 × 224, and parallel imaging factor 2.2 (2.0 for phase direction and 1.1 for slice direction). Parallel imaging reconstruction was performed in the k-space domain for c-HBP and in the image space domain for g-HBP and i-HBP scans because g-denoising can be applied to parallel imaging reconstruction performed in the image- but not in the k-space domain [16]. Although dynamic gadoxetic acid-enhanced MRI scans were obtained in the clinical studies they were not evaluated.
Image analysis
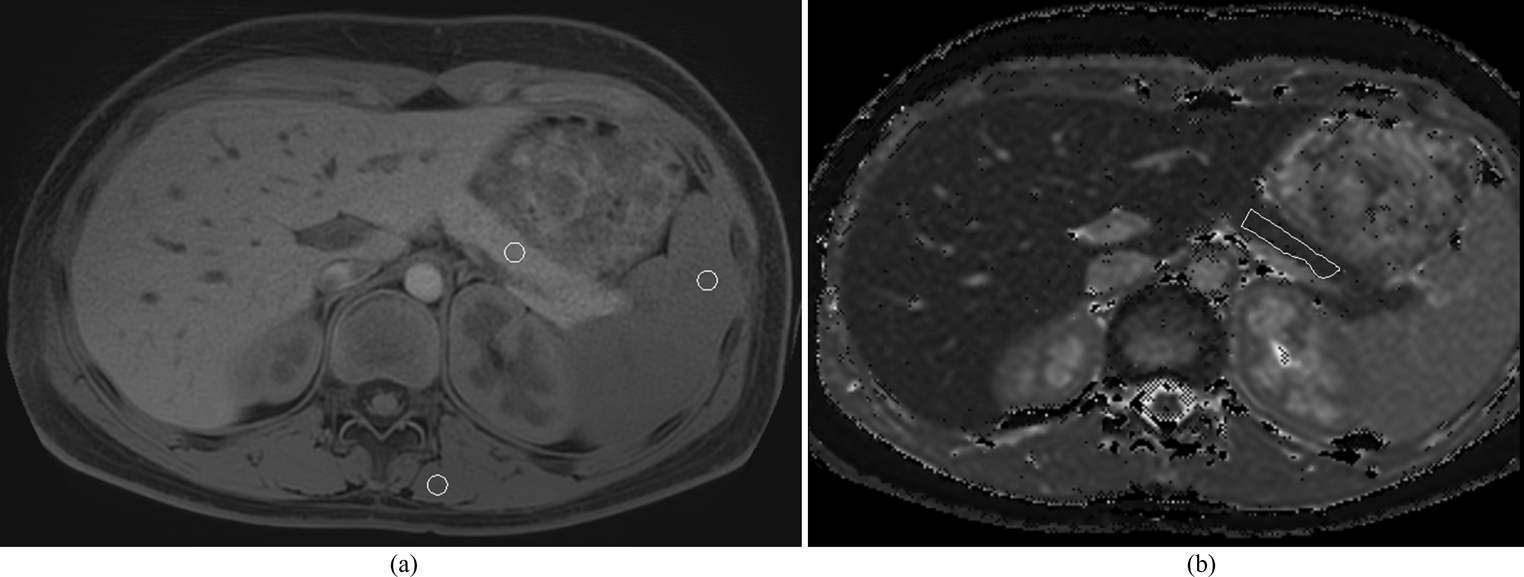
Quantitative analysis was performed by a radiologist (DF with 3 years of radiology experience) and a board-certified radiologist (SM with 7 years of radiology experience). The signal intensity (SI) of the hepatic parenchyma was recorded as the mean measurement value of 4 region of interests (ROIs) in the right anterior-, right posterior-, left medial-, and left lateral hepatic segment. Areas of focal changes in hepatic parenchyma, in large vessels, and prominent artifacts were carefully avoided. The SI of the spleen was recorded on the level of the largest spleen area. Each value was calculated by averaging 3 measurements.
The 2 radiologists calculated the liver/spleen contrast (LSC = ROIliver/ ROIspleen, where ROIliver is the mean SI of the hepatic parenchyma and ROIspleen the mean SI of the spleen [11]. Each value recorded by the two radiologists was averaged. We defined LSC at c-HBP as c-LSC, LSC at g-HBP as g-LSC, and LSC at i-HBP as i-LSC.
Statistical analysis
All statistical analyses were with JMP17 software (SAS Institute, Cary, NC). Differences were determined with the Fisher test for the patient gender and the Mann-Whitney U-test for the other parameters. Each LSC value was subjected to receiver-operating characteristic (ROC) analysis to determine the threshold value yielding the highest sensitivity and specificity to differentiate between Child-Pugh classes A and B. Differences of p < 0.05 were considered statistically significant. For multiple comparisons differences of p < 0.017 using Bonferroni correction were considered statistically significant.

Comments (0)