Model system and beetle collection
Bark samples measuring about 20x30 cm and containing overwintering adults were collected in winter (November and December 2022 and March 2023) from selected infested trees in an outbreak area of the southern Alps (Veneto, Gares, 46.307° N 11.866° E; 46.330° N 11.890° E). Five to six bark samples were placed in ventilated plastic boxes (37x26 cm) and stored in laboratory refrigerators at 4°C with no light, thus maintaining hibernation. Beetles used to run ERG were kept outside of refrigerators and maintained on an artificial diet (Kandasamy et al. 2023). The medium was autoclaved and placed in 2 ml Eppendorf tubes fully filled. Caps were perforated to allow air circulation.
Eye morphology
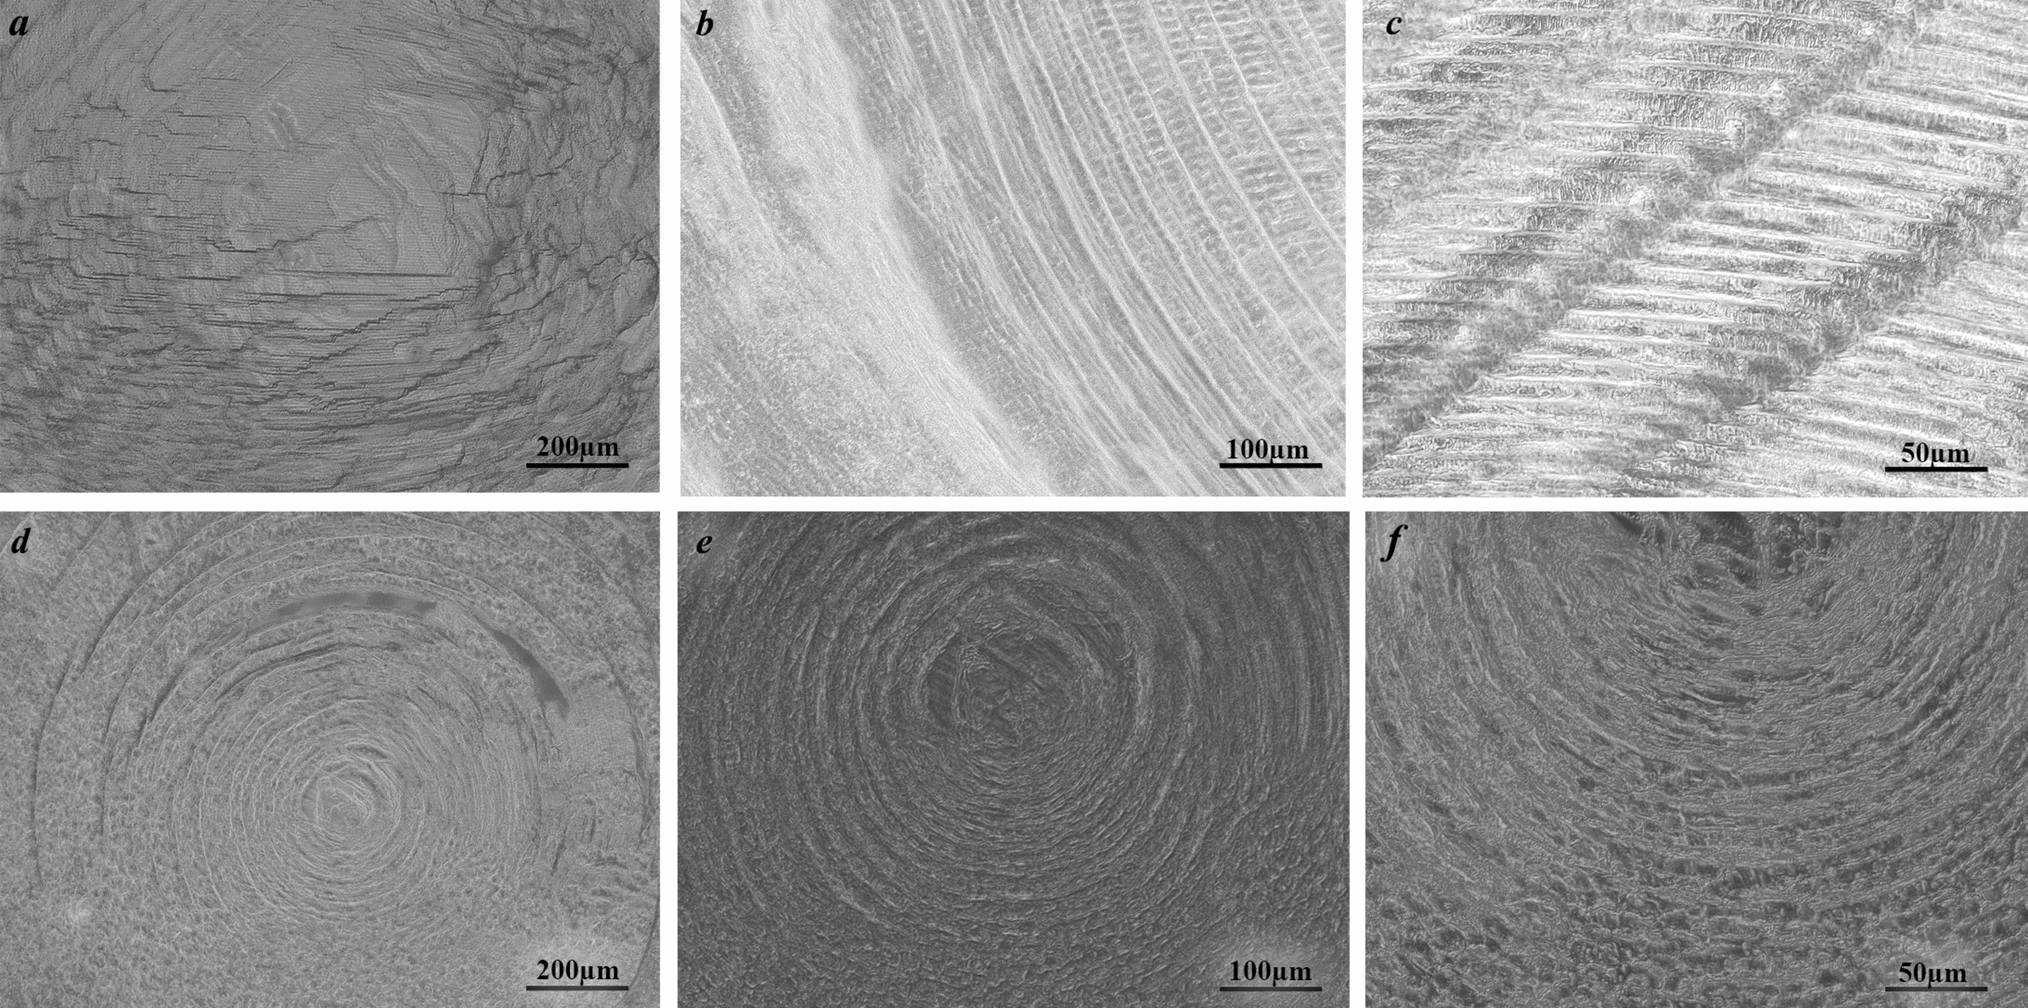
To obtain images of the eyes, heads were firstly isolated under a stereo microscope (Zeiss mod. Stemi 305) and antennae were removed using a scalpel. Subsequently, isolated heads were inserted into a SEM microscope (Hitachi mod. TM-1000) and observed at 400x magnification. This magnification allowed to include the whole eye in the image. To characterize eye morphology, a total of 50 individuals (26 females, 24 males) were used.
Four axes across the eye were virtually overlapped, one longitudinal on the maximum length and three transversal on the largest point of upper, middle, and lower portions. The length of each axis was measured and the number of ommatidia crossed by each axis was counted. The width of ommatidia was calculated dividing the length of the axis by the number of ommatidia crossed by the axis. Areas of single ommatidia were calculated drawing the perimeter on 10 randomly chosen ommatidia in each portion of the eye (upper, medium, lower). Finally, on 13 eyes of randomly selected individuals (6 females, 7 males), all ommatidia were counted.
Eyes images were analysed using IC Measure software (The Imaging Source, LLC, Germany). Statistical analyses were conducted using the R studio software (R Core Team 2021). ANOVA test and t test were used to evaluate significant differences. The significance level used was alpha = 0.05.
For micro-computed tomography (micro-CT), isolated heads were fixed in 70% ethanol and stained with 1% PTA (phosphotungstic acid dissolved in 70% ethanol) for 2 days. After incubation samples were washed several times in 70% ethanol and transferred into heat-sealed pipette tips filled with 70% ethanol. Scans were performed with Neoscan N80 microtomograph (Neoscan, Mechelen, Belgium) at 50 kV, 80 µA and 0.7 μm resolution. The sample was rotated in 0.2° steps over a total of 180°, averaging 3 frames for each step. Virtual cross sections were reconstructed from 988 projection images with Neoscan 80 software (version 2.2.4) (Neoscan, Belgium). A total of 2800 sections were imported into Dragonfly software (version 2022.2.0.1399) (ORS Inc., Mississauga, Ontario, Canada) for 3D reconstruction and obtaining projections in arbitrary planes.
Spectral sensitivity measurements
Measurements were conducted in March 2023 at the University of Ljubljana, Department of Biology, on beetles obtained from the samples described above.
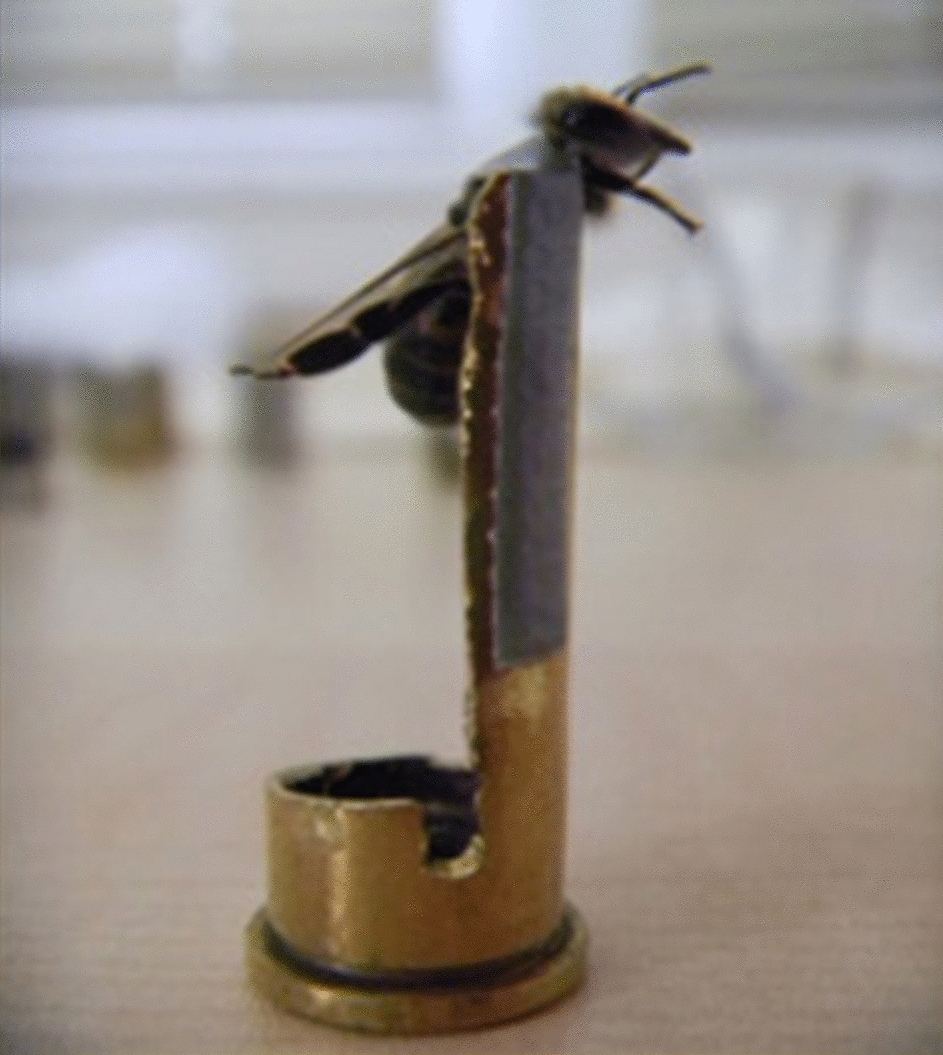
To test their spectral sensitivity, beetles were immobilized with beeswax with the recorded compound eye positioned in the rotation centre of a goniometric stage, which also carried the micromanipulator (Sensapex, Finland). The reference electrode was a 50 μm diameter Ag wire coated with AgCl, inserted into the abdomen, while the recording electrode was a blunt glass micropipette, pulled on a laser puller (P-2000, Sutter, USA), filled with insect saline solution. ERG signals were amplified (SEC-10LX, Npi, Germany), band-pass filtered (0.1–50 Hz; Cyberamp, Molecular Devices, USA), digitized with an AD/DA converter (Micro1401 mkII, Cambridge Electronic Design, Ltd., UK), and stored and analysed with WinWCP, version 5.5.4 (John Dempster, University of Strathclyde, Glasgow, UK). The beetles were oriented with respect to the stimulating beam to yield a maximal ERG response.
Stimulation was provided with two coaxial light sources: an LED array (Belušič et al. 2016) and a xenon arc lamp (XBO, Osram, Germany), filtered with a monochromator (B&M, Germany) and intensity adjusted with a motorized graded neutral density filter (Thorlabs, Germany). Each source could be used for the creation of monochromatic flashes or for constant selective adaptation with monochromatic light. Both light sources were calibrated with a Flame spectroradiometer (Ocean optics, USA) to yield equal photon flux (max. 1∙1015 quanta cm− 2 s− 1) at every wavelength.
Bioinformatic analyses
The full-length DNA sequences encoding for long wavelength (LW) and ultraviolet absorbing (UV) opsins belonging to beetles of the superfamily Curculionoidea were downloaded from Genbank together with selected full-length DNA encoding LW and UV opsins sequences from beetles belonging to Cucujoidea and Chrysomeloidea (Sharkey et al. 2021). These superfamilies are the most closely related to Curculionoidea in the current reference phylogeny for Coleoptera (Sharkey et al. 2021). The last version available of the genome of I. typographus (Powell et al. 2021) was analysed to identify the LW and UV opsins encoded in its sequence, because these data are not available in GenBank. The full set of opsin sequences analysed in present paper is listed in Table S1 - Supplementary document, where we provide a detailed description of the many molecular analyses that we have done for present paper.
The physical and chemical parameters for the opsins of I. typographus were computed with the ProtParam program available at the the Expasy Swiss Bioinformatics Resource Portal (Duvaud et al. 2021). The 3D-structures of the LW opsin and UV opsins of I. typographus were determined through a homology modelling strategy implemented in the SWISS-MODEL Workspace available at https://www.expasy.org.
Three set of opsins CURC-set, LWs-set and UVs-set were created (Table S2). The DNA sequences were translated into the proteins. These latter were aligned with the software MAFFT (L-INS-I, option) (Katoh et al. 2005). Successively, each set of the protein-coding sequences was aligned on the TranslatorX server using as template the alignment obtained for the encoded proteins (Abascal et al. 2010). Once downloaded from the TranslatorX server, the DNA multiple alignments were uploaded in MEGA X software (Kumar et al. 2018) to be saved in various subsets analysed in our paper. The compositional heterogeneity of a multiple alignment is a major source of misleading phylogenetic outputs (Kück et al. 2014). The level of compositional heterogeneity was tested with AliGROOVE (Kück et al. 2014). The amount of phylogenetic signal present in the 18 multiple alignments, analysed in this paper, was evaluated studying the distribution of the pairwise distances (based on the best fitting evolutionary models) using boxplots (Fig. S3, S4, S5, S6, S7, S8). Phylogenetic analyses, based on the maximum likelihood method, were performed with the software IQ-TREE 2.3.4 (Minh et al. 2020). The best fitting evolutionary models of the different data sets were selected using the ModelFinder algorithm implemented in IQ-TREE (Kalyaanamoorthy et al. 2017). Partitioned analysis implemented in IQ-TREE was applied to the DNA multiple alignments (Chernomor et al. 2016). Statistical support to the tree topologies were assessed by computing 10,000 replicates of ultrafast bootstrap (UFBoot) (Hoang et al. 2018) and 1000 replicates of the SH-like approximate likelihood ratio test (SH-alrt) (Guindon et al. 2010).
Behavioural experiments
Innate wavelength preferences of the beetles were tested in a Y-maze (Fig. S11). The maze was constructed over a customized aluminium support built with Makerbeam (Utrecht, Netherlands) out of black-opaque honeycomb polypropylene sheets (thickness 2 mm). Sheets were glued to build a squared open-top corridor where beetles were able to walk on both the bottom and the sides. The length of the initial corridor was 12 cm. A sliding door made of polypropylene sheet was inserted at the base of the corridor to isolate the beetle before the starting of the test. The arms were 8 cm long, with an angle of 120°. Each arm ended with a 3 cm window made of a non-fluorescent diffusor (lens cleaning tissues 105 W, Whatman, USA) inserted into a frame of the same polypropylene sheet, preventing the beetle to walk further. The light sources were located at a distance of 8 cm from the arm windows and consisted of LEDs selected based on the wavelengths to which the beetles responded in the physiological tests. The distance was chosen to concentrate the light beam on the light diffusor window.
Light sources used for the tests were the UV LED (SMB1N-375 V) and the green LED (SMB1N-525 V) by Roithner Lasertechnik GmbH (Vienna, Austria). Conditions where the LEDs would appear subjectively equally bright to the beetles were created, i.e., the LED output would evoke approximately equal depolarization in both spectral channels. Then, the intensity could be adjusted to create subjectively dimmer or brighter UV or green light, to test whether the beetles would orient on the basis of chromatic, not intensity cues. It was assumed that the photoreceptor gain has evolved so that both spectral channels are about equally depolarized when exposed to daylight illuminant (Chittka et al. 1994). To fulfil these assumptions, the LED photon flux was computed based on the spectral sensitivity recordings and the standard daylight irradiance spectrum (CIED65). First, the photon catch N of I. typographus UV and green-sensitive photoreceptors was calculated as
$$\:_=\underset}_\left(\lambda\:\right)I\left(\lambda\:\right)d\lambda\:$$
where Ri is the normalized spectral sensitivity R of the photoreceptor class i, I is the normalized CIED65 irradiance spectrum and the wavelength range is 300–700 nm. The relative quantum catch for each of the two receptor channels was obtained by dividing the quantum catch of an individual channel by the sum of quantum catches in both channels. It was calculated that under daylight, the green-sensitive photoreceptors catch four times more photons than UV-sensitive photoreceptors and assumed that the phototransduction gain (i.e. membrane voltage change per absorbed quantum) is 4 times higher in the UV photoreceptors than in the green photoreceptors. Consequently, to imitate the receptor excitation under natural conditions, the LEDs were set with a quantal flux ratio of 1:4 for UV and green light respectively. Based on the above mentioned phototransduction gain, to test the chromatic preference at different beetle-subjective stimulus intensities, quantal flux ratios of 1:1 and 1:16 for UV and green light respectively were used. In particular, UV being experimentally brighter (1:1), equal (1:4) and dimmer (1:16), in relation with the green light. The LEDs were powered by a lab power supply powering pickobuck LED drivers (mod. COM-13705 ROHS, Sparkfun), controlled with a Teensy microcontroller (NXP microcontrollers, The Netherlands). LED intensity was adjusted with pulse width modulation at 1 kHz, well beyond the flicker fusion frequency of any animal (Autrum 1958). The illumination system was calibrated with a Flame spectroradiometer (Ocean optics, USA) so that the maximal light output of the green LED was 1013 quanta s− 1 cm− 2. All tests were performed in a dark room illuminated with ambient red light (20 W tungsten light bulb, filtered with a KODAK safelight-filter mod. GBX-2, mounted directly on the maze arm), which was shown to have no effect on beetle behaviour in preliminary tests.
Tests were run in July 2023 on beetles obtained from the bark samples described above and gradually taken to laboratory room temperature (26 –29 °C), as they were leaving the overwintering conditions. Only beetles that showed a standard activity of movement were selected for the tests 2 h after they reached the room temperature under laboratory light conditions. The experiments were run between 11:30 and 15:00. Each individual was given a maximum of 10 min for the test. Beetles were first placed individually in the dark part of the basal corridor for 1 min. Once the sliding door was open, the test started, and notes of movements were taken during the experiment. A clear final choice was declared after the individual spent at least 1 min continuously at the end of the same arm of the maze as already done in behavioural choice experiment by Netherer et al. (2022). The measure considered for all the experiments is the time (expressed in seconds) used by beetle to reach the arm. The tests included: (i) green light vs. no light, (ii) UV light vs. no light, (iii) UV vs. green light with 1:4 quantal flux ratio, (iv) UV vs. green light with 1:1 quantal flux ratio, (v) UV vs. green light with 1:16 quantal flux ratio. The light sources were randomly alternated between the two arms for each individual tested. Only naïve beetles were used, for a total of 10 females and 10 males in each test.
In June 2024, to test the discrimination of wavelength vs. brightness cues in the spectral band where colour vision capability was not expected (420–600 nm), the same protocol was used with further 10 beetles (5 females, 5 males collected from the field) per each colour (blue (470 nm) and yellow (590 nm)). Tests included green (530 nm) vs. blue and yellow using a 1:4 ratio.
Data analysis
In the tests light versus no light, all the individuals chose the lit arm (either green or UV), therefore a linear model was employed to assess the time needed to reach the light source (response variable) in relation to the light colour (categorical variable with two levels: green or UV), the sex (categorical variable with two levels: female or male), and their interaction. The response variable was log-transformed to improve model linearity.
In the tests green versus UV light, a Pearson chi-square test was used to test the preference toward a light source for each quantal flux ratio. Since in all tests the preference toward UV light was between 95 and 100%, a linear model was employed to assess the time needed to reach the UV light source in relation to the sex, the quantal flux ratio (categorical variable with three levels of UV to green ratio, i.e., 1:1, 1:4 or 1:16), and their interaction.
Pairwise multiple comparisons were performed using adjusted p-values with Tukey correction. The significance level used was alpha = 0.05. Statistical analyses were performed using the R software (R Core Team 2021).


Comments (0)