
Remember me


This corresponds to simulation of the puncture procedure, and it should be performed the day before treatment whenever possible. It is important to evaluate the patient before treatment as one may find occurrence of ascites or an increase in tumor size (including occurrence of portal vein tumor thrombus, etc.) not seen when scheduling hospitalization in the outpatient clinic. In addition, evaluation with US allows one to evaluate the patient's general condition that cannot be ascertained based on hematological findings, with US being mandatory not only for beginners but also those experienced in ablative therapy.
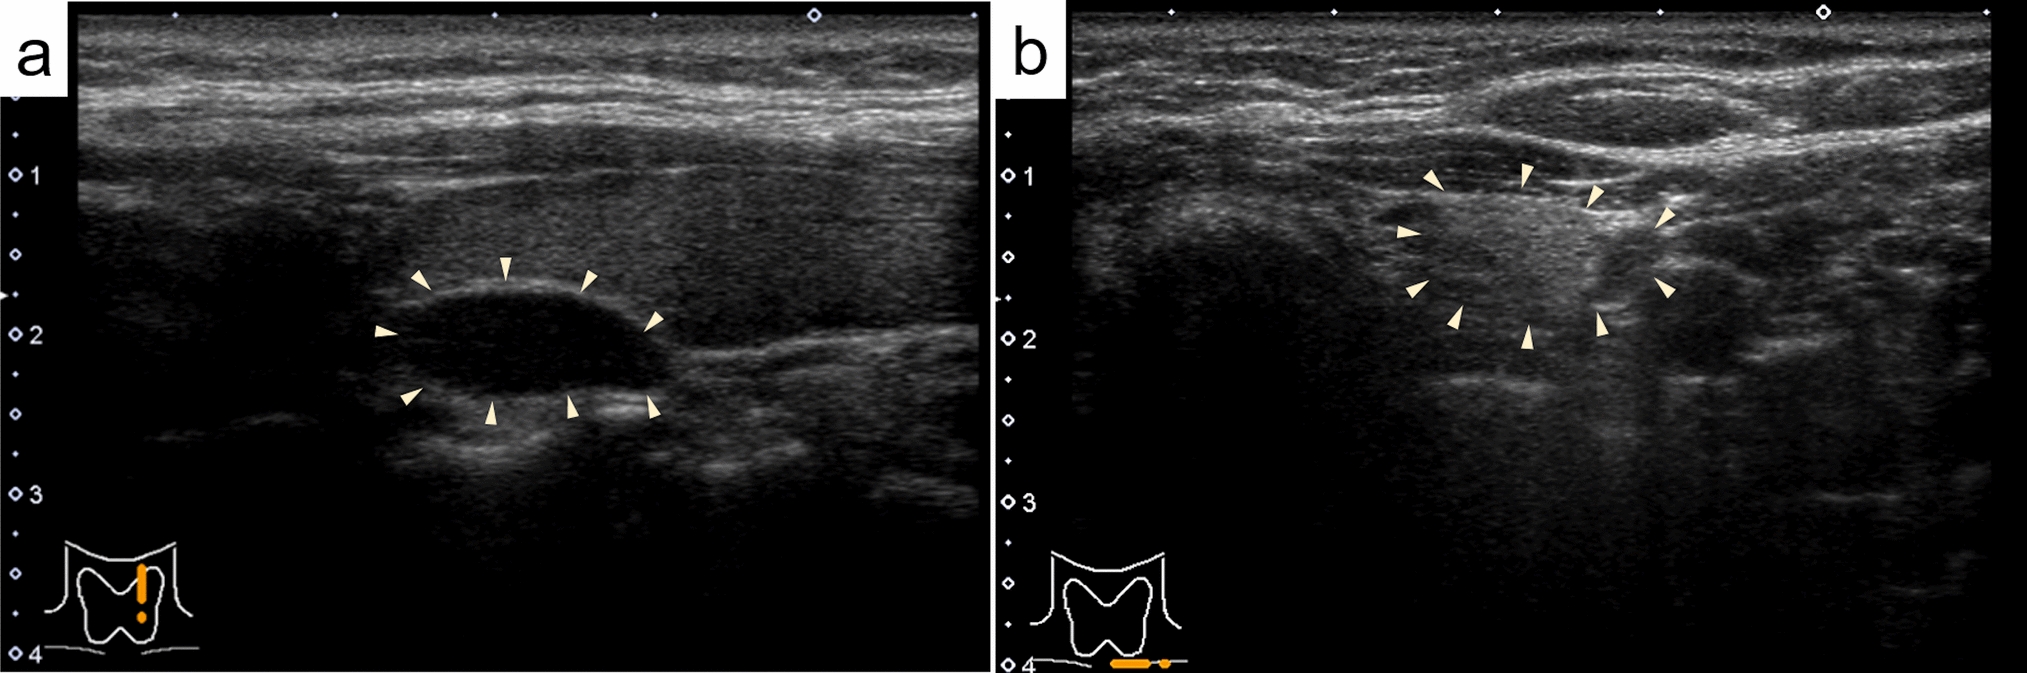
During planning, the operator needs to demonstrate the puncture needle insertion route from the skin/liver surface to the tumor using B-mode US. It is important to use the same probe that will be used during the actual treatment. If the tumor is located in the right hepatic lobe, it should be observed between multiple ribs to find the intercostal space that allows the tumor to be observed the most clearly. Next, assess whether there are any large vessels (particularly the portal vein) along the puncture route. It is easy to distinguish the portal vein from hepatic veins based on the anatomical course, but color Doppler US should be used when it is difficult to differentiate them. If there is a large vessel along the puncture route, consider flipping the US screen horizontally and switching to a puncture route from the reverse direction (cranial), not the forward direction (caudal) (Fig. 1a, b). When puncture is difficult due to the presence of a vessel along the puncture route, consider another route from a different intercostal space. However, a puncture route looking up from between the ribs should be avoided as there is a risk of intercostal arterial injury. In addition, a change of patient position should also be considered if necessary to gain a better puncture route. In the case of a tumor under the hepatic dome in segment 4 (S4), in particular, visualization is sometimes difficult when scanning looking up from the cardiac space, but visualization might be easier by putting the patient in the sitting position.
Fig. 1
Planning. a HCC is found in two places in S3 of the liver. It is located ventrally in P3 and dorsally, respectively (arrows). It is depicted more clearly in P3 (arrowhead) when color Doppler is used. The dorsal lesion was to be ablated first, but it was determined that it was not appropriate as P3 was located on the puncture route when the puncture line was in the forward direction. b P3 could be circumvented from the puncture route by planning a puncture line in the opposite direction
Depending on the site of the lesion, visualization might be difficult without using artificial ascites/pleural effusion. In such cases, deciding on the infusion site of an artificial ascites/pleural effusion beforehand will result in smoother execution of the procedure. If there are multiple lesions requiring treatment, it is important to determine beforehand the order in which they will be treated. The deepest lesion is generally treated first, but when performing treatment under artificial ascites, treatment should be performed promptly when the conditions are right as the visibility of the lesion might deteriorate due to ascites moving over time. In the case of a large lesion for which ablation needs to be performed multiple times, the order of the punctures should be decided in advance. At institutions where both RFA and MWA are available, it is best to decide at the planning stage which one should be used.
Education of those inexperienced in ablative therapy is a large part of the planning process. Beginners are often satisfied with the tumor visualization achieved by scanning with the dominant hand, but in most cases the dominant hand is used to hold the puncture needle while scanning with the probe using the opposite hand during an actual puncture. Therefore, whether a beginner can reliably depict a lesion using the non-dominant hand needs to be confirmed. Moreover, it is difficult for beginners to reliably depict a lesion due to the effects of patient respiration, but experienced operators can continue to reliably depict a lesion by fine-tuning scanning with the probe according to the patient's respiration even if the patient does not hold their breath. Furthermore, a doctor performing ablative therapy must be familiar with the acoustic features of US and how to perform contrast-enhanced US, fusion, and needle navigation. Beginners should keep these points in mind when going into planning. Depending on the institution, technicians are in charge of routine US examinations while physicians only perform US during treatment, but it is important to get used to performing US on a regular basis as US skills cannot be acquired overnight.
Puncture probeThere are two types of probes used for US-guided puncture procedures: a dedicated puncture probe that integrates the scanning surface and puncture hole (Fig. 2a) and a type that is used by fitting an attachment to a standard probe. A regular convex probe is sometimes used for the latter, but a small micro convex probe (Fig. 2b) with a small diameter developed for puncture use is often utilized. There are both advantages and disadvantages with each type of puncture probe. Some advantages of a dedicated puncture probe that integrates the scanning surface and puncture hole include the absence of a blind spot during needle puncture, the ability to puncture from an angle perpendicular to the probe surface, and image quality equivalent to that of a regular convex probe.
Fig. 2
a Dedicated puncture probe. b Micro convex probe
A micro convex probe, on the other hand, is not as good as a dedicated puncture probe or convex probe in terms of image quality, but it provides a high degree of freedom for intercostal scanning as the probe radius (R) is small and the thickness of the probe is thin. It is particularly good for depicting lesions under the hepatic dome. It should be noted that the specification/configuration and selectable puncture angles of micro convex probes differ depending on the manufacturer.
Treatment assistive technologiesConcomitant use of artificial pleural effusion/ascitesArtificial pleural effusion/ascites is a very useful assistive technology used to improve the ability to visualize the tumor with US and to avoid thermal damage to areas other than the target site. The fluid infused is 5% glucose solution or physiological saline, each of which has associated complications, as described below. The former is generally used at many institutions in order to avoid conductivity.
A.Artificial pleural effusion method
By injecting fluid into the thoracic cavity, the artificial pleural effusion method allows one to depict lesions in the right hepatic lobe that are difficult to visualize with intercostal scanning under the influence of gas in the lung. There are various reports on how to create artificial pleural effusion [8,9,10], but pleural effusion is often created by placing a puncture needle (pneumoperitoneum needle) at a position directly above the diaphragm or that slightly pierces the diaphragm of the hepatic surface at a position slightly caudally distant from the lungs, utilizing the fact that the thoracic cavity covers the entire right hepatic lobe [11]. A schematic that shows the anatomical structure needed when creating artificial pleural effusion is shown in Fig. 3.
a.Procedure
Fig. 3
Anatomical structure that needs to be understood when creating artificial pleural effusion
Using a 22G Cathelin needle, administer intradermal anesthesia, and then inject local anesthesia while advancing the needle under US guidance. After administering anesthesia, the risk of puncturing the liver parenchyma with the pneumoperitoneum needle can be avoided by creating space by injecting 5% glucose solution into a layer deeper than the thoracic cavity such as below the liver capsule. The pneumoperitoneum needle has a dual structure comprised of an inner needle with a dull tip and a sharp outer needle (Fig. 4). In its resting state, the inner needle protrudes from the tip of the outer needle. When the needle is pressed strongly against the pleura, the inner needle retreats and is pushed inside the outer needle, and the tip of the pneumoperitoneum needle becomes sharp, allowing the pleura to be pierced. The tip of the needle returns to the original dull state when the needle is placed in the thoracic space. There is a side hole for injecting water just before the tip of the inner needle, and stable pleural effusion can be created by slightly piercing the diaphragm. In addition, it is important to perform the puncture so that the pneumoperitoneum needle is as vertical to the liver as possible. Water may collect in subcutaneous tissue when the position of the pneumoperitoneum needle is shallow, water will collect in the diaphragm when it is slightly deep, and ascites will be created when it is even deeper. These can be easily distinguished by observing the intravenous drip rate and the status of pleural fluid injection on US (e.g., thickening of subcutaneous tissue and diaphragm). Moreover, when pleural fluid is being properly injected, respiratory fluctuations are seen in the intravenous drip. An injection volume of 500 mL is sufficient in most cases. When visualization of the lesion is still poor, the backrest of the bed should be raised further; the injection volume should not be increased. Draining the injected pleural fluid is not necessarily needed as it will usually be mostly absorbed naturally within several days, but draining it can make the patient's recovery time and hospital stay shorter as compared with waiting for it to disappear naturally in patients with low hepatic reserve and patients with coexisting lung disease.
b.Complications
Fig. 4
Structure of pneumoperitoneum needle
Risks associated with the creation of artificial pleural effusion are subcutaneous hematoma, unintended lung puncture (pneumothorax), and intercostal arterial injury (hemothorax). Examples of side effects of the injected fluid are respiratory distress, hypoxemia, hyponatremia due to 5% glucose solution, and cardiac load due to physiological saline, but an injection volume of about 500 mL usually poses little problem. However, artificial pleural effusion is contraindicated in patients with severe chronic lung disease and patients without a left lung as hypoventilation due to artificial pleural fluid injection or complications due to pneumonia/pneumothorax/hemothorax could be fatal. There is also a case report of an unfortunate outcome due to exacerbation of interstitial pneumonia that may have been caused by pleural effusion creation [12]. In addition, since pleural effusion cannot be properly created in patients with adhesion between lung and pleura, it is important to take into account that possibility and consider a different treatment plan in patients who have undergone local ablative therapy for a lesion under the dome in the past or patients with a thickened pleura detected on preoperative CT.
B.Artificial ascites method
By injecting fluid into the abdominal cavity, the artificial ascites method allows one to depict lesions in the right hepatic lobe that are difficult to visualize with intercostal scanning under the influence of gas in the lung. It is also a useful technique for avoiding thermal injury to adjacent organs and an indispensable procedure in local ablative therapy. There are various reports on how to create artificial ascites [13], but here we will present visualization of a lesion under the right diaphragm and a method for direct puncture of the liver with a pneumoperitoneum needle designed to prevent thermal injury of the diaphragm [11]. In addition, artificial ascites is created by inserting the pneumoperitoneum needle near the lesion in order to prevent thermal injury to the stomach and large intestine as much as possible.
a.Procedure
We will explain artificial ascites creation by means of direct liver puncture. The anatomical structure needed when creating artificial ascites is shown as a schematic (Fig. 5).
Fig. 5
Anatomical structure that needs to be understood when creating artificial ascites
Select the puncture site that allows clear visualization of the right hepatic lobe on right intercostal scanning. Under US guidance, administer local anesthesia to the liver capsule, subcutaneous tissue, and skin, in that order. Next, make an incision in the skin with a pointed blade and secure the puncture route with mosquito forceps. Then, perform direct puncture with the tip of the pneumoperitoneum needle to a depth of about 1 cm from the liver surface under US guidance. After proper puncture, fully open the IV set and slowly pull out the pneumoperitoneum needle while monitoring with US. When the tip of the pneumoperitoneum needle is about 5 mm from the liver surface, ascites will flow into the abdominal cavity all at once by means of hydraulic pressure. This process can also be monitored using color Doppler US (Fig. 6). When the water pools, an echo-free space is created in the abdominal cavity under the liver surface and diaphragm; therefore, more stable ascites can be created by removing the pneumoperitoneum needle from the liver and inserting it in the echo-free space. The amount of ascites injected is usually about 500–1000 mL, but like artificial pleural effusion, about 500 mL is often sufficient.
b.Complications
Fig. 6
The flow of 5% glucose solution from the tip of the pneumoperitoneum needle (arrowhead) into the abdominal cavity is clearly depicted on color Doppler US (arrow)
Bleeding due to direct puncture of the liver is a concern, but only a small portion of the surface is punctured, and hemostasis for bleeding is rarely necessary. On the other hand, CT performed the day after treatment sometimes shows ascites migrating to pleural effusion. It is not an issue if the amount of ascites is about 500 mL, but if ≥ 1000 mL was injected, respiratory distress and decreased SpO2 may occur. In such cases, the pleural effusion needs to be drained. It is important to perform CT the day after treatment in order to assess the above.
Fusion imaging guidance A.Background
In the case of ablative therapy performed under US guidance, the keys to successful treatment are stable lesion visualization and accurate targeting on US images. Nevertheless, we often encounter situations where puncture is difficult given the nature of US guidance. Some reasons for targeting mistakes include an indistinct lesion, confusion with coarse regenerative nodules or treatment scars, and visualization range or acoustic window adverse conditions, with identification being difficult and visualization being poor in 2–38.8% of liver cancer cases [14,15,16].
B.Image fusion system
Various imaging technologies have been invented to overcome the issue of identification difficulties and poor visualization on US. One such technology is image fusion. Image fusion allows us to depict CT or MRI multi-planar reconstruction (MPR) images as pseudo US images while synchronizing the movements of the probe on the US monitor.
It is now possible to capture high-resolution images using multi-detector row CT (MDCT) equipped with multiple detectors, and improvements in computer processing power and advances in computer graphics have greatly improved three-dimensional (3D) imaging technologies. And thanks to magnetic tracking technology, it is now possible to accurately recognize positions in 3D space based on spatial information (relative distance and angle) between a magnetic field generator and a magnetic position sensor. By sharing position information between CT or MRI volume data acquired in advance and US images captured with a probe equipped with a magnetic sensor, it is possible to display B-mode images and approximated MPR images in real time while synchronizing with the movements of the probe (Fig. 7).
Fig. 7
Image fusion system. The position and angle of the probe can be detected in real time in 3D space by means of a position detection system using magnetism. By specifying the shared sites (e.g., intrahepatic vessels) on CT volume data and the US image, an MPR image synchronized with a virtual US image could be demonstrated
The first fusion imaging system was Real-time Virtual Sonography (RVS), which was launched by Hitachi Medico (currently Fujifilm Corporation) in 2003. Before that, US, CT, and MRI were separate independent image information, but the emergence of RVS allowed them to be utilized interactively. Today, the diagnostic units marketed by US manufacturers come equipped with image fusion systems. GE Healthcare has Volume Navigation (V-Nav), Canon Medical Systems has Smart Fusion, Philips has PercuNav, and Siemens has eSie Fusion Imaging.
With respect to image alignment, position adjustment was conventionally initiated based on cross-section synchronization of CT/MRI and US, but a breakthrough was made when image alignment became possible with a single sweep scan based on 3D recognition of the surface structure of the liver or intrahepatic vascular course using Philips' Auto Registration or Canon Medical Systems' PV Detection. In addition, a variety of technologies that support the operator/examiner have appeared, such as an active tracker function that simplifies the synchronization operation and a GPS function that can show the direction and distance to a region of interest designated on the US image.
C.Clinical application as treatment support
A.CT/MR-US fusion imaging
CT/MR-US fusion imaging, which synchronizes CT/MRI and US, improves visualization and supports the targeting of HCC that is poorly depicted on US. Some specific advantages of CT/MRI-US fusion imaging guidance are that it provides grounds for identifying tumors that are indistinct on B-mode US, facilitates puncturing with the electrode needle at the correct tumor position (Fig. 8), and reduces the number of sessions of local ablative therapy.
Fig. 8
CT-US fusion imaging guidance. A hypoechoic nodule (round dotted line) with an indistinct tumor contour is shown on the US image (left side of screen) so that it corresponds with the densely stained HCC (arrow) on contrast-enhanced CT (right side of screen). This nodule is pierced with the RFA needle (arrowheads)
The success rates and local recurrence rates for ablation therapy performed under CT/MR-US fusion imaging guidance for HCC indistinct on B-mode US have been reported to be 94.4–100% and 0–8.3%, respectively [17,18,19,20,21,22].
The following points should be noted during CT/MRI-US fusion imaging guidance.
(i)Misregistration
The state of the liver is not static; the liver can twist and change its shape. During image synchronization, CT/MRI and US images do not completely match in many instances, so one should assume that there will always be a certain degree of misregistration. In order to minimize misalignment of CT/MRI and US images, image adjustment needs to be carefully repeated, using an intrahepatic vessel as close to the tumor as possible as a guidepost.
(ii)Timing of image synchronization
When the patient repeatedly breathes with maximum inspiration and maximum exhalation, respiration depth will not be constant due to “breathing fatigue,” making image synchronization challenging. There will be little breathing error when image synchronization is carried out at expiratory standstill during natural breathing.
b.New applications of fusion imaging
(i)3D Sim-navigator and E-field
In the case of bipolar RFA using Celon Power, multiple electrode needles need to be inserted in a way that surrounds the tumor, but a sufficient ablation area cannot be achieved if the distance between the needles is too long. Because the distance between the needles must be suitable, bipolar RFA is a difficult procedure to perform. 3D Sim-Navigator is comprised of puncture simulation, in which multiple virtual puncture lines are drawn on top of CT/MRI volume data, and puncture navigation, during which the virtual puncture lines can be referenced. Thanks to the good compatibility between the highly robust Celon Power applicator and 3D Sim-Navigator, they are highly useful as treatment support for bipolar RFA [23]. In addition, E-field can be used to illustrate the expected extent of ablation in RFA treatment, and it can be utilized to simulate ablation therapy according to virtual puncture lines (Fig. 9).
(ii)US-US fusion imaging and US-US overlay fusion
Fig. 9
Simulation using 3D Sim-Navigator and E-field. The expected ablation area (yellow) when the RFA needle is inserted along two virtual puncture lines (yellow and purple) is displayed. The simulation image can also be utilized for treatment navigation as a reference screen
During ablation therapy, it is difficult to evaluate the ablative margin in detail during treatment because the tumor is hidden under a hyperechoic area that appears in association with ablation. However, there is a real risk of missing areas with an insufficient margin as the decision to end ablation therapy is subjectively made based on US images. On the other hand, it is now possible to overlay US images captured before and after ablation for comparison thanks to advances in imaging technology [24,25,26,27,28]. In a word, side-by-side comparison (US-US fusion imaging) and overlaying (US-US overlay fusion) are possible by synchronizing MPR images from US volume data captured immediately before ablation and US images taken immediately after ablation, allowing for identification and visualization of margins (Fig. 10). RFA treatment under US-US overlay fusion guidance improved the safety margin achievement rate (89.3% vs. 47.0%, P < 0. 01) and also curbed local recurrence (2-year local recurrence rate: 0.8% vs 6.0%, P = 0.022) [29]. Given that ensuring the safety margin was relatively easy even in the case of tumors exceeding 2 cm in diameter, in particular, the utility of using US-US fusion imaging/overlay fusion guidance may be greater when treating HCC on the large side.
Fig. 10
US-US overlay fusion. The right side of the screen is the baseline US image, where the HCC nodule is indicated in green. On the left side of the screen, the baseline US image is projected on a US image taken immediately after treatment using the overlay function (image overlay). A region differentiating the ablative hyperechoic area and the green tumor image can be detected as the margin
“Visualization of the ablative margin” is synonymous with “(early) assessment of treatment response”. CT exposure and contrast agent-induced renal impairment are concerns in HCC patients with long-term duration of disease as they undergo many imaging tests during their lifetimes. For that reason, it is preferable to refrain from performing contrast-enhanced tests, but the fact of the matter is that contrast-enhanced CT/MRI is performed within a week after ablative therapy for early assessment of treatment response at many institutions in Japan. Although the percentage of cases in which images can be precisely aligned using US-US overlay fusion is limited, margin evaluation (monitoring) using US-US overlay fusion can be a substitute for contrast-enhanced CT/MRI in the early assessment of treatment response, and can contribute to reducing radiation exposure and lowering the risk of renal impairment [30, 31].
Contrast-enhanced USSonazoid (GE Healthcare Pharma, Tokyo, Japan), the only contrast agent that is covered by health insurance in Japan, is an agent containing perflubutane covered in a phospholipid monolayer shell. It was first used for hepatic mass lesions in January 2007 in Japan. In addition to Japan, it is available in South Korea, Taiwan, Norway, China, and Singapore. The perflubutane bubbles are 2–3 μm in size, which is smaller than red blood cells, and they are metabolized in the lungs and expelled from the body through respiration; therefore, Sonazoid can be used in patients with renal impairment. It needs to be carefully administered in patients with an egg allergy as it uses hydrogenated egg phosphatidylserine sodium as an excipient. The only contraindication in the package insert is "Patients with a past history of hypersensitivity to the constituents of this product," but the frequency of allergic reactions is presumed to be very low. It can also be used in patients who are allergic to contrast-enhanced CT/MRI and patients with asthma.
The recommended dose in the package insert is “Intravenous administration of 0.015 mL/kg as a suspension once in adults”. The dose in a patient weighing 60 kg would be 0.9 mL, for example. This dose is based on the results of a clinical study (using US systems from multiple manufacturers) that was begun in 2002, but the performance of US systems has steadily improved over the 20 years since then; therefore, sufficient contrast can be achieved with a dose smaller than the recommended dose. As a side note, 0.5 mL per body is administered at many institutions in Japan [32,33,34]. When the examination is performed by a single operator, sufficient contrast can also be achieved by fully opening the IV for a while after injecting Sonazoid from the three-way stopcock.
Comments (0)