
Remember me


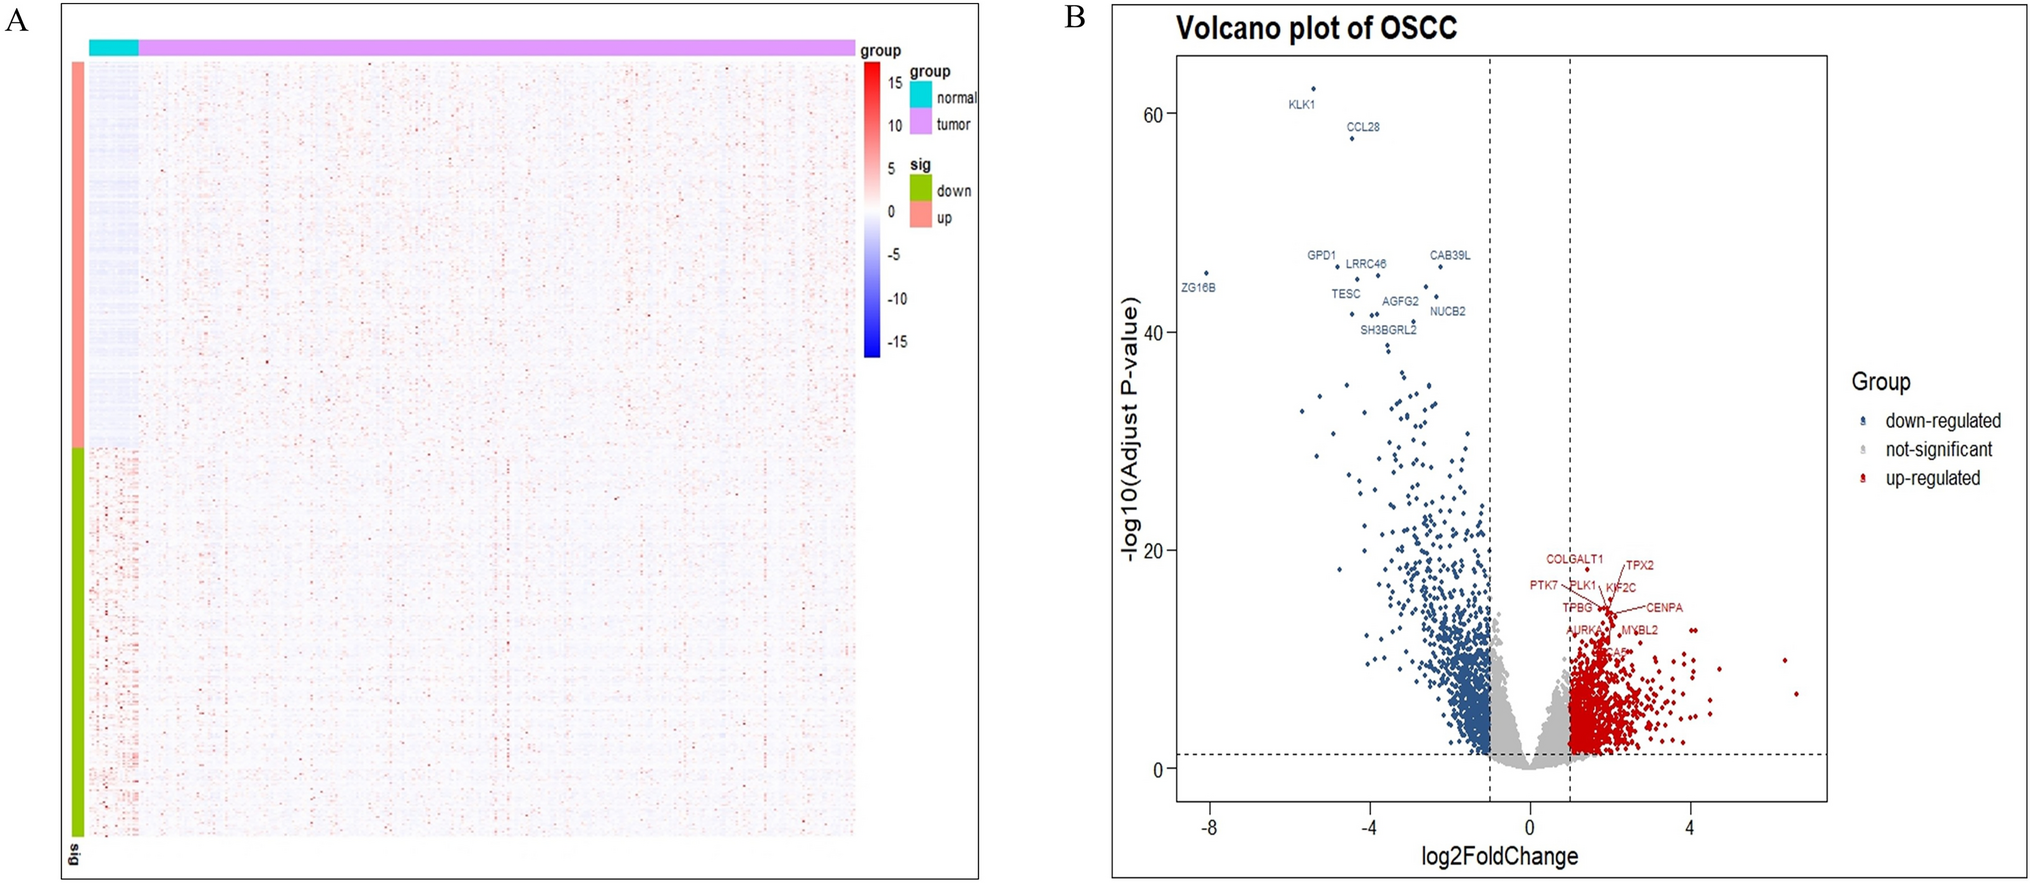


In the TCGA cohort, we identified 324 PCD genes (all corrected). P < 0.05, and |log 2 FC |> 0.65). Among them, 297 genes were up-regulated and 27 genes were down-regulated. All PCD genes were listed in Supplementary Material 1. The RNA expression levels of differential genes were shown as heatmaps in Fig. 1. Through enrichment analysis of Kyoto Encyclopedia of Genes and Genomes (KEGG) and Gene Ontology (GO), the results showed that these differential genes are involved in a variety of biological pathways, such as regulation of apoptotic signaling pathway, intrinsic apoptotic signaling pathway, negative regulation of apoptotic signaling pathway, etc.
Fig. 1
Differences in PCD among STAD patients A Heat map of PCD-related DEGs between tumor group and normal group in TCGA data. B Volcano plot of PCD-related DEGs. C KEGG enrichment analysis of PCD-related DEGs. D PCD-related DEGs GO enrichment analysis
3.2 Constructing a prognostic risk model for STAD patientsWe collected and analyzed survival information of STAD patients. Single-factor Cox regression was used to analyze survival-related genes. The results showed that a total of 65 genes in the TCGA data set were related to the prognosis of STAD patients. Among them, 29 low-risk genes and 36 high-risk genes (Fig. 2A). According to the optimal penalty parameter value of 0.01227784, LASSO regression analysis determined that the optimal number of PCD-related genes involved in model construction was 6 (Fig. 2B–C). The constructed risk model score is Risk score = (0.148646697399886 * CD24) + (− 0.340472754405638 * E2F2) + (0.117679087362593 * MAGEA3) + (0.18197999555265 * NOS3) + (0.193905800600656 * SERPINE1) + (0.766795923079645 * IRGM). A risk score for each sample was obtained using the prognostic model formula. The training group was divided into high-risk group (N = 185) and low-risk group (N = 185). The trial group is also divided into high-risk group (N = 211) and low-risk group (N = 222). In addition, a heat map was drawn between the expression levels of the 6 model genes and clinical variables (Fig. 2D).
Fig. 2
Risk score construction for STAD patients. A Single-factor Cox regression analysis of prognosis-related genes and 6 model genes were selected by the Lasso method; B–C Cross-validation of constructing a risk score; D Heat map and comparison of the six genes in the risk score model clinical characteristics;
3.3 Internal training and external validation of risk prediction modelsThe risk score graphs of the training group and the test group show the division of high-risk patients and low-risk patients. Patients are divided into high-risk groups and low-risk groups based on the median risk of the training set (Fig. 3A–B). The survival status plots of the training group and the test group showed that the mortality rate of patients gradually increased from the low-risk group to the high-risk group (Fig. 3C–D). The risk heat maps of the training group and the test group show that from the low-risk group to the high-risk group, the expression levels of CD24, MAGEA3, NOS3, SERPINE1 and IRGM, which are high-risk PCD-related genes, gradually increase; the expression level of E2F2 gradually decreases, this is a low-risk PCD-associated gene (Fig. 3E–F). This shows that the risk score model can well divide patients into high-risk groups and low-risk groups.
Fig. 3
Internal training and external validation of the risk prediction model A–B The distribution of risk scores in the training group and validation group; C–D Analysis of the survival status and risk distribution of both the training and validation groups; E–F Risk score model of the training group and validation group and the expression heat map of related genes
In addition, in order to explore the survival difference between the high-risk group and the low-risk group, the survival curves of the training group and the test group were drawn respectively. The results showed that the survival curves of the training group (p < 0.001) and the test group (p < 0.001) showed that there was a significant difference in the survival of patients in the high-risk group and the low-risk group. The survival status of STAD patients in the low-risk group was significantly better than that of the high-risk group. (Fig. 4A–B). We also based on age (> 60 years vs. ≤ 60 years), gender (male vs. female), tumor cell differentiation (G1-2 vs. G3), stage (stage 1–2 vs. 3–4) and AJCC N stage (N0-1 vs. T2-3) We then performed Kaplan–Meier survival analysis. We found that high-risk patients consistently showed significantly worse outcomes across a number of subgroups, including age ≤ 60 years, female gender, poorly differentiated G3, stage 3–4, and N2-3 (Fig. 4C–L).
Fig. 4
Training and validation of the risk scoring model. A–B Survival curves of high- and low-risk groups in the training group and validation group; C–L Kaplan–Meier survival analysis between the two risk groups in subgroups stratified by clinical characteristics
3.4 Unsupervised clustering of PCD-related genesTo explore potential molecular subtypes of STAD, consensus clustering analysis was performed using 6 PCD genes. We found that the differences between subgroups were most obvious when k = 3, indicating that STAD patients in the training and experimental groups could be well divided into three clusters (Fig. 5A, B). There was a significant difference between the three clusters in STAD prognosis time (training group P = 0.014, Fig. 5C; validation group P = 0.006, Fig. 5D). We also conducted further exploration of the biological functions associated with each cluster using GSEA. Our GSEA results revealed distinct biological functions among the three clusters. Specifically, we found that the C2 cluster was predominantly enriched in pathways related to PATHWAYS IN CANCER and ECM RECEPTOR INTERACTION. On the other hand, the C3 cluster was mainly enriched in the AXON GUIDANCE pathway (Figure S1–S3). The alluvial plots demonstrated the relationship between clusters, high- and low-risk groups, and the survival status of patients with STAD (Fig. 5E, F).
Fig. 5
Unsupervised clustering of PCD-related genes. A-B Using the expression patterns of risk model genes, individuals with STAD were classified into three molecular clusters when the k = 3. C–D Kaplan–Meier analysis showed the prognosis of OS patients who were categorized into three clusters. E–F The alluvial plots demonstrate the relationship between clusters, high- and low-risk groups, and the survival status of patients with STAD
3.5 Independent prognostic analysis of risk scoreIn order to determine whether the risk score can be an independent prognostic factor, univariate Cox and multivariate Cox regression analyzes were performed on the data of the training group and the test group, respectively. The results of single-factor Cox analysis of the training set showed that risk score is a risk factor for STAD patients (HR = 2.262, 95% CI 1.595–3.207, P < 0.001, Fig. 6A). The results of multi-factor Cox analysis showed that risk score can be used as a risk factor for STAD patients independent risk factors in patients (HR = 2.042, 95% CI 1.431–2.913, P < 0.001, Fig. 6B). The results of the univariate analysis of the validation group data also showed that the risk score was a risk factor (HR = 1.771, 95% CI 1.345–2.333, P < 0.001, Fig. 6C). The results of the univariate analysis also showed that the risk score was a risk factor (HR = 1.466, 95% CI 1.108–1.941, P < 0.01, Fig. 6D). In summary, the constructed risk score can be used as an independent risk factor for the prognosis of STAD patients.
Fig. 6
Independent prognostic analysis of risk scores A Single-factor COX regression analysis of the training set, B Multi-factor COX regression analysis of the training group; C Single-factor COX regression analysis of the test group, D Multi-factor COX regression analysis of the test group
3.6 Nomogram survival model construction and evaluationIn order to better predict the prognosis and survival status of patients, a Nomogram model was constructed based on the training group data based on the risk score and clinical characteristics to estimate the overall survival time of STAD patients at 1, 3 and 5 years. The model included age, sex, metastasis, and risk score (Fig. 7A). The calibration curve showed that the model had high accuracy in predicting 1-, 3-, and 5 year survival rates (Fig. 7B–C). By plotting the decision curve analysis (DCA) of the training group versus the test group, the Nomogram model was found to be superior to any clinical variable applied in this study (Fig. 7D). In order to evaluate the effectiveness of the model in predicting patient prognosis, the ROC curves of the training group and the validation group were drawn at 1 year, 3 years, and 5 years respectively. The results showed that the area under the ROC curve AUC of the training group at 1 year, 3 years, and 5 years was 0.684, 0.713, 0.743 respectively. (The area under the ROC curve AUC of the test group in 1 year, 3 years, and 5 years was 0.695, 0.704, and 0.707 respectively (Fig. 7E–F).
Fig. 7
Development and evaluation of Nomogram model A Prognostic nomogram for predicting the outcome of patients with STAD; B–C Calibration chart of 1, 3 and 5 year overall survival probability in the training group and the validation group D Decision curve analysis of the Nomogram score and each clinical variable in the training set ( DCA); E–F the nomogram's receiver operating characteristic curve (ROC) for the overall survival rate at 1, 3, and 5 years in both the training and validation sets
3.7 Immune microenvironment analysis of risk-prognostic modelsTo further explore the relationship between PCD-related gene risk models and anti-tumor immunity in STAD patients, the CIBERSORT algorithm was used based on the TCGA database to display the proportion of immune cell infiltration in all STAD patients (Fig. 8A, 8B). An additional analysis using the single-sample Gene Set Enrichment Analysis (ssGSEA) was conducted to further validate our findings (Figure S4). To determine whether differential correlations exist between immunomodulators and risk scores. The bar chart shows that the risk score has a positive correlation with immunomodulators such as SELP, CD276, TGFB1, VEGFB, ENTPD1, etc., and the risk score has a negative correlation with immunomodulators such as HLA-DQB1, HLA-DRA, BTN3A1, CXCL10, IFNG, etc. (Fig. 8C). Furthermore, to identify the stromal score (stromal cells in the tumor tissue) between the high- and low-risk groups, the immune score (the infiltration of immune cells in the tumor tissue) and the estimated score (the sum of the stromal and immune scores from individual cases) were compared), and these scores were significantly higher in the high-risk group (P < 0.05) (Fig. 8D–F).
Fig. 8
Immune microenvironment analysis of risk prognostic model A Proportions of immune cells invading patients in the TCGA cohort; B Box plot of differences in immune infiltration levels; C Bar plot of the link between immunomodulators and risk scores in patients with STAD; D–F The expression profiles of high-risk and low-risk groups in the immunological microenvironment. (Immune score, Stromal score, ESTIMATE score)
Sensitivity analysis of various drugs for patients in high and low-risk score groups.
To further explore the differences in drug resistance potential between high-risk and low-risk groups of STAD patients. The IC 50 levels of the two groups of chemotherapy drugs were compared. Among them, the IC50 differences of 12 representative drugs are shown (Fig. 9). It was found that 12 representative drugs, including Venetoclax, Afatinib, Osimertinib, Kras(G12C) Inhibitor-12, Lapatinib, Podophyllotoxin, Oxaliplatin, Tamoxifen, and Wnt-C59, may not be suitable for patients in the high-risk group.
Fig. 9
IC50 values of chemotherapy drugs for patients in low-risk and high-risk groups
3.8 Single-cell RNA sequencing analysis for PCD in STADThe single-cell data set STAD_GSE167297 in the TISCH database was used to analyze the expression of 3 model genes within the tumor microenvironment (TME). In the STAD_GSE167297 data set, there are 9 cell types, and the distribution and number of various cell types are shown (Fig. 10A). E2F2 is mainly expressed at higher levels in CD8+T and Epithelial cells (Fig. 10B, G); IRGM is mainly expressed at higher levels in B cells (Fig. 10C, G); MAGEA3 is mainly expressed at higher levels in Epithelial cells (Fig. 10D, G); NOS3 is mainly expressed at higher levels in Endothelial cells (Fig. 10E, G), and SERPINE1 is mainly expressed at higher levels in Endothelial and Fibroblasts cells (Fig. 10F, G).
Fig. 10
Expression of each gene in the model in STAD single cells A Annotation of all cell types in GSE167297; B Distribution of expression of E2F2, IRGM, MAGEA3, NOS3, and SERPINE1 in single cells; C Expression of E2F2, IRGM, MAGEA3, NOS3, and SERPINE1 in cells picture
Due to data limitations of THE HUMAN PROTEIN ATLAS (The Human Protein Atlas) database, we only found CD24 and SERPINE1 immunohistochemical staining in normal tissues and STAD. We found that the expression of CD24 and SERPINE1 was significantly elevated in STAD tissues (Fig. 11A–B, D–E) The PPI network has been constructed using a web-based visualization resource STRING, and the network is displayed in Fig. 11C. The figure shows the involvement and association among the signature genes in PPI network. For the SERPINE1, we also studied the impact of high and low expression on the survival of STAD patients and found that patients with high SERPINE1 expression had a significantly lower survival probability, which once again verified the accuracy of this PCD prognostic model (Fig. 11F).
Fig. 11
Immunohistochemical staining of CD24 and SERPINE1 in normal tissues and STAD A–B, D–E; Construction of protein interaction network of PCD model genes C; Kaplan–Meier survival analysis of high and low expression of SERPINE1 F; Box plot of differences in immune infiltration of high and low expression of SERPINE1 I
Comments (0)