
Remember me
We conducted a longitudinal study using data from the Urban Health Centres Europe project, which aimed to improve the healthy aging of older adults in five European countries (the UK, Greece, Croatia, The Netherlands, Spain). The study conducted baseline measurements of participants in May 2015 and followed up with a second assessment 12 months later in June 2017 [12]. The project provided integrated care pathways and assessments for participants in the intervention group [13], which involved risk assessment, shared decision-making, and referral to care pathways aimed at preventing frailty, fall risk, loneliness, and inappropriate medication use. Face-to-face self-reported semi-structured interviews were conducted by a trained researcher at baseline and 1-year follow-up [13]. Ethical review procedures have been followed in all cities and approvals have been provided. Written informed consent was obtained from all participants. The study was registered as ISRCTN52788952 [12, 13]. Further details on the study design were described elsewhere [12, 13].
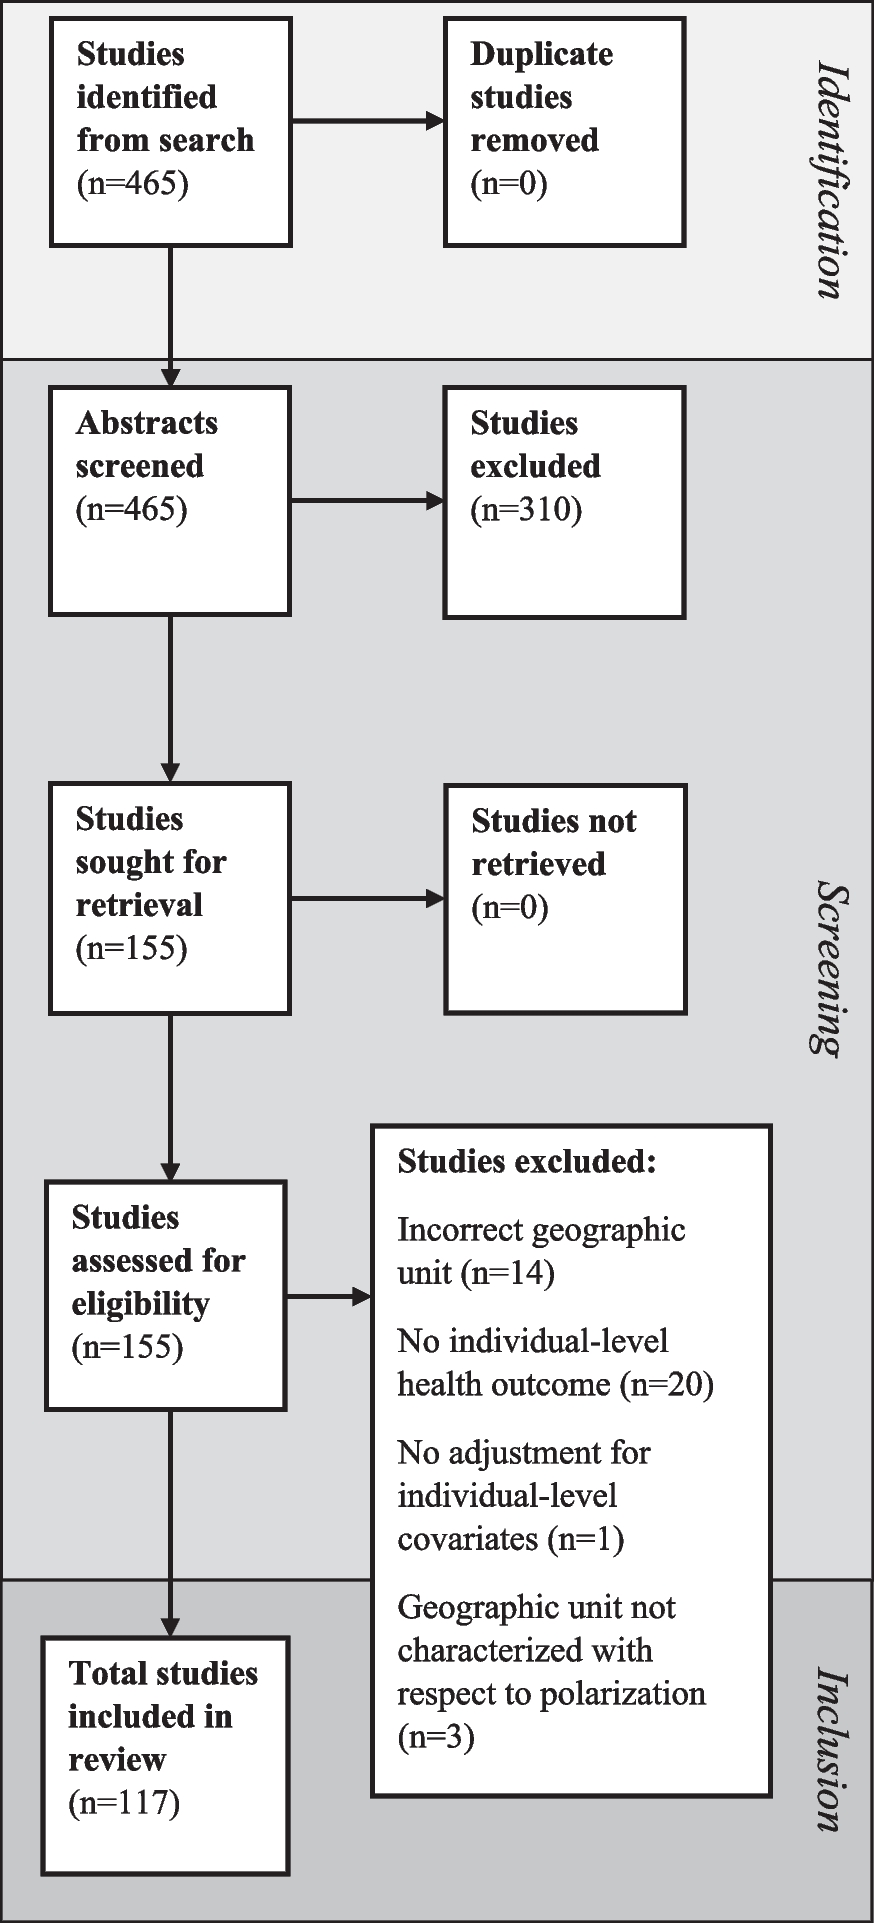
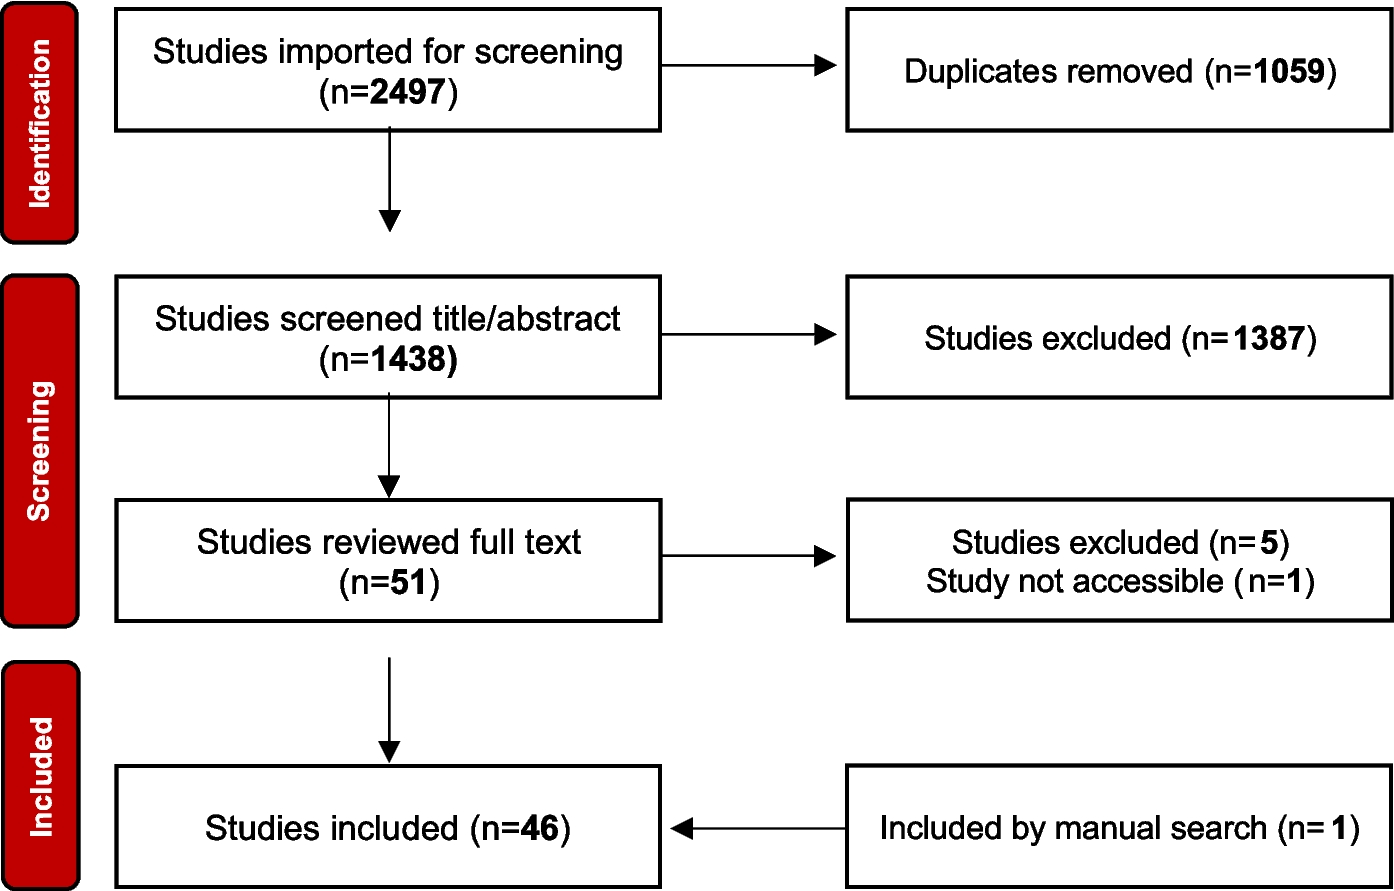
ParticipantsA total of 2325 older adults who lived independently and, according to their physician, could participate for at least 6 months were enrolled at baseline [12]. Participants who dropped out at follow-up (n = 481), with missing data on physical, psychological, and social frailty (n = 63) were excluded. Thus, 1781 participants were included in this study (Fig. 1).
Fig. 1
The flow chart of the study population
ProceduresThree Domains of FrailtyThe Urban Health Centres Europe assessment evaluated frailty using the Tilburg Frailty Indicator, a validated tool consisting of 15 self-reported questions covering physical, psychological, and social domains [14,15,16]. Physical frailty is assessed by eight items covering physical health, unexplained weight loss, difficulties in walking, balance, hand strength, physical tiredness, eyesight, and hearing impairments. Psychological frailty is assessed by four items addressing problems with memory, feeling down, feeling nervous or anxious, and inability to cope with problems. Social frailty is assessed by three items regarding living alone, lack of social relationships, and lack of social support. The score range of physical frailty is 0 to 8, psychological is 0 to 4, and social is 0 to 3. Higher scores indicate greater frailty in each domain, with cutoff points of 3 for physical frailty, 2 for psychological frailty, and 2 for social frailty [17].
CovariatesThe study’s covariates were assessed at baseline and included age (years), sex (female, male), education level (primary or less, secondary or equivalent, and tertiary or higher), country of residence (UK, Greece, Croatia, The Netherlands, and Spain), living composition (living with others/living alone), alcohol use (yes, no), physical activity (once a week or less/more than once a week), and the number of chronic conditions.
Educational level was classified into three categories regarding the highest level of education gained by a participant [18]. Alcohol use was assessed using the Alcohol Use Disorders Identification Test and dichotomized as a hazardous drinker or active alcohol use disorder (yes/no) [19]. Physical activity was measured by the frequency of low- or medium-energy-level activities [20]. Answers include “once a week or less” and “more than once a week” [5]. The number of chronic conditions was measured as a score (0 to 15) as having or not experienced 14 common chronic conditions and other conditions which did not mention (Supplementary Table S1). Covariates included whether the participants were in the intervention group (yes/no) and the frailty domain that was not the main outcome.
Statistical AnalysesThe study population characteristics were described using descriptive statistics: continuous variables were summarized by means and standard deviation (SD) and categorical variables using frequencies and percentages.
Linear regression analyses were used to examine unidirectional associations for each outcome, with three models conducted: (1) a crude model adjusted for the intervention group, (2) a model adjusted for covariates and intervention group, and (3) a model additionally adjusted for the baseline assessment of the outcome. Given that “living composition” is one of the items of social frailty, we choose not to include it as a covariate in the models for social frailty as a primary outcome. “Betas (β)” reported in the results section are “standardized linear regression coefficients.” Standardized linear regression coefficients represent the strength and direction of the relationship between predictor variables and the outcome variable after standardizing all variables involved. Missing data was imputed five times using full conditional specification and pooled using Rubin rules.
Bi-directional associations between the frailty domains were investigated by a cross-lagged panel modeling approach using two-time measurements [21, 22]. This approach aims to assess the directional effects of one variable on another at different points in time [23]. “Betas (β)” reported in the results section of the cross-lagged panel model are “standardized linear regression coefficients.” These coefficients provide insights into how changes in one variable at an earlier time point are associated with changes in another variable at a later time point, while accounting for the variability and scales of the variables. Wald tests were performed to determine differences between opposing coefficients of lagged effects. While the cross-lagged panel modeling approach enables the analysis of interdependent variables’ reciprocal and longitudinal relationships under the assumption of synchronous measurements and stationary relationships [21,22,23]. However, the results should be interpreted with caution since these assumptions may be invalidated due to the data collection complexity and varying degrees of stationarity [21, 22]. The cross-lagged panel modeling accounted for the cross-sectional associations and continuity within repeated assessments over time, with covariates assessed at baseline and regressed on the three domains of frailty at 1-year follow-up. Given that “living composition” is one of the items of social frailty, we choose not to include it as a covariate in the models for social frailty as a primary outcome. The parameters in the cross-lagged panel modeling were estimated using the maximum likelihood estimation with robust standard errors to account for the non-normality of the data. In addition, full information maximum likelihood was used to account for missing values of the covariates [21].
Descriptive and unidirectional analyses (linear regressions) were conducted in the IBM SPSS Statistics for Windows (version 25 Armonk, NY, USA: IBM Corp). The cross-lagged panel modeling was performed with the lavaan package in R (version 4.1.2; R Development Core Team) within the RStudio (version 2021.09.2 × 64 ENG) platform.
Non-response AnalysisThe response group (n = 1844) included participants with both baseline and follow-up information, while the non-response group (n = 481) dropped out at follow-up. Baseline characteristics were compared between groups using T-tests for continuous variables and chi-square tests for categorical variables.
Comments (0)