Chromium (Cr) and its salts are involved in plenty of industrial processes, such as the manufacturing of paints, dyes, plastics, and stainless steel, the wood treatment, and the leather tanning. Unlike its trivalent form (Cr3+), hexavalent chromium (Cr6+) poses a serious environmental problem (Fu et al., 2021; Lara et al., 2021; Wang et al., 2022; Aguilar et al., 2023; Mohanty et al., 2023) and triggers harmful effects that make its elimination essential (Wang et al., 2021; Aké et al., 2022; Alharbi et al., 2022). Moreover, Cr6+ is found to be particularly hazardous to health (Tangahu et al., 2020; Aparicio et al., 2021) and responsible for dysfunction in living organisms (Tripathi et al., 2018; Chromikova et al., 2022). Hence, Cr6+ removal has become the focus of attention in health and safety projects (Tumolo et al., 2020; Anupong et al., 2022; Ariram et al., 2022).
Based on these considerations, it is obvious that substantial efforts were deployed toward building environmentally friendly solutions for the treatment of chromium (VI). In this context, researchers developed biological methods making use plants and microorganisms to detoxify the environment (Xia et al., 2019; Yasir et al., 2021). Bacteria and fungi repeatedly demonstrated their ability to resist or remove Cr6+ present in environmental or culture media (Chang et al., 2016; Kalsoom K. et al., 2021; Aké et al., 2023). Indeed, it has been shown that anaerobically or aerobically cultivated bacteria in laboratory can eliminate the synthetic Cr6+ contained in culture media via a number of mechanisms (Lin et al., 2020; Plestenjak et al., 2022). In an earlier work, we demonstrated the aerobic reduction of Cr6+ to trivalent chromium by cultures of Bacillus licheniformis, Bacillus megaterium, Byssochlamys sp., and Candida maltosa strains isolated from tannery effluents (Aké et al., 2023). Similar reduction of Cr6+ to Cr3+ was observed for Penicillium sp. PL17, Fusarium proliferatum FBL1, Aspergillus fumigatus ML43, and Rhizopus sp. CUC23 (Bibi et al., 2018). The ability to reduce Cr6+ is one of the mechanisms of strain resistance to Cr (Aké et al., 2023) that include biosorption, bioaccumulation, biotransformation, and efflux systems (Gang et al., 2019; Xia et al., 2019; Ayele et al., 2021; Elahi et al., 2022; Plestenjak et al., 2022). Microorganisms can act as adsorbents, similar to carbon nanotubes, activated carbon, graphene oxide, polymers, clays, green slow-releasing denaturing colloidal substrates (such as gelatin, agar, and cane molasses), and their recently-used modifications (Sathvika et al., 2019). Once Cr6+ is in the vicinity of the cell, it can be attached (adsorption) to the cell's surface by specific molecules (COOH, NH3+, etc.) and subsequently reduced to Cr3+. This reduction may be spontaneous or due to a cytochrome network in the cell wall (Thatoi et al., 2014; Upadhyay et al., 2017; Li et al., 2021; Mat Arisah et al., 2021). Chromium adsorption can be checked by measuring its content after the cell washing (exposure), allowing one to quantitatively assess the concentrations of adsorbed ionic species, especially Cr6+ and Cr3+ ions. On the other hand, the researchers can identify the families of molecules involved in the adsorption of Cr6+ using Fourier transform infrared spectroscopy (FTIR) analyses (Kaduková and Virčíková, 2005; Sharma et al., 2022). Besides adsorption on the cell surface, chromium can penetrate the microbial cell through sulfate and phosphate transporters (SO42-, PO43-), and Cr6+ can undergo enzymatic or non-enzymatic reduction (indirect reduction) inside the cell (Thatoi et al., 2014). The ability of microorganisms to adsorb Cr6+ and Cr3+ was also demonstrated using scanning electron microscopy (SEM) combined to energy dispersive X-ray spectroscopy (EDX) (Abo-Alkasem et al., 2022; Chromikova et al., 2022). At high concentrations, the authors found cellular modifications due to high Cr6+ concentrations (Abo-Alkasem et al., 2022; Chromikova et al., 2022). Therefore, the combination of FTIR and SEM-EDX analyses is a powerful tool to understand the Cr resistance mechanisms. While FTIR relies on the vibrational behavior of Cr-loaded cells to identify the chemical environments and involved functional groups, SEM and EDX provide an overview of the surface morphology and elemental contents in treated specimens. However, this approach is not sufficient since it does not provide insight into the electrical phenomena that occur between Cr molecules and ligands on the surface of microorganisms. The study of the electrical charges surrounding the cells enables a better understanding of the interactions between metals and microbial cells. To that end, zetametry is an effective tool to assess the electric charge that a particle, in suspension or in solution, acquires from the surrounding ion cloud using the potential difference between the particle-medium interfacial layer and the medium (the so-called zeta potential) (Samaké, 2008; Al-Jubory et al., 2020; Youssef et al., 2020). The combination of FTIR, SEM, EDX, and zetametry measurements has been used successfully in the study of Cd(II) biosorption by Bacillus cereus RC−1 cells, for instance (Huang et al., 2013) but not in a study of Cr6+ adsorption by bacteria and fungi.
Accordingly, the aim of the present work is to examine the potential of chromium (VI) adsorption and its biotransformation into chromium (III) using indigenous strains of Bacillus licheniformis, Bacillus megaterium, Byssochlamys sp., and Candida maltosa that were isolated from tannery effluents. SEM-EDX characterizations were carried out for the investigated biomasses to probe the modifications in morphology and chemical makeup after Cr loading. Similarly, FTIR characterizations were also performed to reveal the major vibrational alterations after treatment with chromium in order to incriminate the possible functional groups involved in the metal-microbial strain interactions. In this respect, we carried out in-depth analyses of vibrational modes in the investigated strains to provide a useful literature impetus about the infrared signature of investigated strains. Moreover, zeta potential characterizations were performed to assess the modifications in the electrical behavior of the strain environment upon Cr loading.
2 Materials and methods 2.1 Microorganism isolationThe raw tannery effluent was sampled from Bab Dbagh and the industrial district at Marrakech tannery manufacturing, which operates with chrome-tanning processes. Bacillus licheniformis, Bacillus megaterium, Byssochlamys sp., and Candida maltosa strains were isolated from tanneries effluents and identified using the previously reported molecular methods (Aké et al., 2023).
2.2 SEM-EDX analysisCulture pellets were subjected to SEM and EDX characterizations in order to confirm Cr adsorption and to examine the impact of Cr on cell morphologies. The experimental procedure was similar to that applied by Karthik et al. (2017). After incubation for 96 h, the cells in 100-μL precultures with 0, 5, and 50 mg/L Cr6+ were harvested by centrifugation at 5000 rpm. After washing with a 0.1 mM phosphate buffer solution (pH 7) to remove the cells from the culture medium, the pellets were fixed overnight in 3% glutaraldehyde at 4 °C. Subsequent dehydration cycles using ethanol at different volume concentrations (20%, 40%, 60%, 80%, 90%, and 100%) were applied to the pellets treated with glutaraldehyde. The surface morphology and the chemical composition of dehydrated strains supported on carbon sheets were analyzed using a TESCAN VEGA 3 scanning electron microscope equipped with an energy-dispersive X-ray spectrometer. The SEM images were obtained by detecting the secondary electrons emitted by the samples when excited with a beam of 10 keV energy. The EDX spectra were recorded at a beam energy of 5 keV to detect the prominent Cr Lα radiation with an energy of about 0.57 keV. Further analyses were performed with a beam energy of 10 keV to check the detection of Cr Kα and Kβ characteristic lines located at 5.41 and 5.95 keV, respectively. Microbial cells cultured without Cr6+ were used as a control and are referred to as “native” hereafter.
2.3 FTIR analysisIn order to determine the impact of Cr6+ on the functional groups of the microbial cell surface, 100 μL of preculture (24 h) of each strain was introduced into Luria-Bertani (LB) broth containing 50 mg/L Cr6+ (30 °C, pH 7). At the same time, a control without Cr6+ was prepared for each strain. After 96 h incubation, the cells were then collected in 15 mL tubes and centrifuged at 5000 rpm (20 min, 4 °C). After that, the preparation procedure was performed according to the analytical method used by Maurya et al. (2022). The pellets were washed with a 0.1 mM phosphate buffer solution (pH 7) to remove to remove the cells from the culture medium, then freeze-dried using a Martin Christ Alpha 1-2 LO plus lyophilizer. A total 0.099 g of KBr powder was mixed with 0.001 g of each powder pellet obtained and grinded in a mortar. After mixing, the product was ground, homogenized, and then pressed into pellets using a compressor. The as-obtained pellets were introduced into a Bruker Vertex 70 FTIR spectrometer. Each IR spectrum was obtained by averaging 31 scans recorded in the 400–4000 cm−1 range with a wavenumber step of 2 cm−1.
2.4 Zeta potential analysisIn order to understand the electrostatic interactions between the microbial cell and Cr6+, the zeta potential measurements were carried out using a Malvern zetasizer ver. 7.12. To that end, a modified experiment derived from Beiranvand et al. (2022) was applied. Different concentrations of Cr6+, namely 25, 50, 100, 250, 500, and 800 mg/L, were prepared in distilled water. The inoculum of each strain was added to each Cr6+ concentration (5 mL). Positive controls, i.e., solutions without inocula, were also prepared. The zeta potential was also measured in pure distilled water.
2.5 Statistical analysisThe experiments from the study were carried out in triplicate. The data obtained were statistically analyzed and are presented with the appropriate standard deviation. ANOVA tests were carried out to better understand the effect of the microbial strain treatments. Post-hoc tests were then applied to observe the significance between groups. The least significant differences among means were evaluated at the 5% significance level. IBM SPSS Statistics 25 was used for the statistical analysis of the data.
3 Results 3.1 SEM analysisThe SEM images of Figure 1 depict the morphologies of the Bacillus licheniformis, Bacillus megaterium, Byssochlamys sp., and Candida maltosa strains without Cr treatment (upper images) and after exposure to 5 and 50 mg/L of hexavalent chromium (middle and bottom images, respectively). These SEM images are displayed with the same magnifications to show specific features in structure of each sample.
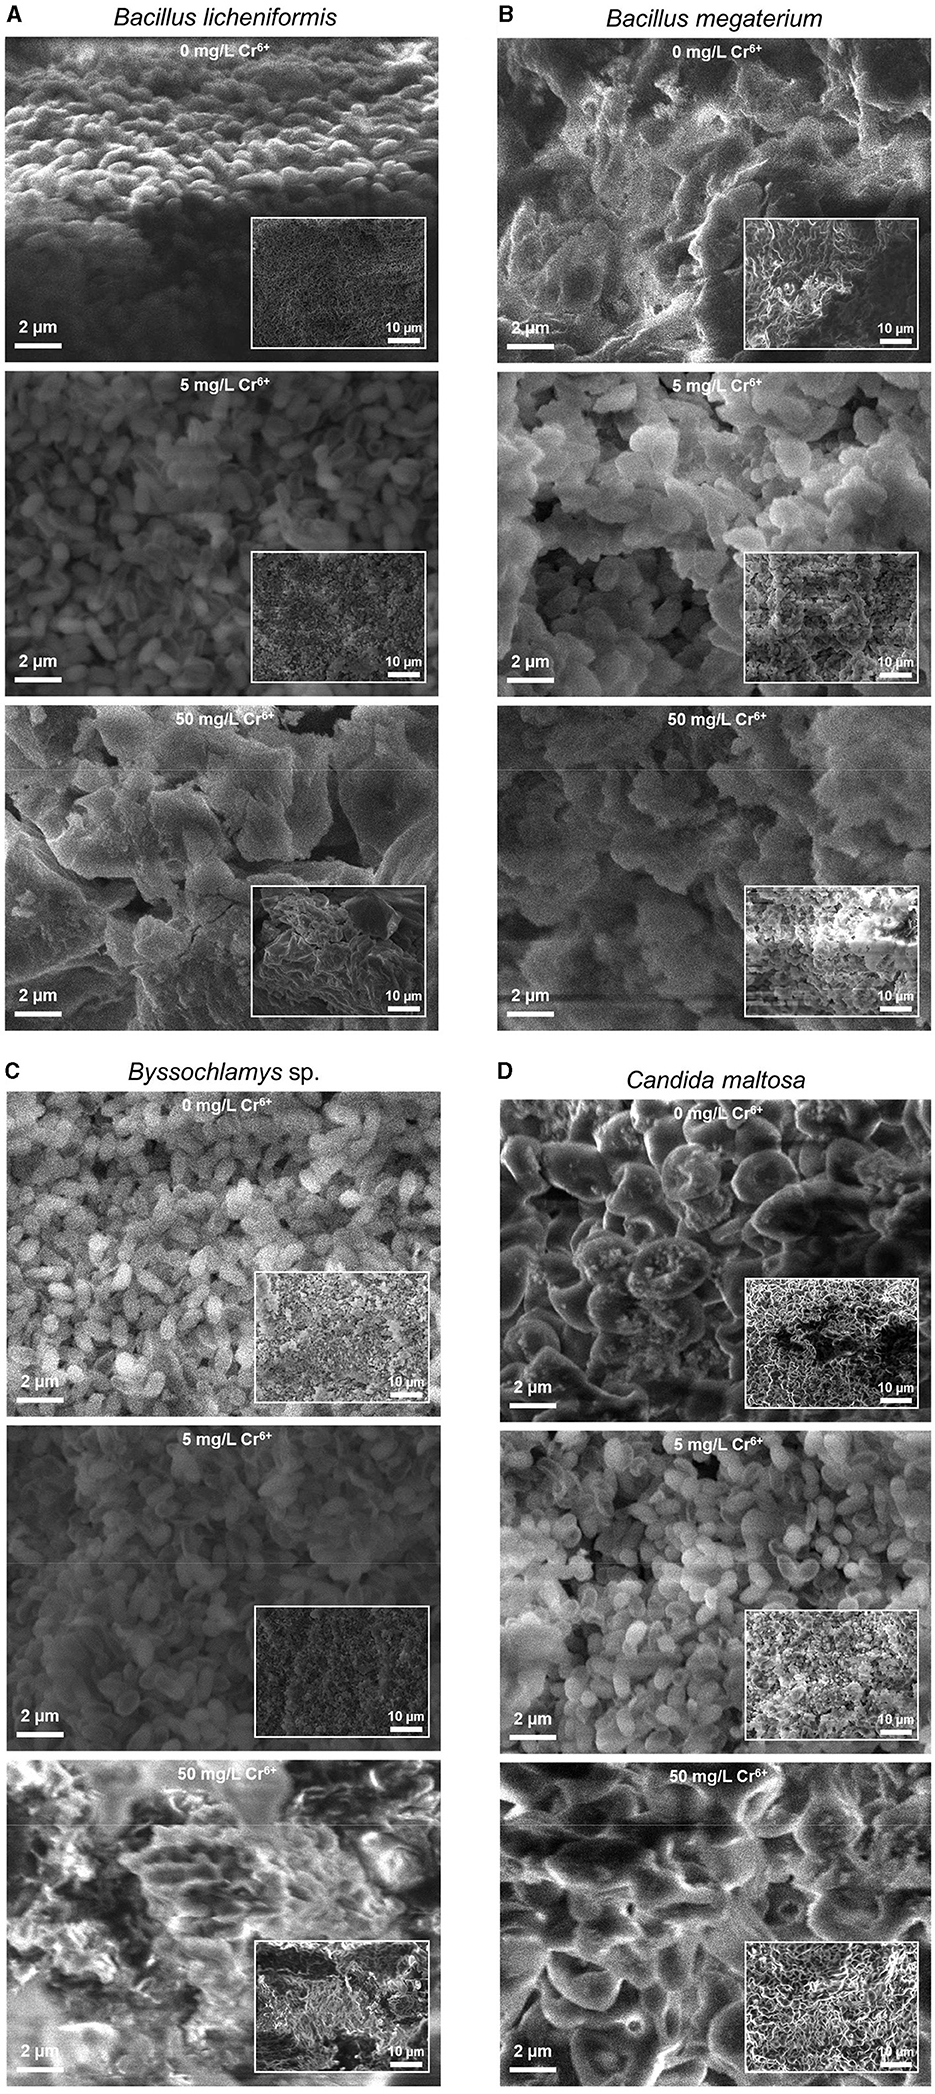
Figure 1. Secondary electron SEM images of the native (upper images) and treated strains with 5 (middle images) and 50 mg/L Cr6+ (bottom images) in LB medium for Bacillus licheniformis (A), Bacillus megaterium (B), Byssochlamys sp. (C), and Candida maltosa (D) strains isolated from tannery effluents. The SEM images and the inset low-magnification secondary electron SEM images are displayed with the same scales for all the samples.
In the case of the Cr6+-free Bacillus licheniformis strains, the cells are smooth, compact, and firmly grouped in the form of asymmetric clusters (Figure 1A). In addition, the native cells are typically regular in shape, and their assembly gives rise to a domed structure with corrugations. After contact with 5 mg/L Cr6+, the cells are still smooth and clustered, with a quite regular cell size. In other words, both of the native bacterial biomass and that exposed to 5 mg/L Cr6+ show similar cell surfaces. However, at 50 mg/L Cr6+, the appearance of the bacterial biomass is altered and shows wrinkled, rough, and irregular clusters of less distinct cells, with possible extracellular secretions.
In contrast, the Bacillus megaterium strains do not show very distinct cell shapes, either in the absence or presence of Cr6+ (Figure 1B). The cells form aggregates with apparent depressions and exhibit a very compact texture with irregular edges that appear to be bound with an extracellular matrix. The visual examination of SEM images suggests a higher content of extracellular secretions in the control than in the strains grown at 5 and 50 mg/L Cr6+.
For the Byssochlamys sp. strains (Figure 1C), the control and the strain loaded with 5 mg/L Cr6+ show the same appearance. Indeed, the cells appear smooth, less bound, and exhibit a few corrugations. In contrast, the strain cultured with 50 mg/L Cr6+ show a different topography since the cells are tightly bound and offer a compact space upon exposure to Cr6+.
Similarly, the Candida maltosa control cells and those treated with 5 mg/L Cr6+ show a smooth outline morphology with visible depression regions (Figure 1D). The SEM image of native strains shows structures of a regular size in the 1–2 μm range, which corresponds to the typical size of the Candida maltosa cells. However, at 5 mg/L Cr6+, some cells are less visible and form irregular blocks. At a concentration of 50 mg/L Cr6+, several cells had lose their initial structures and appear slightly rough and deformed.
3.2 EDX analysisEDX analysis was performed to determine whether the microbial cell surfaces are capable of bio-adsorbing Cr. Figure 2 shows the EDX analysis of Bacillus licheniformis, Bacillus megaterium, Byssochlamys sp., and Candida maltosa strains grown without Cr treatment and after loading with 5 and 50 mg/L Cr6+. The determined weight and atomic percentages of Cr (Cr wt.% and Cr at.%, respectively) are given in Table 1.
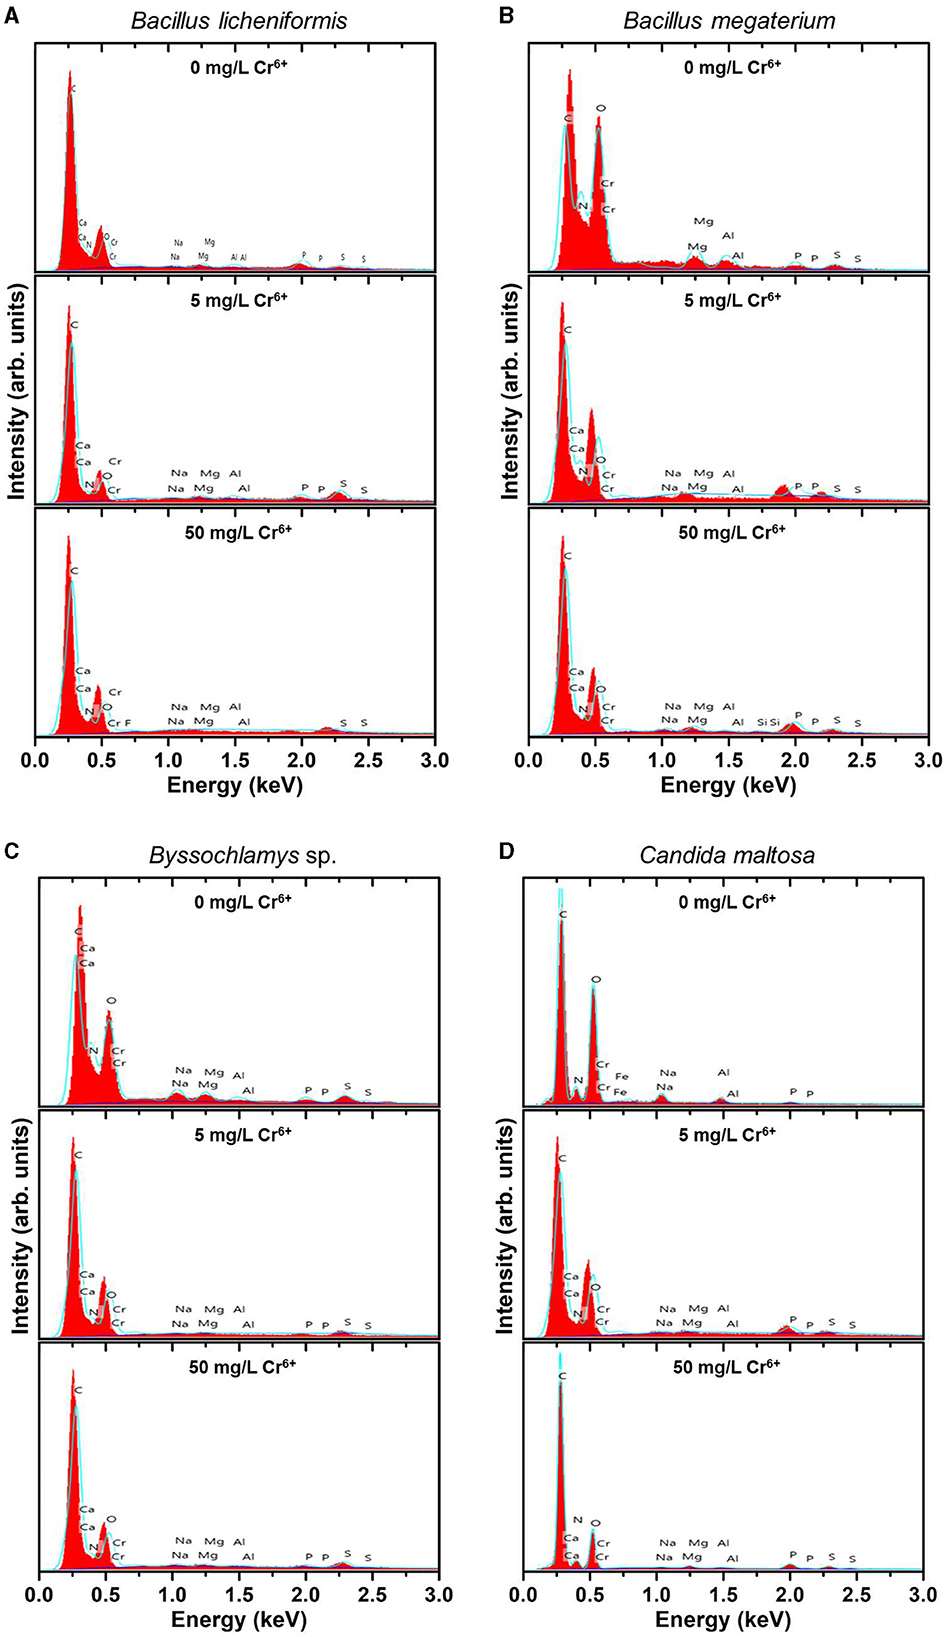
Figure 2. EDX spectra of the native (upper spectra) and treated strains with 5 mg/L Cr6+ (middle spectra) and 50 mg/L Cr6+ (bottom spectra) in LB medium for Bacillus licheniformis (A) Bacillus megaterium (B), Byssochlamys sp. (C), and Candida maltosa (D) strains isolated from tannery effluents.
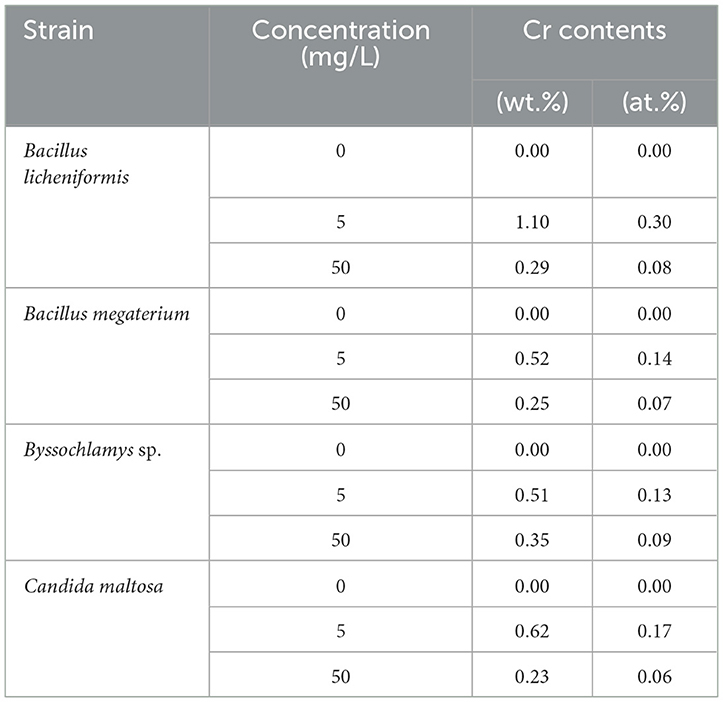
Table 1. Weight and atomic percentages of Bacillus licheniformis, Bacillus megaterium, Byssochlamys sp., and Candida maltosa microbial biomasses before (0 mg/L Cr6+) and after treatment with 5 and 50 mg/L Cr6+.
Besides the characteristic C K line (overlapping of the Kα and Kβ peaks) located at about 0.28 keV, the EDX spectra of all the control strains show no signature of the Cr Lα feature (at 0.57 keV) but the neighboring O K feature arising from the overlapping Kα and Kβ peaks (located at ~0.52 and 0.53 keV, respectively). The nitrogen signature (expected at 0.39 and 0.4 keV) is not discernible from the prominent carbon peak. Additional small peaks at energies consistent with the Kα and Kβ lines of Na (1.04 and 1.07 keV), Mg (1.25 and 1.3 keV), Al (1.49 and 1.55 keV), P (2.01 and 2.14 keV), and S (2.31 and 2.47 keV) are also observed. The presence of these peaks probably originates from compounds present in the cell wall.
In contrast, the biomasses that has grown in the Cr6+-amended culture media show the abovementioned Cr peak (Cr Lα line at 0.57 keV). After treatment of the microorganisms with 5 mg/L Cr6+, the EDX analyses reveal Cr weight percentages of 1.1, 0.52, 0.51, and 0.62 and atomic percentages of 0.30, 0.14, 0.13, and 0.17 for Bacillus licheniformis, Bacillus megaterium, Byssochlamys sp., and Candida maltosa, respectively. Nevertheless, chromium contents decrease in each strain after exposure to 50 mg/L Cr6+; the Cr weight percentages were 0.29, 0.25, 0.35, and 0.23, and the Cr atomic percentages were 0.08, 0.07, 0.09, and 0.06 for Bacillus licheniformis, Bacillus megaterium, Byssochlamys sp., and Candida maltosa, respectively.
3.3 FTIR analysisThe FTIR spectra of the investigated strains consist of numerous overlapping bands, most of which are derived from protein, lipid, amino acid, and carbohydrate functional groups. Table 2 summarizes the prominent identified vibrations and corresponding assignments for the Bacillus licheniformis, Bacillus megaterium, Byssochlamys sp., and Candida maltosa specimens, before and after chromium loading.
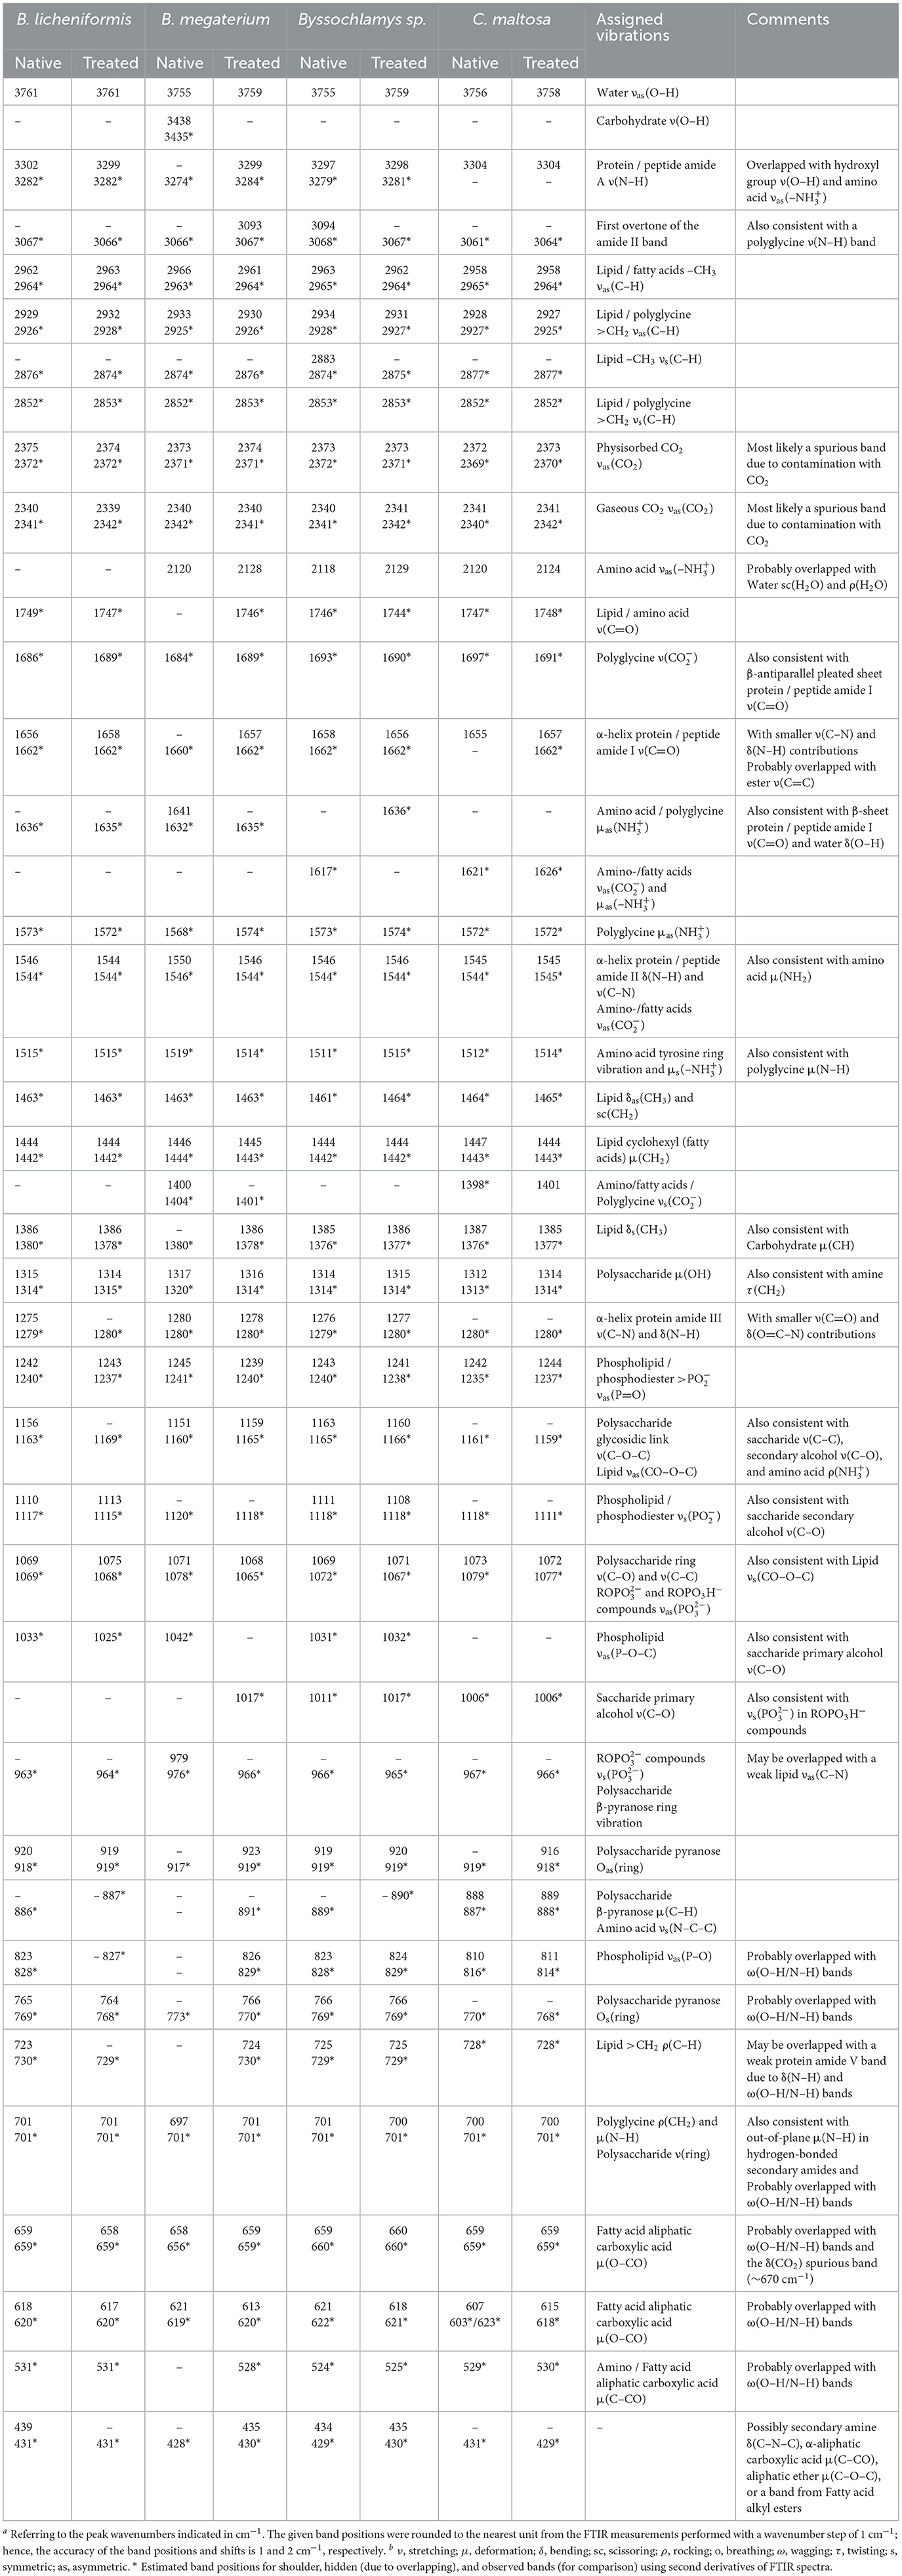
Table 2. Frequenciesa and tentative assignment of prominent vibrational modesb in native and chromium(VI)-treated Bacillus licheniformis, Bacillus megaterium, Byssochlamys sp., and Candida maltosa strains as identified from FTIR measurements.
As depicted in Figure 3, the FTIR spectrum of the native Bacillus licheniformis strains shows a prominent and asymmetric absorption band peaking at 3302 cm−1 due to protein and peptide N–H stretching (amide A band), which overlaps with a broad band related to O–H stretching from hydroxyl groups in carbohydrates (~3550–3150 cm−1), along with the NH3+ asymmetric stretching band from amino acids (~3200–3000 cm−1). Two strong secondary polyamide bands can be seen at ~1656 and 1546 cm−1. The vibration at 1656 cm−1 is ascribed to the amide I band in α-helical structures (proteins and polypeptides), which is dominated by C=O stretching (Venyaminov and Kalnin, 1990b; Socrates, 2001). In this regard, it is noteworthy to mention that C=C stretching in lipid esters (expected at about 1650 cm−1), β-type secondary structures of proteins (indiscernible features), along with CO2- and NH3+ vibrations in amino acids (around 1686 and 1636 cm−1), may have contributed to the above-assigned amide I band (Venyaminov and Kalnin, 1990a,b; Naumann, 2000; Socrates, 2001). The band at 1546 cm−1 corresponds to the amide II band originating from in-plane N–H bending and C–N stretching and gives rise to an overtone feature, as shown by the shoulder around 3090 cm−1 (~3067 cm−1 as determined using the second derivative).
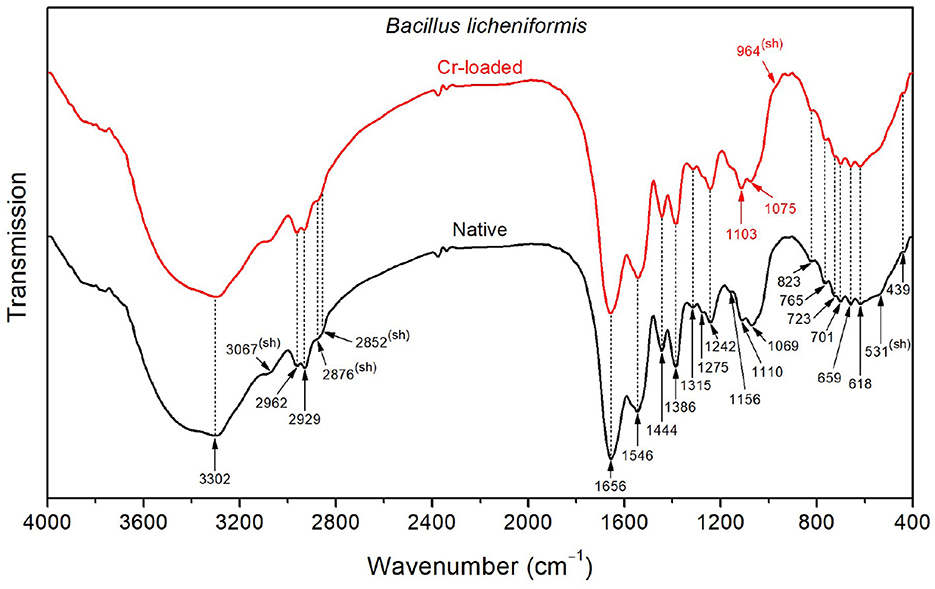
Figure 3. FTIR spectra of the Bacillus licheniformis bacterial strains before Cr loading (native) and after treatment with 50 mg/L Cr6+ (Cr-loaded).
Moreover, the CH3 and CH2 functional groups (fatty acid chains in lipids) exhibit characteristic C–H asymmetric stretching vibrations at 2962 and 2929 cm−1, respectively. The corresponding C–H asymmetric stretching vibrations were resolved into components at 2876 and 2852 cm−1, respectively, yielding a single shoulder-like feature at about 2860 cm−1. These aliphatic groups are also seen at 1444, 1386, and 723 cm−1, corresponding to CH2 deformation, CH3 symmetric bending, and CH2 rocking characteristic bands, respectively (Socrates, 2001). The FTIR spectra also display weak features corresponding to the amide III band in α-helical protein and peptide structures (caused by coupled C–N stretching and N–H bending) and the amide V band (originating from N–H bending), as shown by the shoulders at ~1275 and 726 cm−1, respectively.
Characteristic bands of phosphodiester, free phosphate, and polysaccharide functional groups are found in the 1250–900 cm−1 region. Indeed, the bands at 1242 and 1110 cm−1 are attributed to the phosphodiester stretching modes, while the band at 1069 cm−1 refers to free phosphate ionic species. However, the latter is also consistent with the stretching of C–O and C–C bonds in polysaccharide rings and C–O–C bonds in lipids (Wilson et al., 2000; Socrates, 2001). Similarly, the band at 1156 cm−1 is consistent with C–O–C stretching in lipids, C–O stretching in monosaccharide compounds (such as glucose), and C–O–C stretching of the glycosidic link in polysaccharides (Naumann, 2000; Socrates, 2001). The bands at 765 and 920 cm−1 also refer to symmetric and asymmetric breathing of the pyranose ring in polysaccharide compounds (Copíková et al., 2001; Socrates, 2001). In this regard, the vibration at 886 cm−1 is characteristic of the anomer C–H deformation in carbohydrates and provides evidence of the major β-form of the polysaccharide pyranose rings (Socrates, 2001; Hong et al., 2021).
In the wavenumber range below 900 cm−1, weak-to-medium intensity features are overlapped with a broad medium-to-strong band centered at roughly 660 cm−1. The latter is typical of hydroxyl group O–H wagging, but it can also include contributions from other hydrogen-bonded groups, such as water O–H or amide N–H wagging motions. The presence of α-amino-acids (such as glutamic acid and alanine) in the Bacillus licheniformis spore is supported by features related to O–CO (bands at 659 and 618 cm−1) and C–CO (shoulder at 531 cm−1) deformation vibrations in α-aliphatic carboxylic acids in this spectral range (Hughes, 1968). The band at 439 cm−1 cannot be restrainedly assigned by cross-referencing with other bands and is not used in the discussion hereafter.
The FTIR spectrum of native Bacillus licheniformis also includes hidden vibrations, such as the band at 1749 cm−1 originating from C=O stretching of carboxylic groups (esters and fatty acids), the band at 1515 cm−1 related to C–C stretching in the tyrosine aromatic ring (side-chain vibration in amino acids), or the band at 1463 cm−1 due to methyl and methylene vibrations (Schmitt and Flemming, 1998; Socrates, 2001; Tremmel et al., 2005; El-Naggar et al., 2020).
The broad weak band at around 2120 cm−1, which overlaps with the water scissoring and rocking vibrations, is related to amino acid NH3+ symmetric stretching (Socrates, 2001; Lasagabaster et al., 2006). Close to this band, the absorption features at 2375 and 2340 cm−1 correspond to asymmetric stretching of adsorbed and gaseous CO2, respectively (Busca and Lorenzelli, 1982; Seiferth et al., 1999) and are most likely brought on by residual contamination.
The Cr(VI) treatment brings about the rise of the shoulder band (~964 cm−1) and the shift (from 1069 to 1075 cm−1) of the PO32- symmetric and asymmetric stretching bands, respectively. Furthermore, the PO2- symmetric stretching band exhibits an increase in intensity along with a slight shift (from 1110 to 1113 cm−1). These changes suggest that the phosphate-containing compounds are involved in the interaction with metal ions. This interaction yields the emergence of negative phosphoryl groups as a result of a deprotonation process. This is further supported by the partial vanishing and the shift (from 1033 to 1025 cm−1) of the P–O–C stretching shoulder band. In addition, the increase of the PO2- band (~1110 cm−1) is related to the observed weakening of the CH3 stretching, as shown by the decrease in intensity of the band at 2929 cm−1 (with respect to the CH2 band). This is also substantiated by the relative decrease of the CH3 bending band (1386 cm−1) with respect to the CH3 deformation band (~1444 cm−1) (Barkleit et al., 2011).
In contrast to Bacillus licheniformis, the high-frequency region in the native Bacillus megaterium spectrum (Figure 4) is dominated by the OH stretching band (3438 cm−1) superimposed with the NH stretching band (shoulder at 3274 cm−1). This is also visible at low frequencies, where the broad OH wagging (400–900 cm−1) fully dominates the cluster of characteristic polysaccharide and amino acid absorption bands in this range. These intense OH vibrations probably stem from the monosaccharide content (mainly composed of D-glucose, D-xylose, D-galactose, and L-arabinose) in the Bacillus megaterium capsule (Cassity and Kolodziej, 1984). Additionally, the amide I and II bands appear at shifted positions (1641 and 1550 cm−1, respectively) as a result of strong stretching of NH3+ and COO− in amino acids (Venyaminov and Kalnin, 1990a). This is in agreement with the medium and broad band observed at 2120 cm−1 originating from NH3+ asymmetric stretching and the COO− band at 1400 cm−1. Therefore, a broad medium band arising from NH3+ symmetric stretching in the 2760–2530 cm−1 region could explain the weak intensity of CH2 and CH3 bands and shoulders observed at 2966, 2933, 2874, and 2852 cm−1.
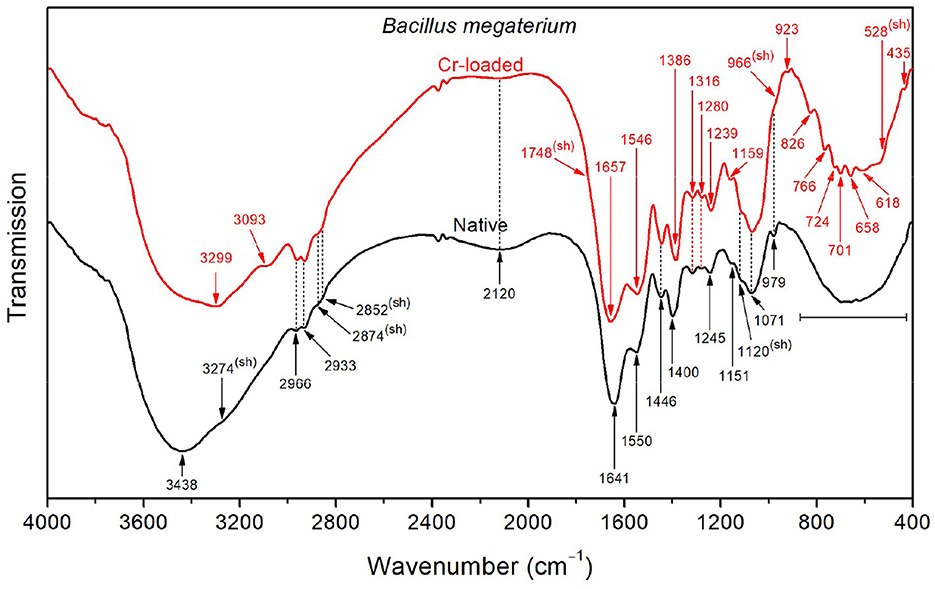
Figure 4. FTIR spectra of the native and Cr-treated (with 50 mg/L Cr6+) Bacillus megaterium bacterial strains.
Upon exposure of the Bacillus megaterium strains to Cr(VI), the intense OH stretching band undergoes a significant decrease in intensity, revealing the underlying NH stretching band at 3299 cm−1, which indicates that conformational changes occurred. Furthermore, the amide I and II bands appear at 1657 and 1546 cm−1, indicating the decrease of the amino acid NH3+ and CO2- bands, as mentioned above. Accordingly, the CH3 bending band appears at 1387 cm−1 as a result of the weakened CO2- symmetric stretching band. The emergence of a noticeable shoulder at 1748 cm−1 relative to C=O stretching in COOH functional groups also witnesses that the amino acids are involved in the interaction with chromium. The bands in the region below 900 cm−1 appear after chromium treatment as a result of the weakening of presumed OH wagging. However, the overall absorption in the 1800–900 cm−1 region increases after treatment with chromium, which could be tentatively assigned to the emergence of overtone features related to NH2 wagging in the 900–400 cm−1 region.
As shown in Figure 5, the FTIR spectrum of the native Byssochlamys sp. strains exhibits typical vibrational bands as seen previously, including the overlapped OH and NH stretching bands peaking at 3297 cm−1, CH2 and CH3 asymmetric stretching bands at 2963 and 2934 cm−1, and the characteristic vibrations of carbohydrates and lipids in the 900–400 cm−1 spectral region (Table 2). The main specificities lie in the broadened amide bands at 1658 and 1546 cm−1, most likely due to motions of the carboxylate and ammonium functional groups, as previously explained.
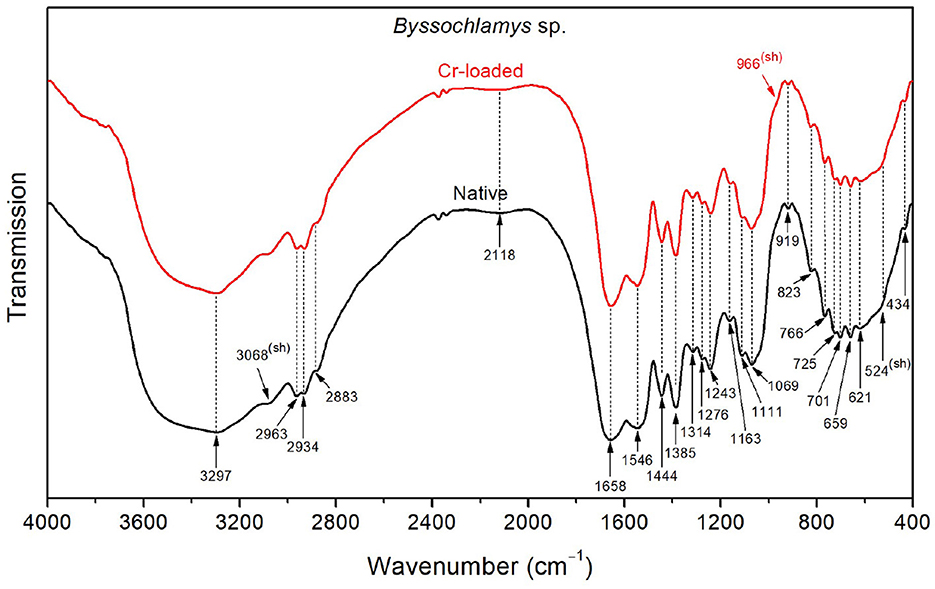
Figure 5. FTIR spectra of the Byssochlamys sp. strains before Cr loading (native) and after treatment with 50 mg/L Cr6+ (Cr-loaded).
After treatment with chromium, the high-frequency OH stretching band (~3400 cm−1) and the low-frequency OH wagging band (900–400 cm−1) slightly decreased in intensity. Additionally, the side of the amide I band toward low frequencies (i.e., lower than 1658 cm−1) and that of the amide II band toward high frequencies (i.e., <1546 cm−1) become narrower, which indicates reduced contributions from the NH3+ asymmetric deformation (found at 1626 and 1572 cm−1 for the treated strains).
With respect to Bacillus licheniformis, the spectrum of the native Candida maltosa strains (Figure 6) exhibits an intense broad O–H stretching band in the region 3650–3550 cm−1, along with a stronger O–H wagging in the region 900–400 cm−1. This is likely to arise from the hydroxyl-rich glycosylphosphatidylinositol in the outer layer (mannose-containing compounds) and the polysaccharide-rich inner layer (β-glucan and chitin) in the cell wall of Candida strains (Chaffin et al., 1998; Kapteyn et al., 2000; Gow et al., 2011; Zvonarev et al., 2021). Accordingly, the methylene groups (abundant in the phospholipid tail of glycosylphosphatidylinositol) show a stronger absorption with respect to the methyl groups, as shown by the asymmetric stretching bands (2928 and 2958 cm−1, respectively) and the sharpened shoulder band at 2852 cm−1 (i.e., at the position of symmetric stretching of CH2). This is also consistent with the strong absorption in the spectral ranges 1200–950 cm−1 due to the C–O stretching in polysaccharide C–OH and C–O–C branches (mannans) and 1400–1300 cm−1 due to carbohydrate OH and CH deformation vibrations (see Table 2). Besides, the amide I band (~1655 cm−1) is relatively broad, probably due to overlapping with the CO2- stretching features (~1697 and 1621 cm−1).
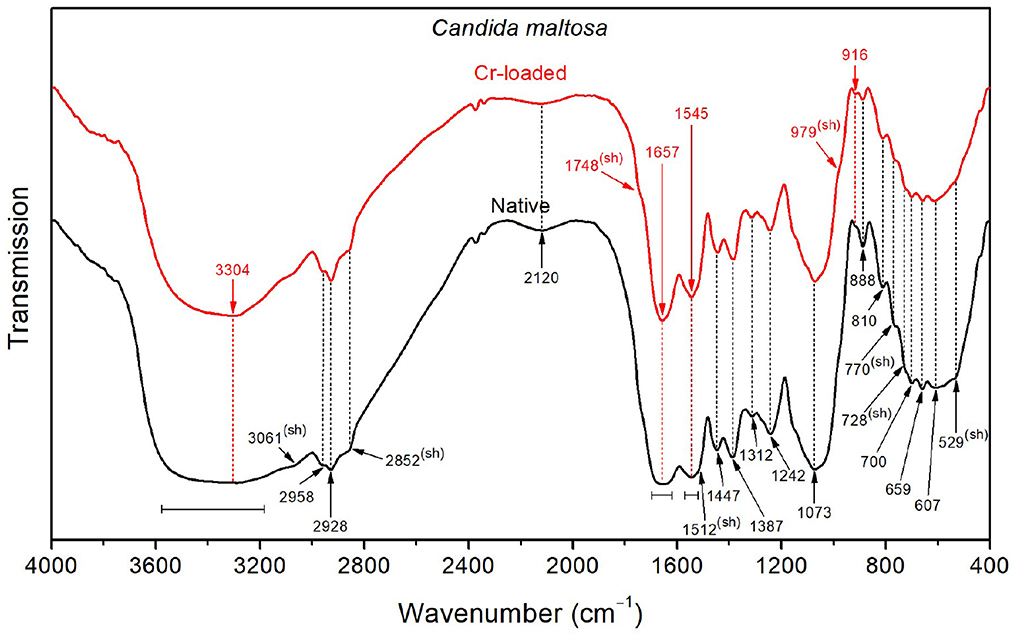
Figure 6. FTIR spectra of the Candida maltosa strains before Cr loading (native) and after treatment with 50 mg/L Cr6+ (Cr-loaded).
The FTIR spectrum shows a decrease in the intensity of the OH stretching band after loading with Cr(VI), suggesting that hydroxyl groups may be involved in the interaction with metallic ions. In addition, the shoulder relative to C=O stretching of –COOH functional groups (~1748 cm−1) becomes more noticeable after chromium treatment. The narrower amide I band (~1657 cm−1) for the treated strain probably originates from the partial vanishing of the CO2- stretching modes, which were also shifted (from 1697 to 1691 cm−1 and from 1621 to 1626 cm−1). The same effect can be seen for the amide II band (~1545 cm−1), probably due to the decrease of NH3+ deformation vibrations, as shown by the softened shoulder band at 1512 cm−1. This is further supported by the decrease in intensity of the NH3+ stretching band at 2120 cm−1 upon chromium treatment.
3.4 Zeta potential analysisThe zeta potential was measured for the four microbial strains in the absence and presence of different Cr6+ concentrations ranging from 25 to 800 mg/L (Table 3). Before contact with Cr6+, the microbial strains show different zeta potentials of about −10.63 ± 0.38, −15.9 ± 1.39, −8.98 ± 0.40, and −10.15 ± 2.68 mV for Bacillus licheniformis, Bacillus megaterium, Byssochlamys sp., and Candida maltosa, respectively. These negative potential differences with respect to the medium are related to the amounts of negative charges present at the vicinity of the microorganisms before being brought into contact with Cr6+.
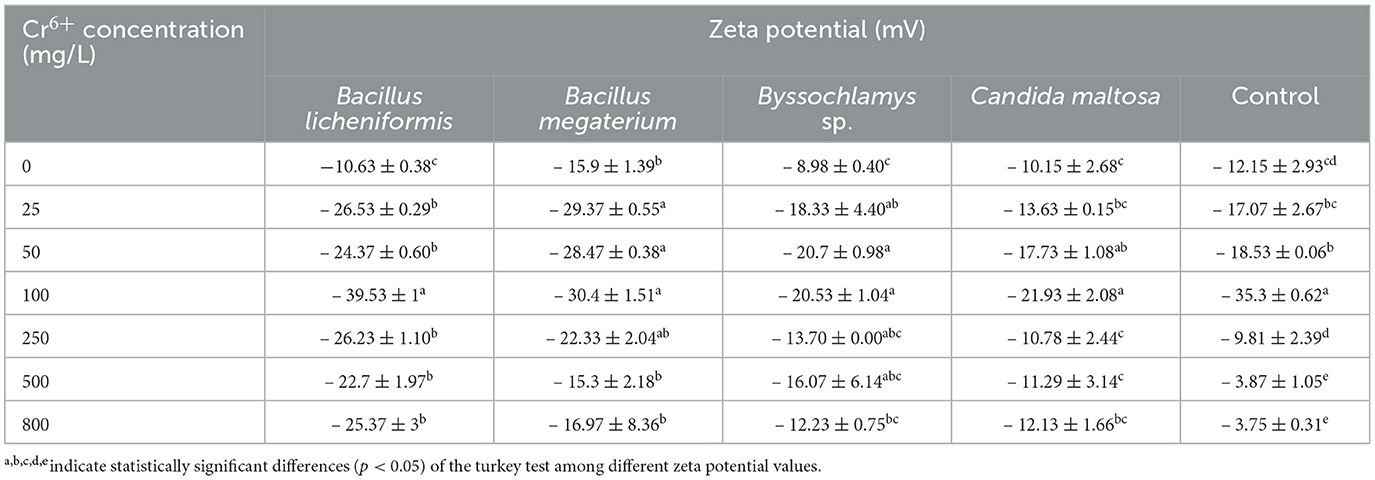
Table 3. Zeta potential of Bacillus licheniformis, Bacillus megaterium, Byssochlamys sp., and Candida maltosa strains in the absence and presence of different concentrations of Cr6+.
After exposure to chromium, the zeta potential of Bacillus licheniformis strains undergoes a significant change from −10.63 ± 0.38 (0 mg/L Cr6+) to −39.53 ± 1 mV (100 mg/L Cr6+), indicating that the cells in contact with Cr6+ have experienced an increase in negative charge. As the Cr6+ concentration increases in Bacillus licheniformis, the zeta potentials are statistically identical up to 100 mg/L. The zeta potential reaches the highest value (−39.53 ± 1 mV) at 100 mg/L before decreasing beyond that.
For Bacillus megaterium, the zeta potential range from −15.3 ± 2.18 to −30.4 ± 1.51 mV for the investigated Cr6+ concentrations. Significant differences are also observed between the control and the strains treated with different concentrations of Cr6+ (from 25 to 250 mg/L).
The Cr6+-treated Byssochlamys sp. show zeta potentials that are statistically different from those of the control. The zeta potentials are between −8.98 ± 0.40 and −20.7 ± 0.98 mV and correspond to the values for the Cr6+ concentrations of 0 and 50 mg/L. Statistically, the highest zeta potential values are −20.7 ± 0.98 and −20.53 ± 1.04 mV (50 and 100 mg/L of Cr6+). In contrast, the lowest value is recorded for the control (−8.98 ± 0.40 mV).
Finally, zeta potentials that are statistically different from the control were recorded for the Cr6+-treated Candida maltosa strains. This concerns the zeta potentials of treatments with 25, 50, 100, and 800 mg/L Cr6+. The zeta potential values range from −10.15 ± 2.68 to −21.93 ± 2.08 mV (control and 100 mg/L Cr6+).
4 DiscussionBiosorption (or bioadsorption) is a passive, rapid, and reversible physico-chemical phenomenon between a metal and a biological material (biosorbent) (Fernandez et al., 2018). It independent from cell activity carried out by active or inactive microorganisms (Fernandez et al., 2018). This process was assessed using SEM-EDX, FTIR analysis, and zeta potential measurements. Adsorption relies on hexavalent (or trivalent chromium produced by hexavalent chromium reduction) binding through a number of molecules. Biosorption is also the passive immobilization of metals by biomass. Sorption mechanisms at the cell surface take place independently of the cell's metabolism. These mechanisms are based on physico-chemical interactions between the metal and functional groups in the cell wall (Kaduková and Virčíková, 2005).
4.1 SEM analysisThe morphology of the microbial strains analyzed by SEM showed different characteristics. The Bacillus licheniformis strains have a smooth surface in the control and after treatment with 5 mg/L Cr6+. Similar results obtained by Hossan et al. (2020) showed that Klebsiella sp. have a smooth surface in the control cells. This smooth structure in untreated cells has also been observed in previous studies (Karthik et al., 2017; Bharagava and Mishra, 2018; Zhu et al., 2019; Kalola and Desai, 2020; Tan et al., 2020; Abo-Alkasem et al., 2022). Jobby et al. (2019), Selvakumar et al. (2021), and Su et al. (2021) demonstrated that the cells of Sinorhizobium sp. SAR1, Bacillus vietnamensis, Bacillus lentus, Alcaligenes faecalis, Staphylococcus cohnii, Staphylococcus saprophyticus, and Rhodobacter sphaeroides SC01 also have smooth surfaces in the absence of Cr6+. Additionally, intact and regular cells of Bacillus licheniformis were observed in the absence of metal. This case is similar to that found by Sevak et al. (2023) in Acinetobacter sp. biomass. Hossan et al. (2020) observed depression in Klebsiella sp. treated with 100 mg/L Cr6+. After exposure to 5 mg/L Cr6+, the biomass of Bacillus licheniformis retains its smooth structure and the metal does not damage the cells, likely indicating the effective resistance of the cell at this concentration level. The wrinkles, rough clusters, irregular shapes, and possible production of extracellular substances in the biomass treated at higher concentrations (50 mg/L Cr6+) revealed that the cells develops a strategy to circumvent the toxic effect of Cr6+. Elahi et al. (2022) described wrinkles in Bacillus cereus strain b-525k after contact with 2 mM Cr6+. Similarly, Hossan et al. (2020) reported ruptured surfaces in the biomass of Klebsiella sp. after treatment with Cr6+.
The Bacillus megaterium cells were not individually distinguishable with and without Cr6+ in the medium. Hossan et al. (2020) noted a similar case in Klebsiella sp. control. In addition, the irregular appearance observed in Bacillus megaterium in media with or without Cr6+ is a common phenomenon in microorganisms. This could be due to the secretion of extracellular substances around the cells. These extracellular substances are probably reduced in cells grown at 50 mg/L Cr6+ because of the toxic effect of the metal and could be exopolysaccharides. These research findings are in accordance with earlier studies (Ozturk et al., 2009; Jobby et al., 2019).
The Byssochlamys sp. control biomass and that treated with 5 mg/L Cr6+ present identical aspects. The concentration of 5 mg/L Cr6+ shows no impact on the cells, which remain smooth and less bound. However, at 50 mg/L Cr6+, the cells group together to provide a better Cr6+ adsorption surface. In this regard, Majumder et al. (2017) found ruptured surfaces with Cr6+ saturation on the biomass of Arthrinium malaysianum.
The Candida maltosa control cells and those treated with 5 mg/L Cr6+ appear in clusters with smooth outlines. However, at 5 mg/L Cr6+, some cells are less visible and form irregular blocks. This phenomenon is thought to be due to the production of extracellular substances to resist the toxic effect of Cr6+. At 50 mg/L Cr6+, several cells are unable to retain their initial structures probably due to damaged cellular constituents of strains, as a result of the toxic effect of Cr6+ (Mat Arisah et al., 2021).
In the literature, some authors mentioned that wrinkles appeared on the biomass of Aspergillus terricola after treatment with Cr6+ (Mohamed et al., 2021). In the absence of Cr6+ in the medium, Dwivedi (2023) found that the hyphae of Talaromyces pinophillus are thin, rough, and loose. However, with Cr6+ stress, the hyphae are aggregated and dense. Similarly, Saranya et al. (2020) observed the same rough structures on Trichoderma asperellum after contact with Cr6+ and indicated the adsorption of Cr6+ and Cr3+.
Majumder et al. (2017) showed that the cell surfaces are saturated by the toxic agent, and Mat Arisah et al. (2021) explain that the rough surfaces induced by Cr in the treatments are due to the adsorption of Cr6+.
4.2 EDX analysisEDX analysis showed the presence of peaks in all the biomasses stressed with Cr6+. However, the biomasses not treated with Cr showed no chromium peaks. The appearance of Cr peaks in the biomasses treated with 5 and 50 mg/L Cr6+ indicates the presence of Cr bound to the cell surfaces of the strains (Karthik et al., 2017). The drop in the weight percentage of Cr is thought to be due to Cr toxicity, which damages parts of the cell surfaces (Su et al., 2021). Indeed, Cr is a metal capable of causing cell lysis and therefore bacteria and fungi could biosorb it. In this respect, Majumder et al. (2017) found that chromium could bind to the dried biomass of the fungus Arthrinium malaysianum (Cr peak detection). Similarly, Karthik et al. (2017) studied the ability of Cellulosimicrobium funkei strain AR6 to adsorb Cr at concentrations ranging from 100 to 250 μg/mL. They attributed the presence of Cr peaks to Cr3+ (reduction of Cr6+) bound to cell surfaces. Kalola and Desai (2020) pointed out that Cr adsorption also occurs in Halomonas sp. DK4. Additionally, Cr-specific peaks were detected in Bacillus vietnamensis, Bacillus lentus, Alcaligenes faecalis, Staphylococcus cohnii, and Staphylococcus saprophyticus treated with 3400 mg/L Cr6+ (Selvakumar et al., 2021). Su et al. (2021) and Kalsoom A. et al. (2021) indicated that the presence of Cr peaks could be due to the complexation of Cr3+ ions with molecules located on the cell surface or the presence of reduced Cr3+ species precipitated on the outer surface of the strains. The peak observed by the scientists (Kalsoom A. et al., 2021) was in the biomass of Staphylococcus simulans treated with 1500 μg/mL Cr6+ (0.19 wt.% Cr).
The weight percentage of chromium detected in Salipaludibacillus agaradhaerens strain NRC-R stressed with 4 mM Cr6+ was 0.16 % (Abo-Alkasem et al., 2022). Moreover, Elahi et al. (2022) showed that adsorption is one of the detoxification mechanisms of Bacillus cereus b-525k.
Microcharacterization of Cellulosimicrobium sp. (SCRB10), Bacillus sp. CRB-B1, and Klebsiella sp. treated with 100, 150, and 100 mg/L Cr6+, respectively, revealed Cr adsorption with weight percentages equivalent to 0.71, 3.54, and 6.02, respectively (Bharagava and Mishra, 2018; Hossan et al., 2020; Tan et al., 2020). These findings are in contrast with the results of some scientists showing that some strains do not adsorb Cr. For instance, Jobby et al. (2019) and Sevak et al. (2023) demonstrated that Sinorhizobium sp. SAR1 and Acinetobacter junii strain b2w do not adsorb Cr after contact with metal.
4.3 FTIR analysisFTIR can be used to detect the functional groups that allow the adsorption of Cr. The chromium adsorption mechanism was carried out in a culture medium enriched with Cr6+ in order to identify the functional groups that appear only in the presence of Cr6+. This gave us a clear understanding of Cr6+ bioremediation. The presence of other metals would have obscured this understanding.
Filamentous fungi are capable of adsorbing Cr6+ and this ability has been demonstrated by several researchers (Shroff and Vaidya, 2012; Majumder et al., 2017). The absorption peaks show molecules, such as NH, CH3, CH2, C=O, C=N, OH, PO2−, P–O, and O–CO in Bacillus licheniformis control and exposed to Cr6+. This suggests that these molecules are involved in the binding of Cr6+ or Cr3+ (Ayele et al., 2021; Su et al., 2021; Elahi et al., 2022). The peaks that remain at 3067, 1275, 1156, 1110, 1069, and 531 cm−1 and that corresponding to amide II, amide III, C–O–C, PO2−, C–O, C–C, PO32-, C–CO, or those that appear at 1075 cm−1 (C–O and C–C) and 964 cm−1 (PO32-) highlight the strain resistance to metal (Su et al., 2021).
Functional groups, such as CH3, CH2, CH3+, hydroxide (OH), amide III, PO2−, C–O, C–C, and PO32- found on the cell surfaces of Bacillus megaterium biomasses grown in the absence and presence of Cr6+ are involved in the binding of Cr6+ and Cr3+ ions (Ayele et al., 2021; Su et al., 2021; Elahi et al., 2022). O–H (3438 cm−1), amide A (3274 cm−1), NH3+ (1641 cm−1), N–H and C–N (1550 cm−1), CO2- (1400 cm−1), PO2− (1245 cm−1), and C–O–C (1151 cm−1) were mainly identified on the control cells. These molecules play an important role in Cr resistance. In cells in contact with Cr6+, amide A (3299 cm−1), C=O (1748 cm−1; 1657 cm−1), CO2- (1546 cm−1), CH3 (1386 cm
Comments (0)