
Remember me
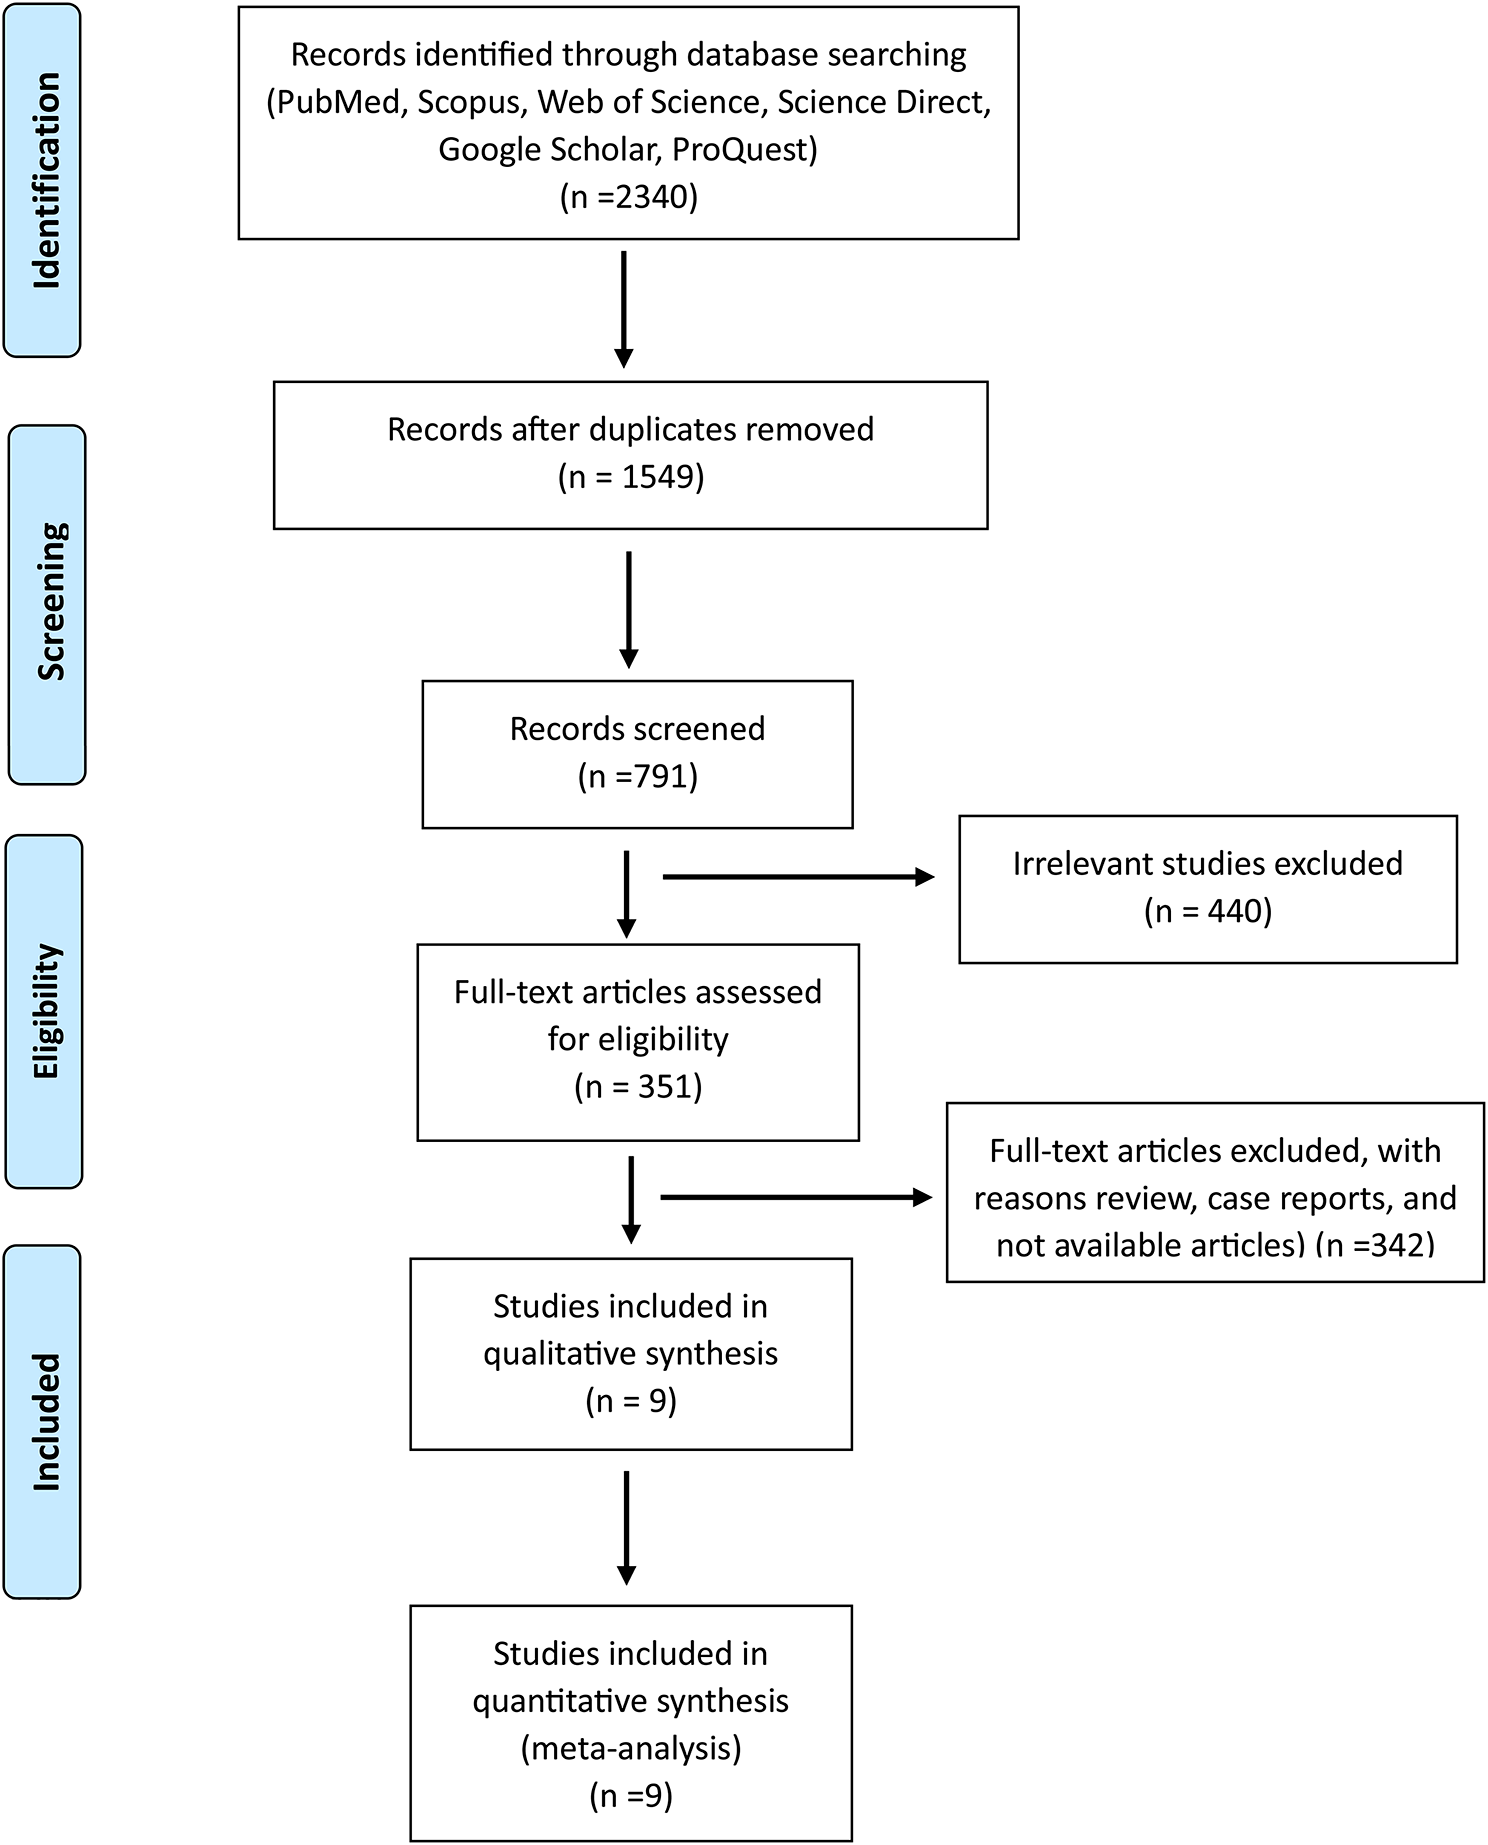


We identified 885 CC cases (overall mean age at recruitment 51.7 years, SD 13.4), 4,406 CIN cases (mean age at recruitment 38.4 years, SD 10.7), and 83 065 controls (mean age at recruitment 42.6 years, SD 14.2). We first used the prevalent CC cases (n = 691) and controls (n = 13,820) to select the best-performing PRSs for subsequent analyses, and these individuals were removed from further analyses.
Selecting the best-performing PRSsWe evaluated a total of 12 PRSs calculated with two separate methods to select the best-performing PRS for each method. According to our analyses (Additional file 2: Table S1), in LDpred, the best score was for LDpred_p3.0000e.03 (OR 1.44, 95% CI 1.33–1.56), which included 2 894 555 variants (causal fraction 0.3%). In BayesRR-RC showed the strongest association (OR 1.44, 95% CI 1.33–1.57). In further analyses, we shall refer to these two PRSs as LDpred and BayesRR-RC, respectively.
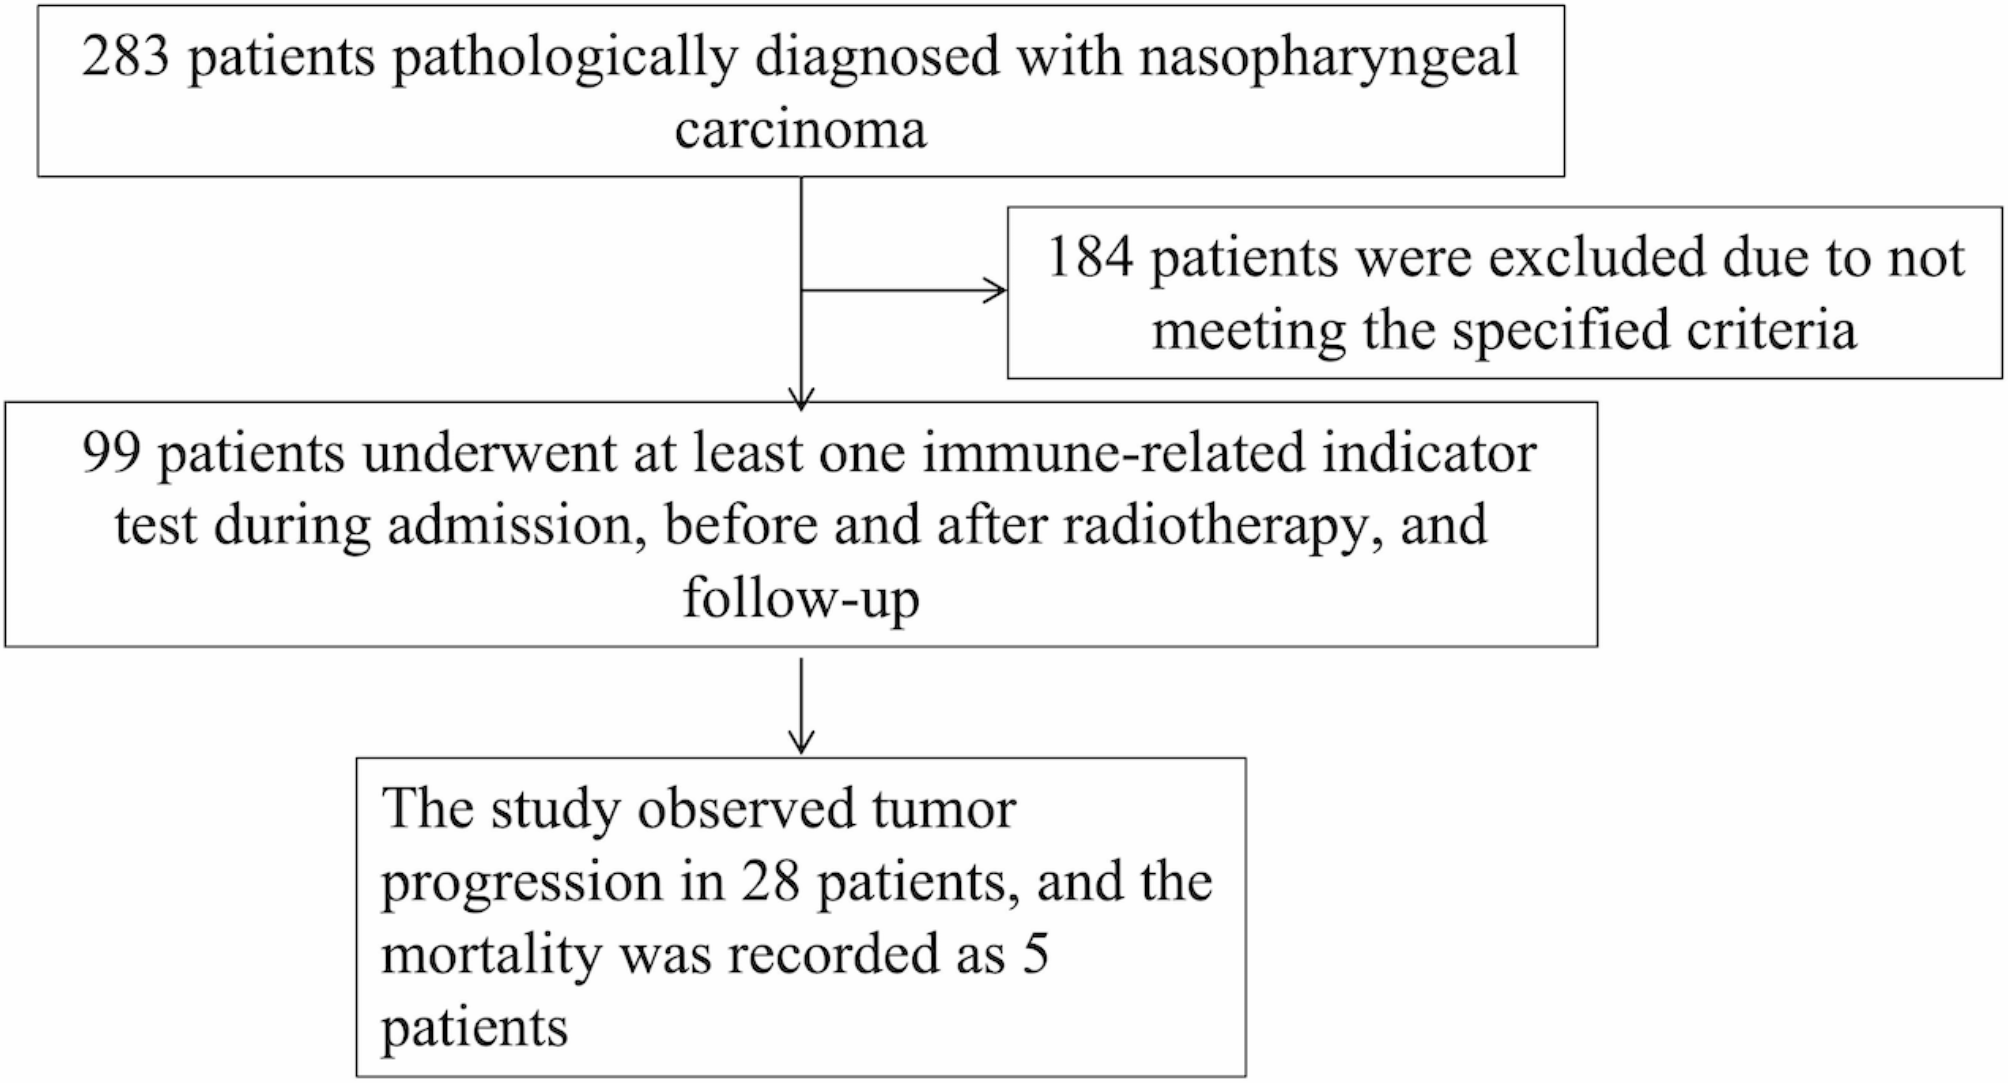
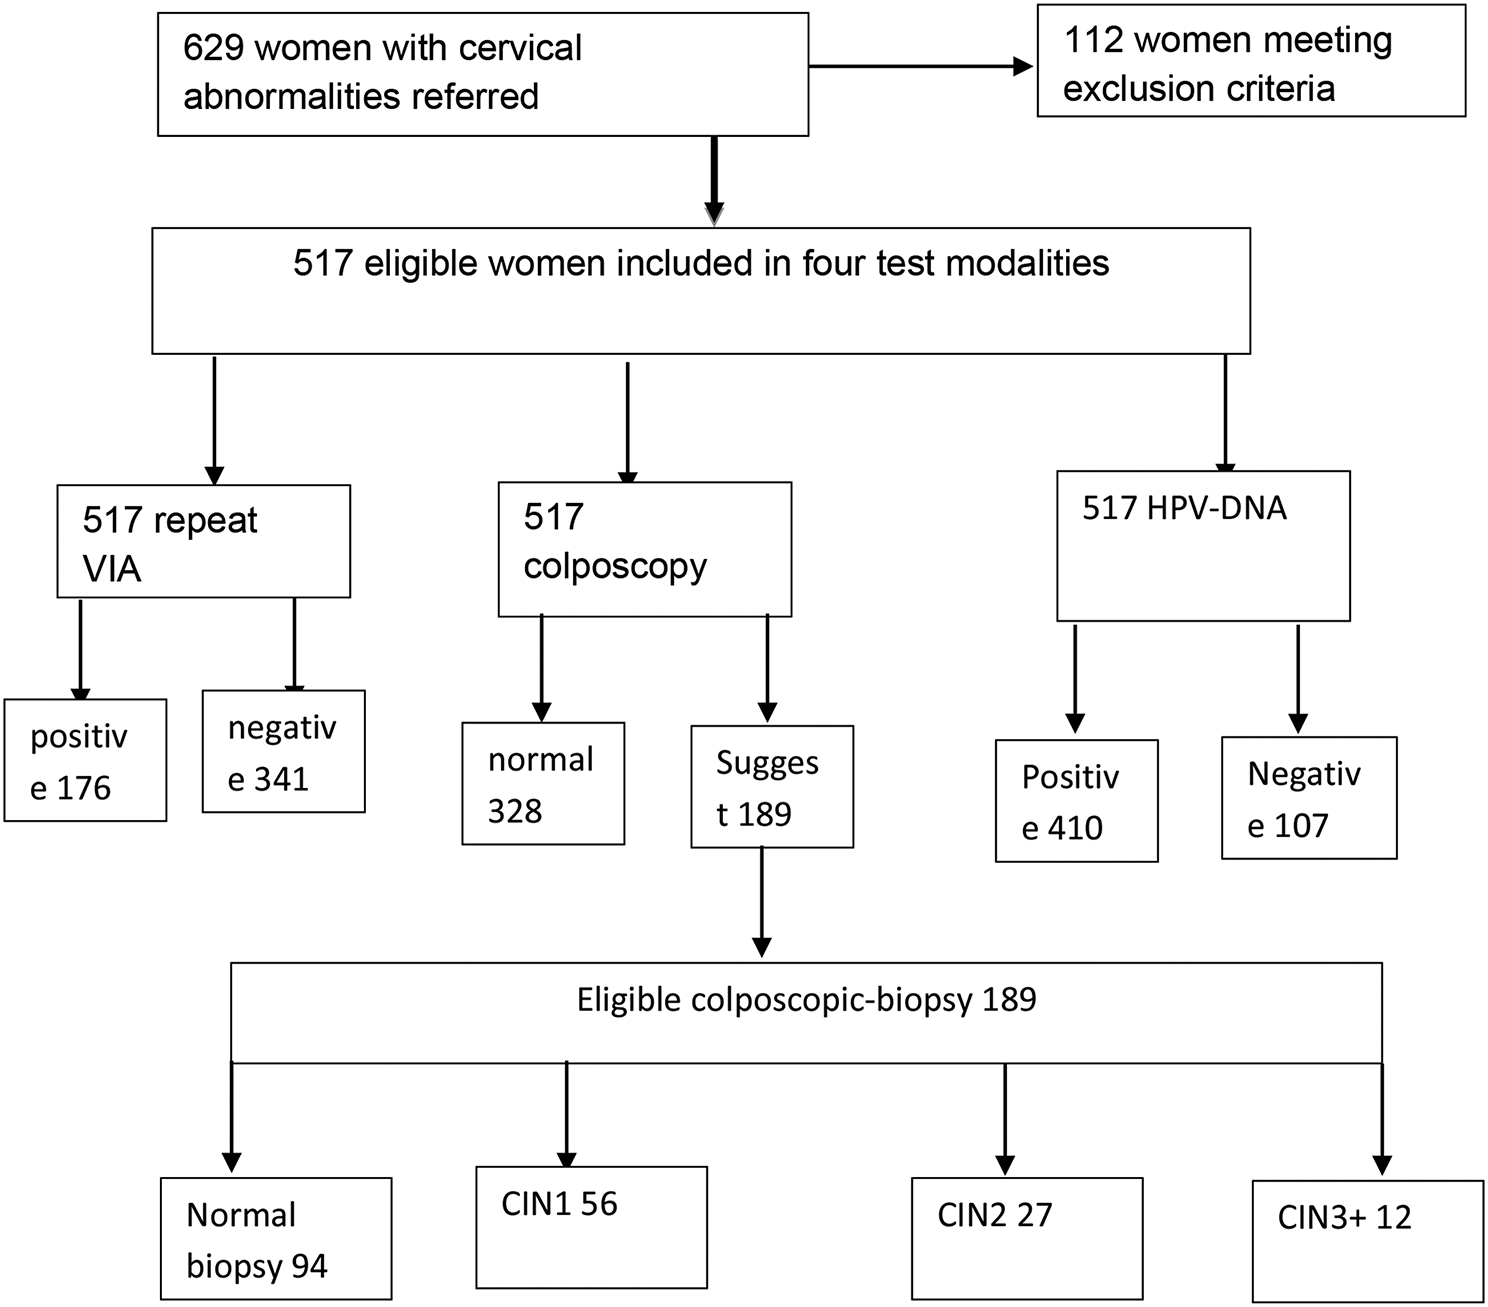
In the following analyses, the remaining cases/controls were divided as follows: incident cancer 194 cases and 69 245 controls with a mean age of 45.7 (SD 13.6) and 42.6 (SD 14.3) years, respectively; CIN 1009 cases and 35 275 controls with a mean age of 31.7 (SD 9.8) and 42.6 (SD 14.2) years, respectively; and prevalent CIN 3397 cases and 33 970 controls with a mean age of 40.0 (SD 10.0) and 42.6 (SD 14.2) years, respectively. Data on 1,347 women for association analysis with HPV infection were used (Fig. 1).
Fig. 1
Flowchart of the study design and analysed groups
PRS association with CINWe found that both risk scores were significantly associated with prevalent CIN status in the case‒control subset of the EstBB cohort.
As found in the previous step, LDpred and BayesRR-RC performed relatively equally in association with prevalent CC status. The same applied with respect to prevalent CIN with an OR = 1.32 per SD, 95% CI 1.27–1.38, p = 1.1 × 10–44 with LDpred and 1.32 (95% CI 1.27–1.37), p = 1.3 × 10–42 with BayesRR-RC.
PRS association with incident CC/CINNext, we evaluated the performance of the PRSs for incident CC or CIN in EstBB. Both PRSs were associated with both conditions (p < 0.05). For CC, the risk increased 1.32-fold per 1-SD increase in the LDpred PRS (Harrell’s C-statistic of 0.581, SE 0.020). BayesRR-RC showed a slightly lower HR of 1.25 (Harrell’s C-statistic of 0.566, SE 0.022). On the other hand, BayesRR-RC had a slightly higher HR for CIN of 1.37 (Harrell’s C-statistic 0.59, SE 0.009) compared to LDpred with an HR of 1.34 (Harrell’s C-statistic 0.582, SE 0.009).
Women in the highest 20% of genetic risk were estimated to have a 2.32 (BayesRR-RC) to 2.50 (LDpred) times greater risk of developing CC than women in the lowest 20% (Table 1). The effect was less pronounced when comparing the top 20% of women with the women below the median, resulting in a 1.58 (BayesRR-RC) to 1.66 (LDpred) times greater risk for the top 20% of women. A similar effect was observed when comparing the top 20% of women with the rest, giving hazard ratios from 1.49 (LDpred) to 1.60 (BayesRR-RC) (Table 1). Similar to CC, a clear risk gradient was observed within the risk categories for CIN. Women in the top 20% of genetic risk had an HR of 2.42 (BayesRR-RC) to 2.38 (LDpred) for incident CIN compared to women in the bottom 20%, HR of 1.91 (LDpred) to 1.98 (BayesRR-RC) compared to women below the median and HR of 1.62 (LDpred) to 1.68 (BayesRR-RC) compared to the rest of the cohort (Table 1).
Table 1 Hazard ratios of incident cervical cancer and cervical intraepithelial neoplasia for the two evaluated genetic risk scoresAs seen in Fig. 2, the cumulative incidence of CC by age 70 was estimated to be 5.3% (95% CI 3.7–6.8) for women in the top 20% of genetic risk (as defined using LDpred), 3.7% (95% CI 2.9–4.3) for those between the 20-80th percentiles and 1.8% (95% CI 0.9–1.8) for those in the lowest 20%. The cumulative incidence in risk categories defined using BayesRR-RC was similar (5.3%, 3.5%, and 2.4%, respectively) (Fig. 2b).
Fig. 2
Cumulative incidence of cervical cancer (accounting for competing risks) in a LDpred and b BayesRR-RC risk categories among women aged 30–75 years
As seen in Fig. 3a, the cumulative incidence of CIN by age 50 was estimated to be 37.1% (95% CI 33.3–40.7) for women in the top 20% of genetic risk, while it was 17.2% (95% CI 14.0–20.3) among women in the bottom 20% with LDpred. The results of BayesRR-RC (Fig. 3b) were similar, with a cumulative incidence of 37.4% (95% CI 33.6–40.9) for the top 20%.
Fig. 3
Cumulative incidence of cervical intraepithelial neoplasia (accounting for competing risks) in a LDpred and b BayesRR-RC risk categories among women aged 20–75 years
Correlation of PRSsThe Pearson correlation between LDpred and BayesRR-RC was 0.76. We then divided all women into two categories (high: PRS in the top 5%, not high: everyone else) based on the two PRSs. Eight percent of women belonged to the high category with at least one PRS, while 1.9% were in the top 5% with both compared PRSs (Fig. 4). Even though the scores were strongly correlated, we observed that the individual classification into the top 5% risk score category depended on a selected score and often did not overlap for a single individual. We also combined LDpred and BayesRR-RC into a further score called metaPRS (see Methods). When analysing the metaPRS in association with incident CC and CIN using the Cox proportional hazards model, the results mirrored those from the analysis of individual scores (HR 1.31 (SE 0.07), C-statistic 0.578 (SE 0.021); thus, additional results are not shown.
Fig. 4
The overlap among highest-risk women (top 5%) in the Estonian Biobank according to two genetic risk scores for cervical cancer. The graph shows women who were classified as being in the top 5% with at least one of the genetic risk scores (LDpred and BayesRR-RC)
Associations of risk scores with predictors of high-risk HPV infectionBoth PRSs were significantly associated with high-risk HPV (hrHPV) infection, giving an adjusted OR of 1.25 (95%CI 1.08–1.44) and 1.26 (95% CI 1.09–1.47) for BayesRR-RC and LDpred respectively (Additional file 2: Table S2). We further quantified the effect of nongenetic HPV risk factors while adjusting for the PRS value, hence enabling hrHPV risk estimation conditional on genetic factors. Several nongenetic risk factors were associated with hrHPV infection (BayesRR-RC and LDpred, respectively): being single OR 1.77 (95%CI 1.29- 2.43) and 1.81 (95%CI 1.32–2.5), having secondary education rather than tertiary education OR 1.37 (95% CI 1.00–1.86) and OR 1.38 (95% CI 1.01–1.88), long term hormonal contraceptive use OR 1.63 (95%CI 1.06–2.49) and OR 1.63 (95%CI 1.01- 2.63) and number of lifetime sexual partners OR 1.04 (95%CI 1.02–1.06). The AUC for the logistic regression model that included 8 predictor variables for HPV infection was 0.682. The AUC with 8 variables and cervical cancer PRS to predict HPV status in a logistic regression model was 0.700 and 0.694 with LDpred and BayesRR-RC risk scores, respectively.
Comments (0)