
Remember me


Place conditioning results suggested an increase in reward-like responses in female adult rats to higher doses of nicotine vapour, while this dose did not produce CPP in adolescent females, as well as adult and adolescent males.
Bonferroni corrected t-tests confirmed significant CPP for adult females at 480 (t(7) = 3.424, p = 0.0352) and 600 (t(7) = 6.831, p = 0.0012) s (Fig. 1a). There was no significant preference at any dose in adolescent females.
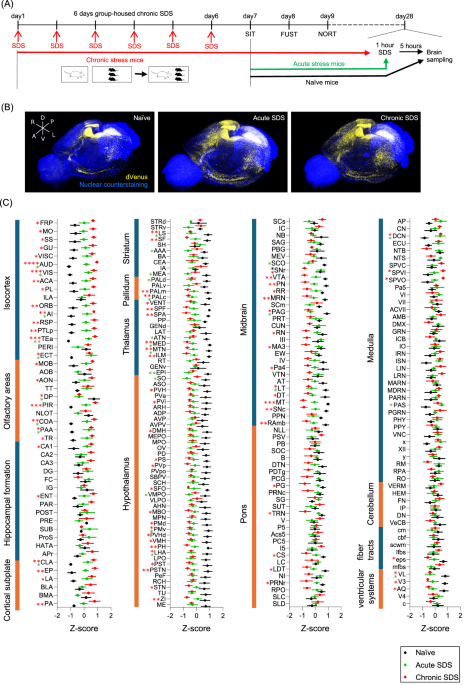
Fig. 1: Sex and age impact the effects of nicotine vapour on reward, withdrawal, locomotion and body weight.
a Female nicotine vapour place conditioning results. Difference score is defined as the difference in time spent in the initially non-preferred chamber pre- to post-conditioning. Adult females acquire CPP at 480 and 600 s doses. Adolescent females do not acquire CPP at any dose tested. b Nicotine vapour place conditioning results for male and female, adult, and adolescent rats at 600 s dose. *p < 0.05 significant shift in preference from zero. c Nicotine (filled circles) and vehicle (empty circles) vapour withdrawal scores. Scores are the sum of all observed somatic withdrawal signs averaged across two blinded scorers. Male adults and adolescents show similar levels of nicotine vapour withdrawal signs compared to control. Females do not show significant levels of nicotine vapour withdrawal though adolescents appear to trend toward significance. *p < 0.05 nicotine vapour versus vehicle vapour. d Nicotine (filled circles) and vehicle (empty circles) vapour effect on locomotion. Locomotion was measured following the second exposure of the day. Adult and adolescent males show significantly higher locomotion following nicotine vapour exposure. Adult and adolescent females do not show any increase in locomotion in response to nicotine vapour exposure. *p < 0.05 nicotine vapour versus vehicle vapour. e Weight change over nicotine vapour treatment period. Adolescent males and adult females have reduced weight gain in response to repeated nicotine vapour exposure. *p < 0.05 significant treatment by day interaction. Data are presented as mean ± SEM.
Two-way ANOVA confirmed a significant effect of sex (F(1,23) = 17.20, p = 0.0004) but not age (F(1,23) = 2.117, p = 0.1592), and a significant interaction (F(1,23) = 9.441, p = 0.0054). Post hoc further confirmed significantly greater CPP in adult females compared to adolescent females (p = 0.0273), adult males (p = 0.0002), and adolescent males (p = 0.003; Fig. 1b).
WithdrawalSignificant nicotine withdrawal was seen in adult and adolescent males, but not females of either age.
Three-way ANOVA confirmed significant main effects of treatment (F(1,51) = 15.99, p = 0.0002) and sex (F(1,51) = 15.91, p = 0.0002). Post hoc further confirmed more withdrawal signs in nicotine-exposed adult males and adolescent males versus control (t(51) = 2.553, P = 0.0137 and t(51) = 3.329, p = 0.0016 respectively) and female nicotine rats (t(51) = 3.257, p = 0.0020 and t(51) = 2.637, p = 0.0111 respectively; Fig. 1c).
LocomotionBoth adult and adolescent males showed increased locomotor activity in response to nicotine vapour treatment. Females did not show increased activity but did have higher locomotion at baseline.
Four-way ANOVA confirmed a between-subjects effects of treatment (F(1,49) = 10.601, p = 0.002) and sex (F(1,49) = 4.742, p = 0.034) and within-subjects effect of day (F(4,196) = 34.979, p < 0.0001) with day by treatment (F(4,196) = 5.810, p = 0.000194), day by sex (F(4,196) = 7.189, p < 0.0001), and day by treatment by sex (F(4,196) = 2.903, p = 0.023) interactions (Fig. 1d).
Two-way ANOVA in adult males confirmed an effect of day (F(4,56) = 45.58, p < 0.0001), treatment (F(1,14) = 12.37, p = 0.0034), and day by treatment (F(4,56) = 7.802, p < 0.0001) interaction. Post hoc further confirmed higher locomotion in nicotine treated rats on day 1 (t(70) = 4.873, p < 0.0001), 7 (t(70) = 3.102, p = 0.0138), 11 (t(70) = 3.297, p = 0.0077), and 14 (t(70) = 3.443, p = 0.0049). Two-way ANOVA on adolescent males confirmed significant day (F(4,43) = 20.23, p < 0.0001), treatment (F(1,12) = 5.918, p = 0.0316), and day by treatment (F(4,43) = 6.879, p = 0.0002) interaction. Post hoc confirmed higher locomotion in nicotine-treated rats on day 1 (t(55) = 3.054, p = 0.0174), 11 (t(55) = 2.953, p = 0.0231), and 14 (t(55) = 3.048, p = 0.0177). Two-way ANOVA on adult females confirmed an effect of day (F(4,56) = 14.56, p < 0.0001), and adolescent females showed no significant differences at any point.
WeightAdolescent males and adult females gained less weight over the exposure period compared to controls.
Four-way ANOVA confirmed significant between-subjects effects of sex (F(1,52) = 488.839, p < 0.0001) and age (F(1,52) = 2164.035, p < 0.0001), with a sex by age interaction (F(1,52) = 136.062, p < 0.0001). There were also within-subjects effects of day (F(13,676) = 2020.853, p < 0.0001), day by treatment (F(13,676) = 3.923, p = 0.010), day by sex (F(13,676) = 248.339, p < 0.0001), day by age (F(13,676) = 329.698, p < 0.0001), and day by sex by age (F(13,676) = 3.374, p = 0.020). Two-way ANOVA on each group confirmed a treatment by day interaction in adult females (F(14,196) = 5.447, p < 0.0001) and adolescent males (F(14,168) = 2.198, p = 0.0097; Fig. 1e).
PharmacokineticsFemale adults had greater venous nicotine and cotinine levels than adolescent females at the 10-minute timepoint. Moreover, female adults also had greater arterial plasma nicotine and metabolite concentrations compared to adult males.
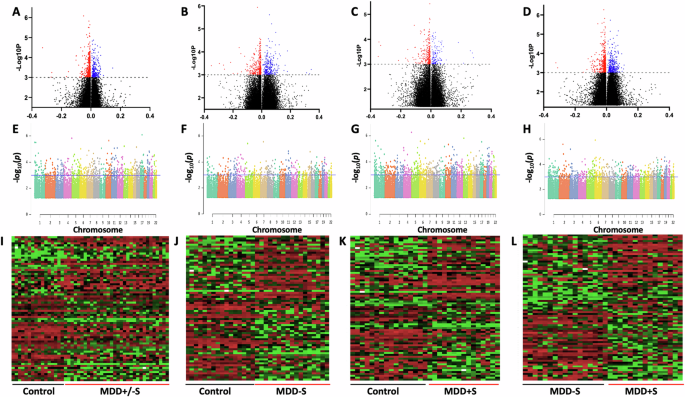
Venous blood plasmaVenous plasma nicotine levels are presented in Fig. 2a. Two-way ANOVA confirmed a significant interaction between age and sex (F(1,24) = 6.021, p = 0.0218). Post hoc analyses showed greater nicotine in adult females compared to adult males (p = 0.0424), or adolescent females (p = 0.0313).
Fig. 2: Higher venous plasma nicotine levels in female adults compared to adolescents and male rats.
a comparison of age and sex on venous nicotine plasma level. Adult females display greater nicotine levels compared to adult males or adolescent females. b comparison of age and sex on venous cotinine plasma level. Adult females display greater cotinine levels than all other groups. c Comparison of age and sex on venous nornicotine plasma level. d comparison of age and sex on venous nicotine-n’-oxide plasma level. *p < 0.05 adult versus adolescent or male versus female. N = 7 per group and timepoint. Data are presented as mean ± SEM.
Venous plasma cotinine levels are presented in Fig. 2b. Two-way ANOVA confirmed a significant effect of sex (F(1,24) = 9.125, p = 0.0059), age (F(1,24) = 13.16, p = 0.0013), and sex by age interaction (F(1,24) = 9.019, p = 0.0062). Post-hoc showed greater plasma cotinine in adult females compared to adult males (p = 0.0015), adolescent females (p = 0.0005), and adolescent males (p = 0.0005). No significant differences were seen in nornicotine (Fig. 2c) or nicotine-N’-oxide levels (Fig. 2d). All other metabolites were too low for quantification and comparison at this time point.
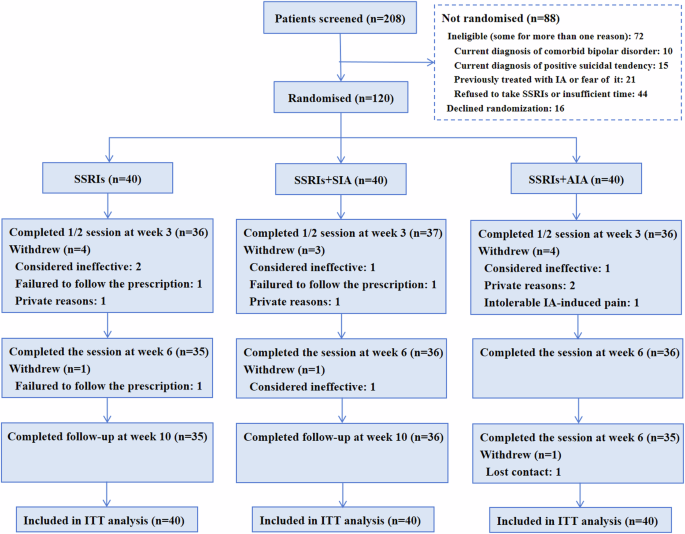
Arterial blood plasmaArterial plasma nicotine pharmacokinetic data are presented in Fig. 3a, e, i, and m. Three-way ANOVA of nicotine plasma confirmed significant effects of time (F(1,48) = 4.236, p = 0.0450) and sex (F(1,48) = 20.33, p < 0.0001). Post hoc showed greater plasma nicotine in adult females versus adult males at 30 (p = 0.0406), and 60 (p = 0.0330) minute time points.
Fig. 3: Higher arterial plasma nicotine levels in female adults compared to male adult rats.
a–d Comparison of adult to adolescent males. e–h Comparison of adult to adolescent females. i–l Comparison of adult males to adult females. Adult females display greater nicotine, cotinine, and nornicotine compared to adolescent females. m–p Comparison of adolescent males to adolescent females. *p < 0.05 adult versus adolescent or male versus female. N = 7 per group and timepoint. Data are presented as mean ± SEM.
Arterial plasma cotinine pharmacokinetic data are presented in Fig. 3b, f, j, and n. Three-way ANOVA showed effects of time (F(1,48) = 30.50, p < 0.0001) and sex (F(1,48) = 32.66, p < 0.0001), as well as time by sex (F(1,48) = 6.964, p < 0.0112), and sex by age (F(1,48) = 4.164, p = 0.0468) interactions. Post hoc showed greater plasma cotinine levels in female adults versus male adults at 30 (p = 0.0048) and 60 (p = 0.0016) minutes.
Arterial plasma nornicotine pharmacokinetic data are presented in Fig. 3c, g, k, and o. Three-way ANOVA confirmed an effect of time (F(1,48) = 16.55, p = 0.0002), sex (F(1,48) = 18.26, p < 0.0001), and sex by age (F(1,48) = 8.157, p = 0.0063) interaction. Post hoc showed greater plasma nornicotine concentrations in adult females versus adult males at 30 (p = 0.0107) and 60 (p = 0.0040) min.
Arterial plasma 3-hydroxycotinine pharmacokinetic data can be seen in Fig. 3d, h, l, and p. No significant differences were found between groups.
Arterial plasma nicotine-N′-oxide pharmacokinetic data can be seen in Supplementary Fig. 1a, c, e, and g. Three-way ANOVA confirmed an effect of time (F(1,48) = 63.81, p < 0.0001), sex (F(1,48) = 45.11, p < 0.0001), and age (F(1,48) = 15.50, p = 0.0003), as well as time by sex (F(1,48) = 36.67, p < 0.0001), time by age (F(1,48) = 29.01, p < 0.0001), sex by age (F(1,48) = 55.38, p < 0.0001), and time by sex by age (F(1,48) = 35.72, p < 0.0001) interactions. Post hoc showed greater plasma levels in adult females versus adult males (p < 0.0001), and adolescent females (p < 0.0001).
Arterial plasma norcotinine levels can be seen in Supplementary Fig. 1b, d, f, and h. Three-way ANOVA confirmed an effect of time (F(1,47) = 43.45, p < 0.0001) and sex (F(1,47) = 32.59, p < 0.0001), as well as time by sex (F(1,47) = 6.457, p < 0.0144), and sex by age (F(1,47) = 6.457, p < 0.0144) interactions. Post hoc showed greater plasma levels in adult females versus adult males (p < 0.0001), and adolescent females (p < 0.0001) at 60 min.
BrainOverall, adult and adolescent females had higher brain nicotine and metabolite levels than adult and adolescent males, respectively.
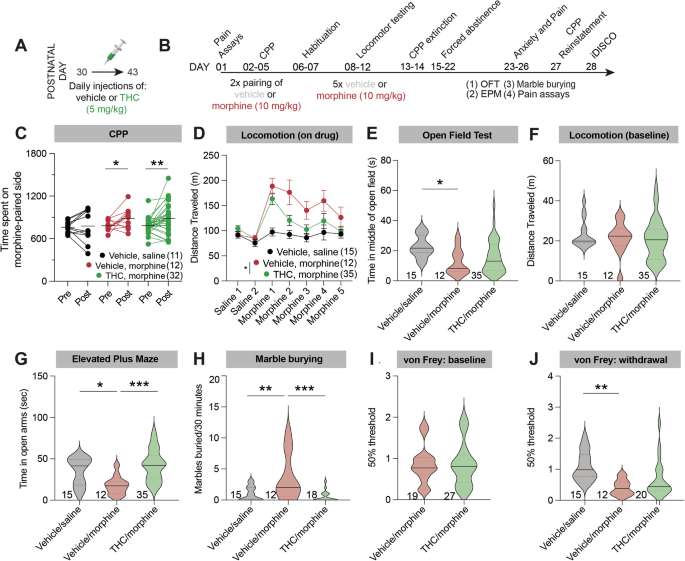
Nicotine brain pharmacokinetics are presented in Fig. 4a, d, g, and j. Three-way ANOVA confirmed effects of time (F(1,48) = 13.44, p = 0.0006) and sex (F(1,48) = 58.65, p < 0.0001). Post hoc showed higher nicotine in adult females versus adult males at 30 (p = 0.0018), and 60 (p = 0.0036) min as well as greater concentrations in adolescent females versus adolescent males at 30 (p = 0.0033) and 60 (p = 0.0137) min.
Fig. 4: Higher brain nicotine levels in female adult and adolescent rats compared to male rats.
a–c Comparison of adult males to adolescent males. d–f Comparison of adult females to adolescent females. g–i Comparison of adult males to adult females. Adult females display greater nicotine, cotinine, and nornicotine concentrations compared to adult males. j–l Comparison of adolescent males to adolescent females. Adolescent females display higher nicotine and cotinine concentrations compared to adolescent males. *p < 0.05 adult versus adolescent or male versus female. N = 7 per group and timepoint. Data are presented as mean ± SEM.
Cotinine brain pharmacokinetics are presented in Fig. 4b, e, h, and k. Three-way ANOVA showed main effects of time (F(1,48) = 8.463, p = 0.0055) and sex (F(1,48) = 37.51, p < 0.0001), and a time by sex interaction (F(1,48) = 7.425, p = 0.0089). Post hoc analysis showed greater concentrations in adult females compared to adult males at 30 (p = 0.0291) and 60 (p = 0.0026) min and greater concentrations in adolescent females versus adolescent males at 60 (p = 0.0112) min.
Nornicotine brain pharmacokinetics are presented in Fig. 4c, f, i, and l. Three-way ANOVA confirmed an effect of sex (F(1,48) = 34.42, p < 0.0001) as well as time by sex (F(1,48) = 4.056, P = 0.0496) and sex by age (F(1,48) = 4.443, p = 0.0403) interactions. Post hoc showed greater brain nornicotine concentrations in adult females versus adult males at 30 (p = 0.0320) and 60 (p = 0.0003) min.
Brain levels of 3-hydroxycotinine, nicotine-N’-oxide, and nornicotine were below the limit of quantification at the selected time points.
Magnetic resonance imagingIn all groups, NBS confirmed reduced functional connectivity in the nicotine group versus their respective vehicle controls. This effect was more pronounced in female compared to male rats.
Data was successfully collected from 78 rats. Figure 5a (left) shows a representative single-subject T2 anatomical image and the first volume of an fMRI dataset (right).
Fig. 5: Reduced functional connectivity was observed in nicotine vapour-exposed rats, with greater reductions observed in female rats.
a Representative single subject T2 anatomical image (left), diffusion b = 0 image (middle), and the first volume of an fMRI dataset (right). b NBS statistics confirmed reduced functional connectivity in the Nicotine group (n = 34) compared to the Vehicle group (n = 36) when controlling for age and sex (p = 0.013, 12 edges, 13 nodes). Significant edges have anatomical regions labelled. All other regions are labelled with their numerical SIGMA atlas reference. c Average Pearson Correlation Coefficients in edges identified by NBS statistics to have reduced functional connectivity in the Nicotine group when controlling for age and sex (p = 0.013, 12 edges, 13 nodes). Post-hoc analysis confirmed a statistically significant group by sex interaction effect (p < 0.001, 5 edges, 6 nodes). No statistically significant group-by-age interaction effect was confirmed. Abbreviations: L Left, R Right, Hyp Hypothalamus, ParCx Parietal Cortex, PirCx Piriform Cortex, EnPir Endo/piriform Cortex, VisCx Primary and Secondary Visual Cortex, CA1 Cornu Ammonis 1, SomCx Primary Somatosensory Cortex, Ins Insular Cortex, Cing Cingulate Cortex, DDG Dorsal Dentate Gyrus, RetCx Retrosplenial Cortex, Col Colliculus.
Eight data sets were identified that contained motion-related and slice timing artifacts which could not be adequately corrected with preprocessing and were subsequently removed, leaving n = 70 datasets available for analysis (Table 1). Commonly studied resting networks were conserved in the functional datasets (Supplementary Fig. 2).
In the Nicotine group, NBS statistics found a single network with reduced functional connectivity when controlling for age and sex (p = 0.013, 12 edges, 13 nodes, Fig. 5b). Supplementary Table 1 includes a list of all connections identified in the network. Figure 5c shows the average Pearson Correlation Coefficients identified in each significant connection within each group.
Post-hoc analysis identified a group by sex interaction (p < 0.001, 5 edges, 6 nodes). Supplementary Table 2 contains a list of all connections identified in this network.
Like the NBS analysis, between-component group analysis confirmed an overall reduction in connectivity due to nicotine vapour exposure, with reductions in connectivity between the hippocampus and somatosensory cortex (p = 0.02) and hippocampus and cingulate cortex (p = 0.041), as presented in Fig. 6b. Significant interactions between sex and functional connectivity were also seen between somatosensory and motor cortex (p = 0.0001), Hippocampus and somatomotor cortex (p = 0.0001), somatosensory and default mode network (p = 0.0016), Hippocampus and olfactory bulb (p = 0.0056), and Hippocampus and amygdala (p = 0.012), as shown in Fig. 6c.
Fig. 6: Nicotine-exposed animals showed decreased between component group connectivity.
a Between-Resting state network average group connectivity. The values were calculated by averaging correlation coefficient within each group between the resting state networks resulting from the ICA. The results are shown as z-scores. b Significant differences in correlation strength were observed between nicotine and vehicle-exposed rats. Non-parametric permutation test was used (10,000 permutations). comparisons are adjusted for sex. A decrease in functional connectivity in animals exposed to nicotine vapour was seen between the hippocampus and the somatosensory cortex (left) components, and between the hippocampus and cingulate cortex (right) components. c Effects of sex on resting state network connectivity strength. Nodes showing significant interaction between sex and connectivity strength (ICA component pair-wise comparisons from left to right): Somatosensory and motor cortex, Hippocampus and somatomotor cortex, Somatosensory and default mode network, Hippocampus and olfactory bulb, Hippocampus and amygdala. FWER-corrected comparisons are presented. *p < 0.05.
No statistically significant changes were seen in structural connectivity through diffusion network-based analysis (p = 0.19). Supplementary Fig. 3 shows a representative fibre orientation distribution.
A summary of all behavioural, pharmacokinetic, and network connectivity is provided in Table 2.
Table 2 Summary of nicotine vapour effects on behaviour, pharmacokinetics, and network connectivity. Data expressed as mean ± SEM.
Comments (0)