The standard graph of pure drug CC was obtained as linear in the concentration range of 2 to 10 μg/mL, as shown in Table 3 and Figure 1. The regression coefficient of the calibration curve was found to be 0.9978.
Drug concentration (μg/mL) Absorbance 249nm 2 0.092 4 0.194 6 0.297 8 0.421 10 0.542 Table 3:The optimization of C-SLN formulation was performed using response surface methodology based on the criteria for achieving the highest drug content, %EE and minimum particle size. The optimization process suggests three formulations having the dependent variable with a greater desirability value (close to 1), indicating the suitability of the SLN preparation. Table 4 contains the summary of the results of regression analysis from the optimized design for the SLN formulation. The contour plot of %EE, drug content, particle size and response surface plot of %EE, drug content and particle presented in Figure 2.
Models R2 Adjusted R2 Predicted R2 SD %CV Remarks % Entrapment Efficiency Linear 0.7110 0.6532 0.3819 2.68 2FI 0.7728 0.6971 0.4195 2.50 Quadratic 0.9242 0.8701 0.4612 1.81 1.64 Suggested Drug Content % Linear 0.7239 0.6686 0.3917 8.74 9.99 Suggested 2FI 0.7258 0.6344 -0.0530 9.18 Quadratic 0.7432 0.5598 -0.8262 10.07 Particle Size Linear 0.4715 0.3658 0.0963 104.80 2FI 0.4835 0.3113 -0.0209 109.21 Quadratic 0.9076 0.8415 0.3426 52.39 Suggested Table 4:The FTIR spectra of pure drug CC, CC combination with excipients, and C-SLNs formulations were studied to determine the compatibility of the drug and excipients. FTIR studies were performed, and the graphs are represented in Figure 3. The result indicateds that the prominent peak of CC was retained when combined with excipients and SLN formulation, indicating no interaction with excipients. Hence the selected excipients are used in the formulation development of SLN.
The physico-chemical characterizations such as %EE, drug content, and particle size of the developed candesartan cilexetil-loaded SLN were represented in Table 5. All the developed C-SLN were shown between 357 to 705 nm particle size and shows greater drug content ranging from 57 to 107%, good entrapment efficiency from 78.47 to 94.61. This may achieve by employing variable concentration of surfactant and lipid concentration along with optimum sonication. The result indicates that the increase in the surfactant concentration as well as the lipid concentration leads to a decrease in particle size and an increase in entrapment efficiency and drug content. Formulation C-SLN-8 has the highest %EE of 94.68, with drug content of 107.94 and a particle size of 705 (Figures 4 and 5). The surface morphology of the developed C-SLNs was studied DLS, and SEM analysis shows the particle size and distribution. The photomicrograph of formulation C-SLN-8 shows the spherical nature of the lipid particle (Figure 5). All the analysis was done for triplicate times (Table 5).
Formulation code % EE Drug content Particle Size C-SLN-1 89.48 57.44 676.2 C-SLN-2 84.28 77.14 403 C-SLN-3 78.47 68.94 457.7 C-SLN-4 91.18 78.04 394.3 C-SLN-5 93.40 102.04 527.9 C-SLN-6 91.64 86.64 357 C-SLN-7 94.34 105.74 636.6 C-SLN-8 94.68 107.94 705 C-SLN-9 91.64 86.64 357 C-SLN-10 91.64 86.64 357 C-SLN-11 91.64 86.64 357 C-SLN-12 91.64 86.64 357 C-SLN-13 94.61 106.34 391.9 Table 5: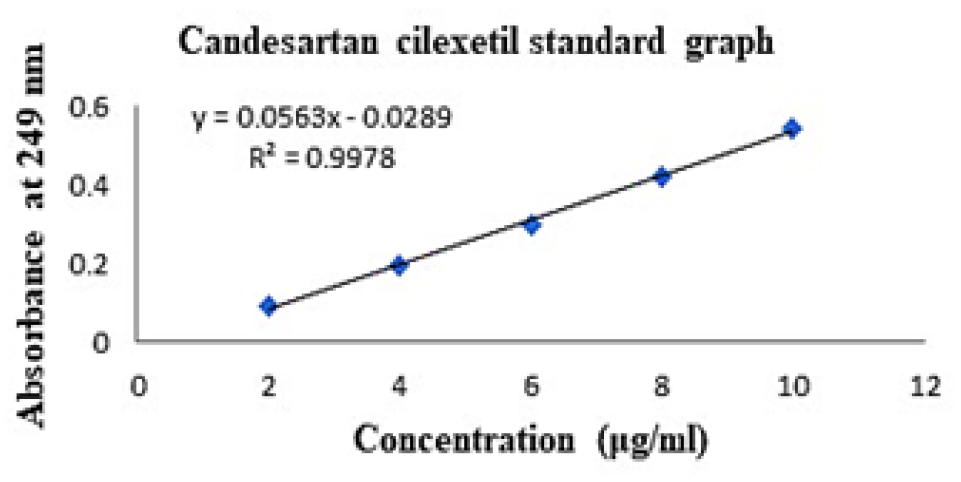
Figure 1:
Candesartan cilexetil standard curve.
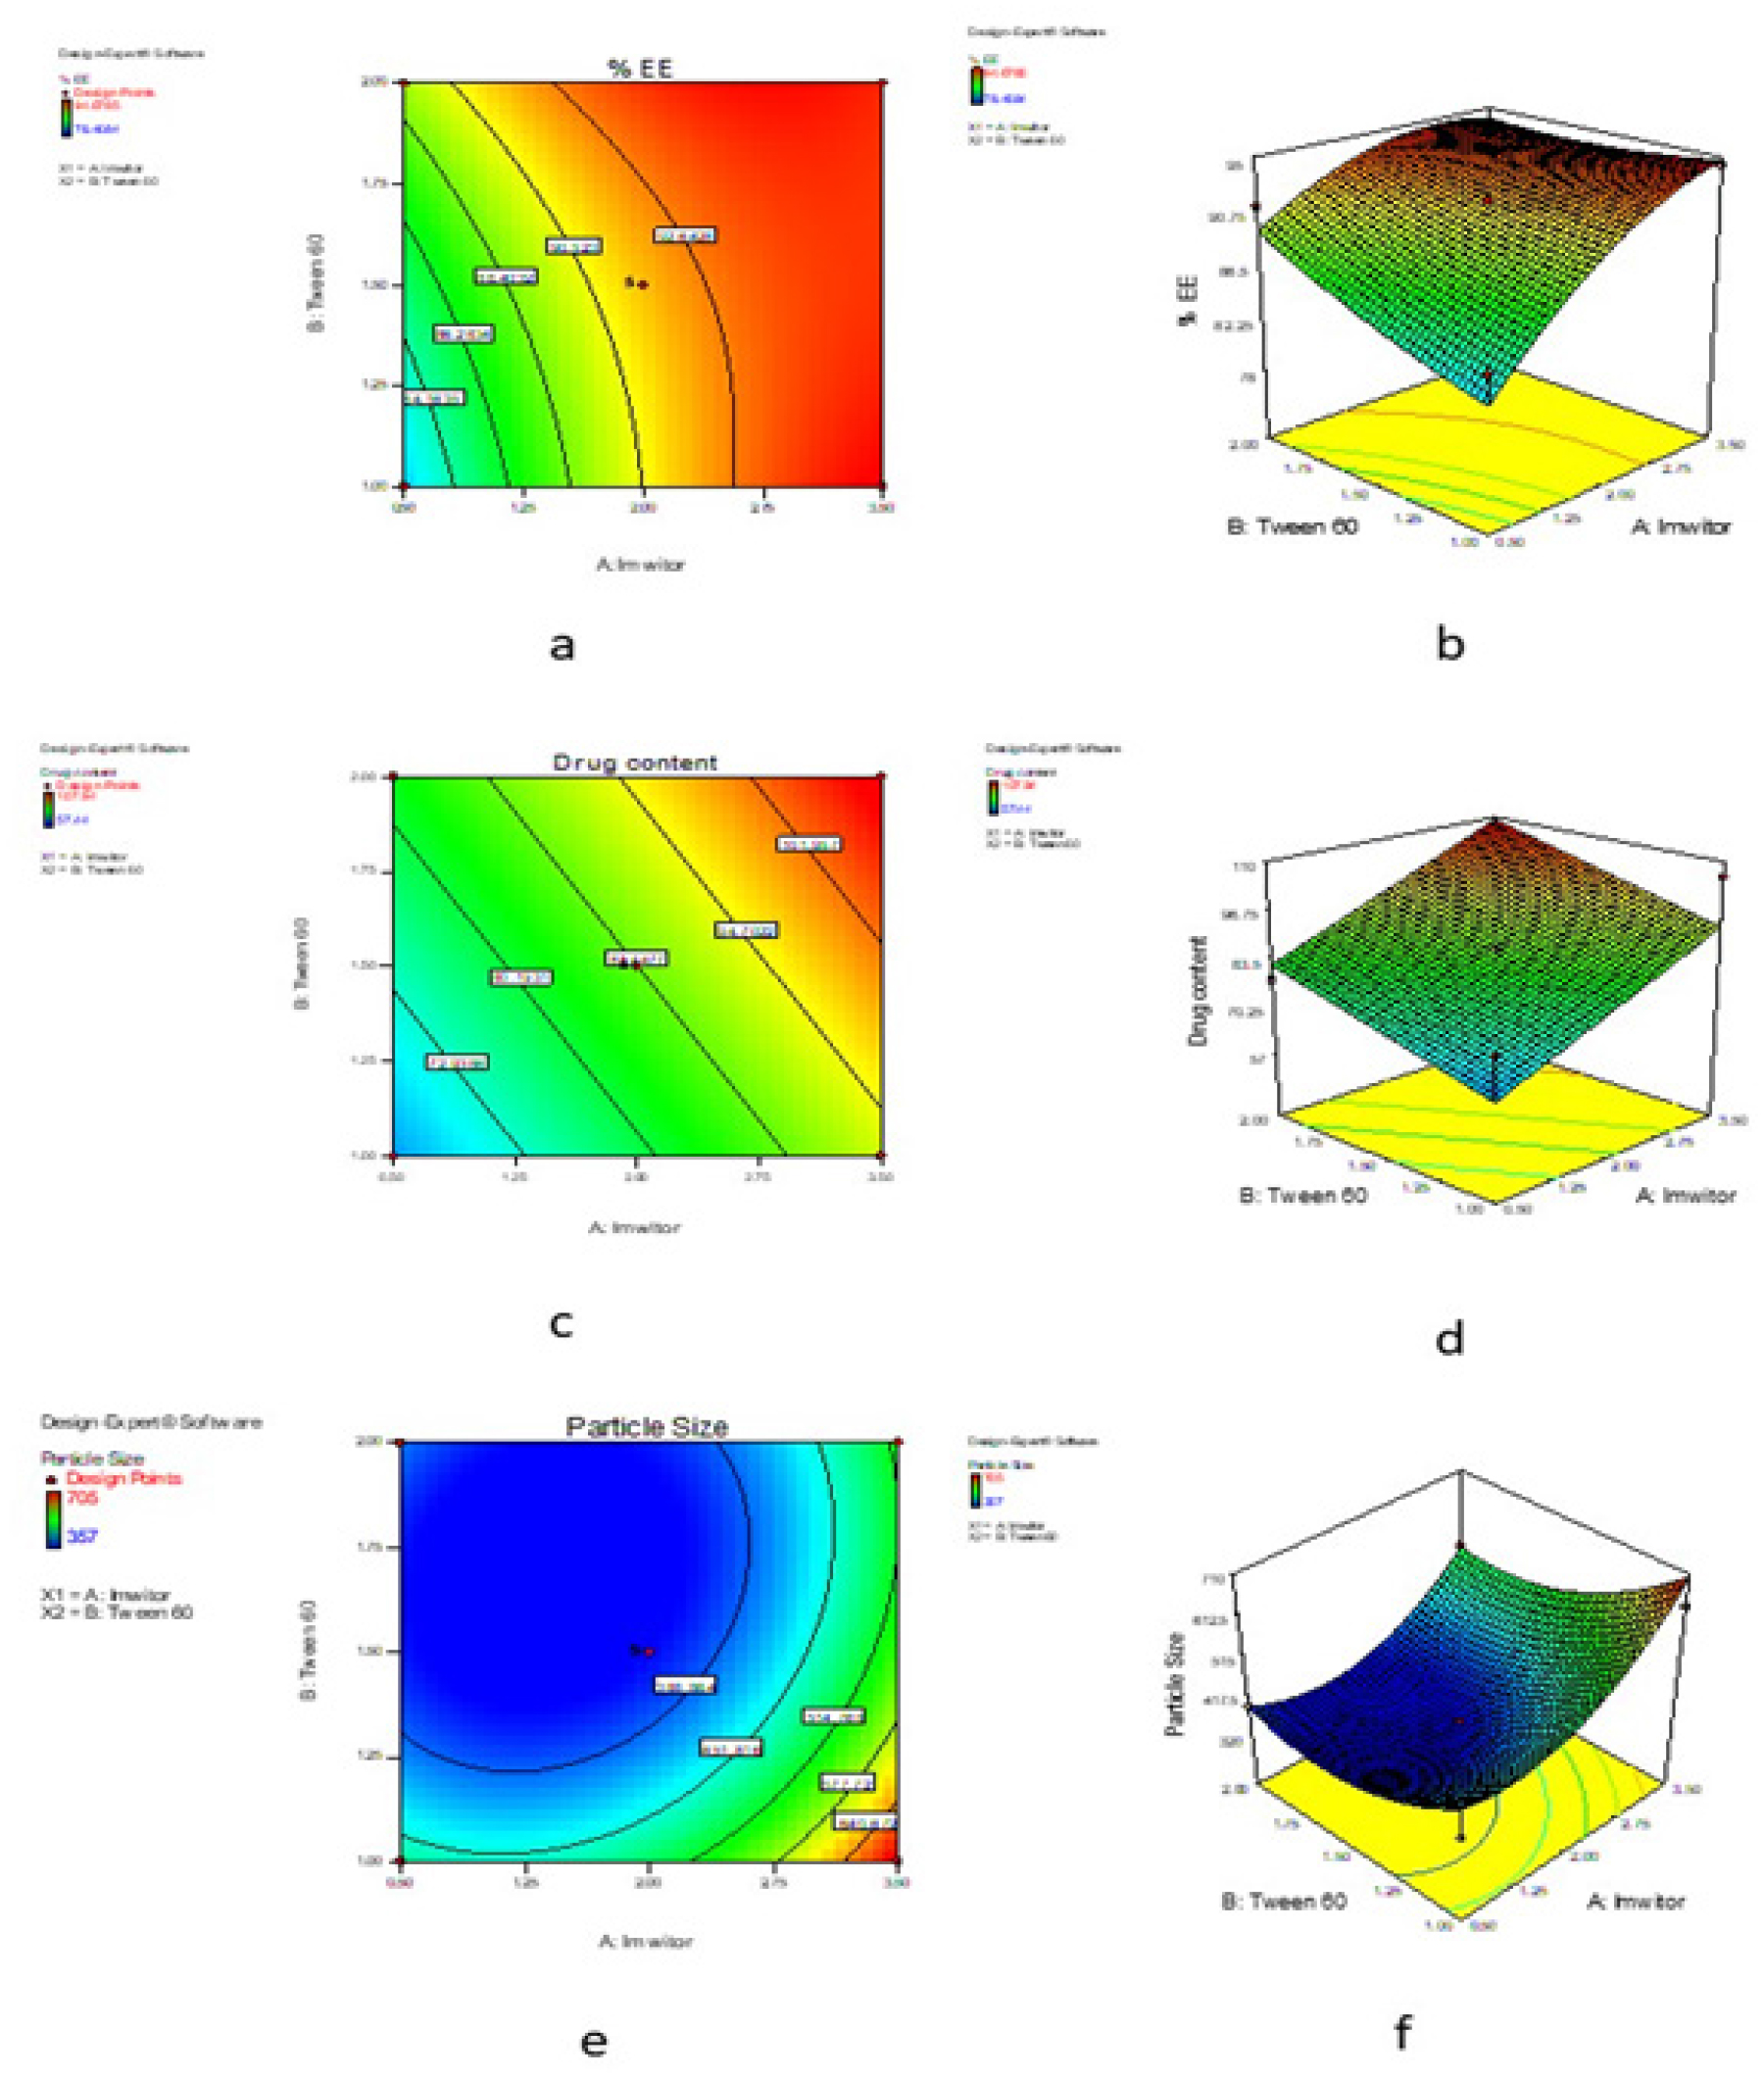
Figure 2:
Contour plot for %EE of SLN (a), Response surface plot for %EE of SLN (b), Contour plot for drug content of SLN (c), Response surface plot for drug content of SLN (d), Contour plot for particle size of SLN (e), Response surface plot for particle size of SLN (f).
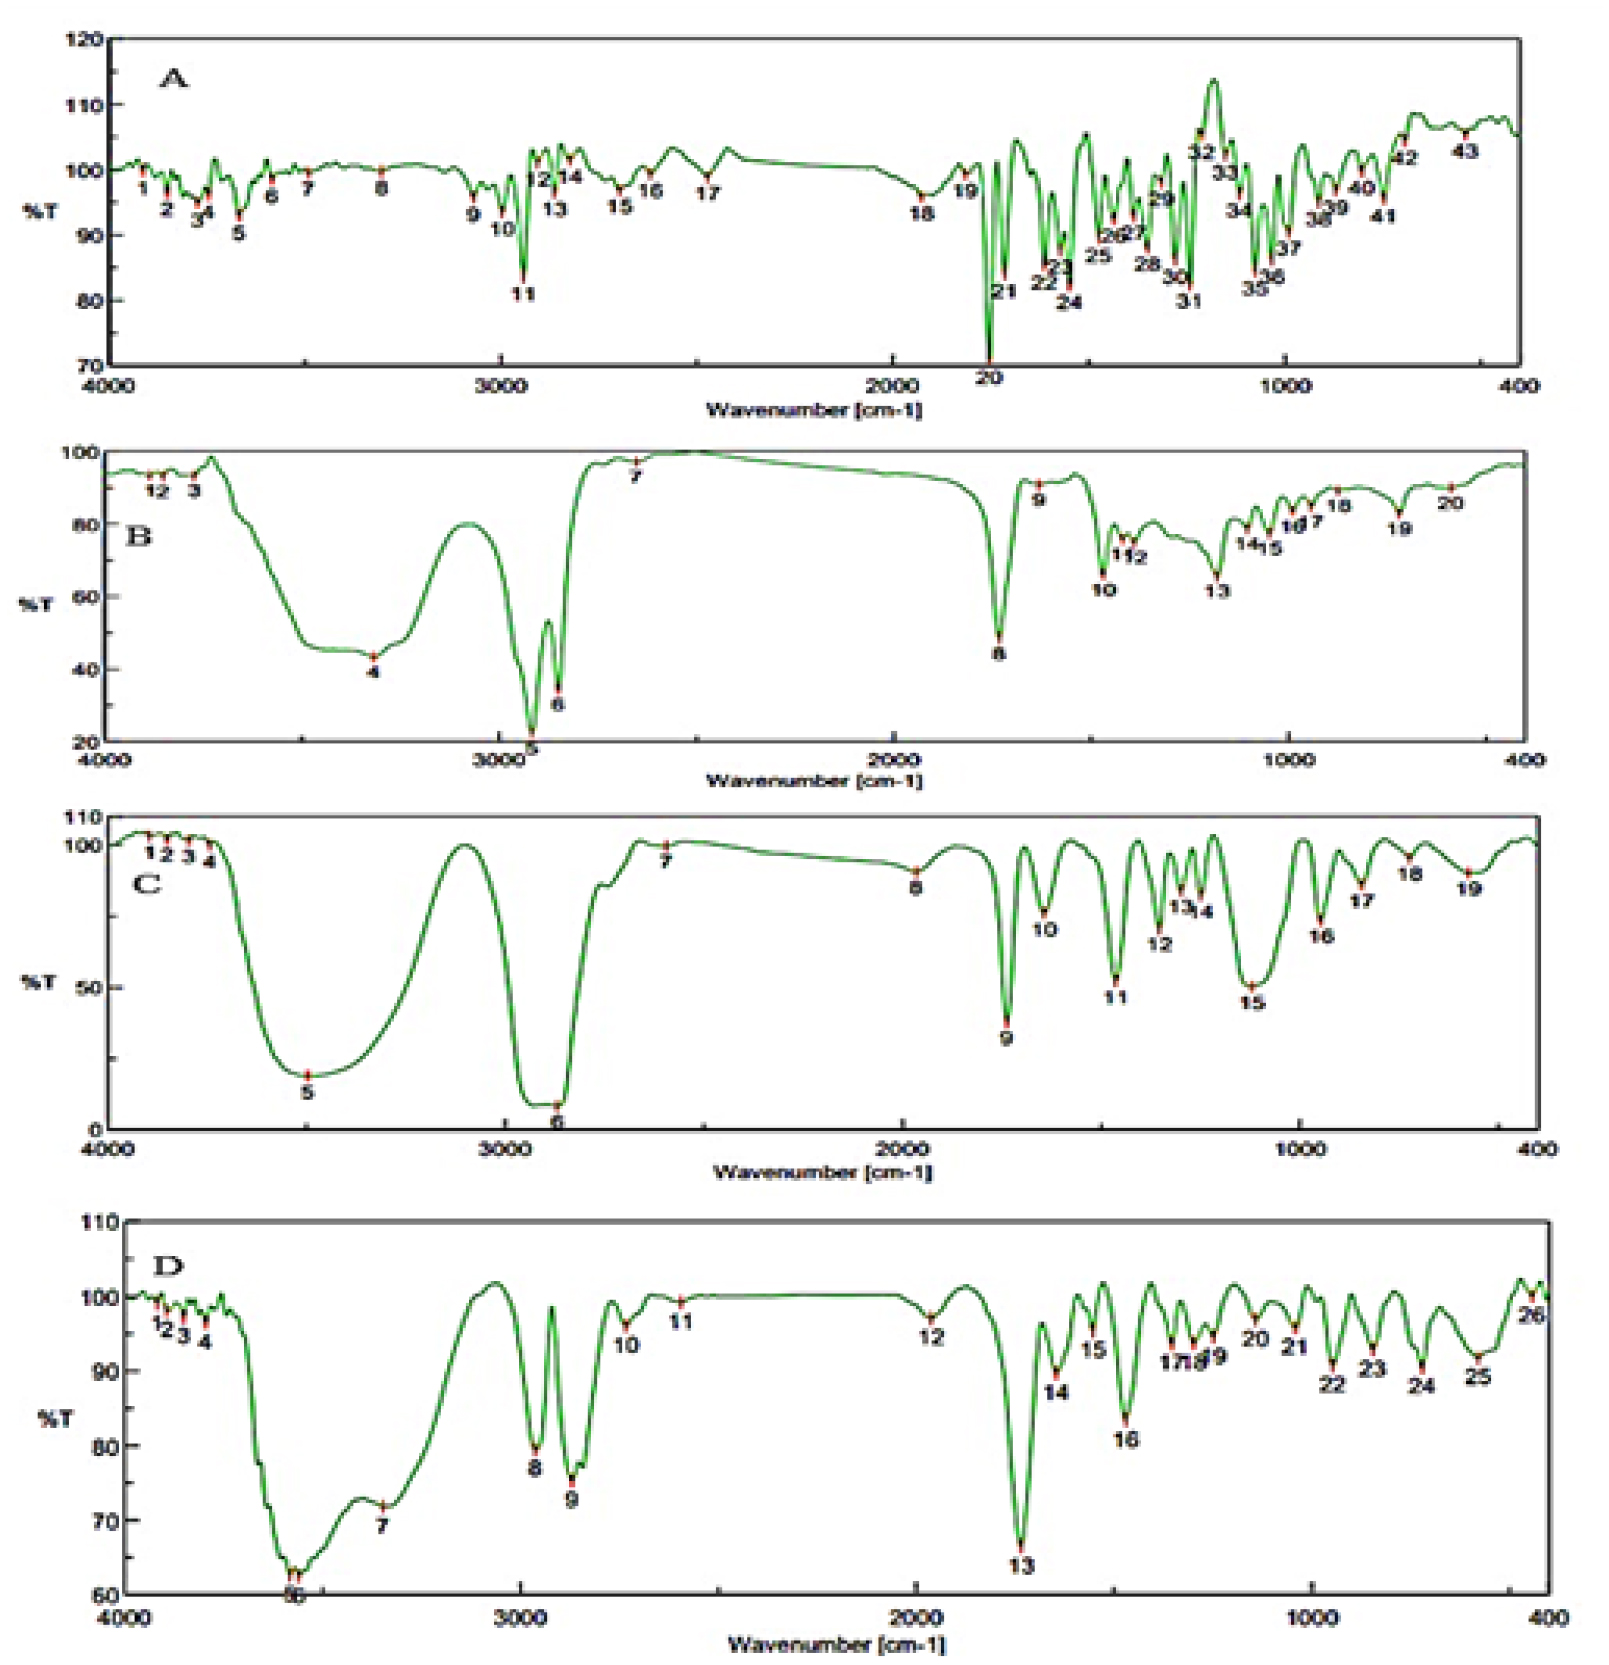
Figure 3:
FTIR images of (A) Candesartan cilexetil, (B) Imwitor, (C) Tween 60, (D) Drug-excipient mixture.
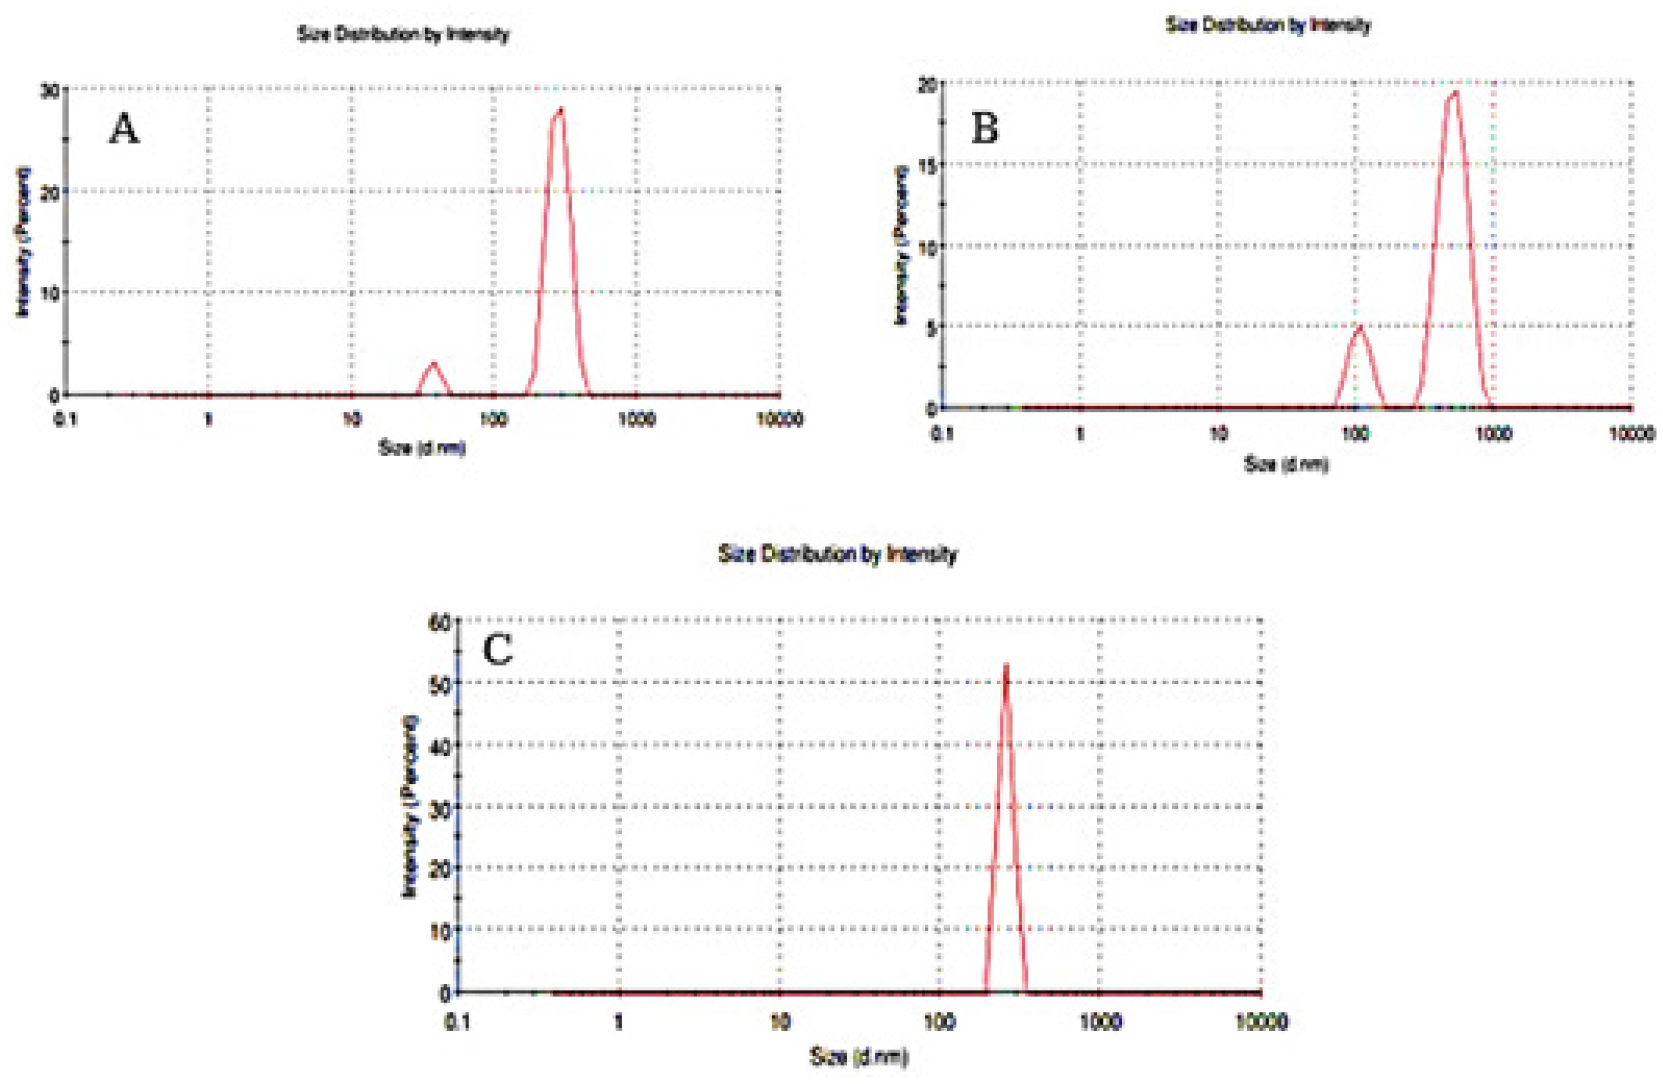
Figure 4:
(A) Particle size low (C-SLN-12), (B) Particle size medium (C-SLN-5), (C) Particle size high (C-SLN-8).
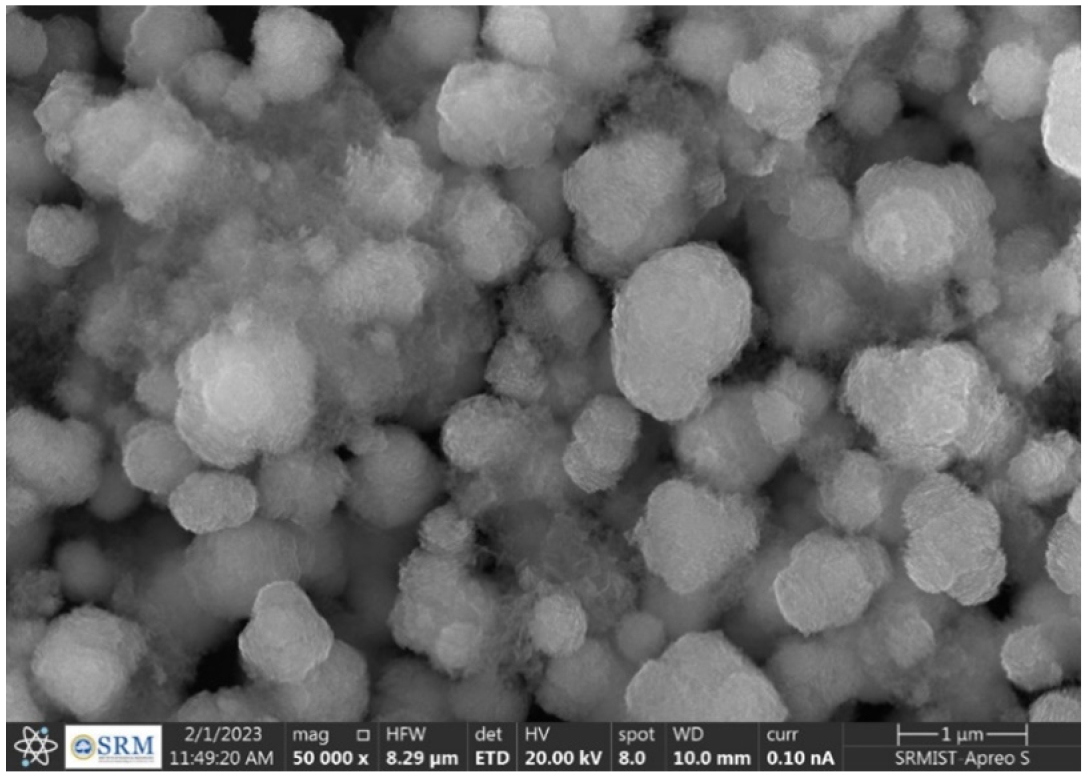
Figure 5:
SEM image of formulation C-SLN-8.
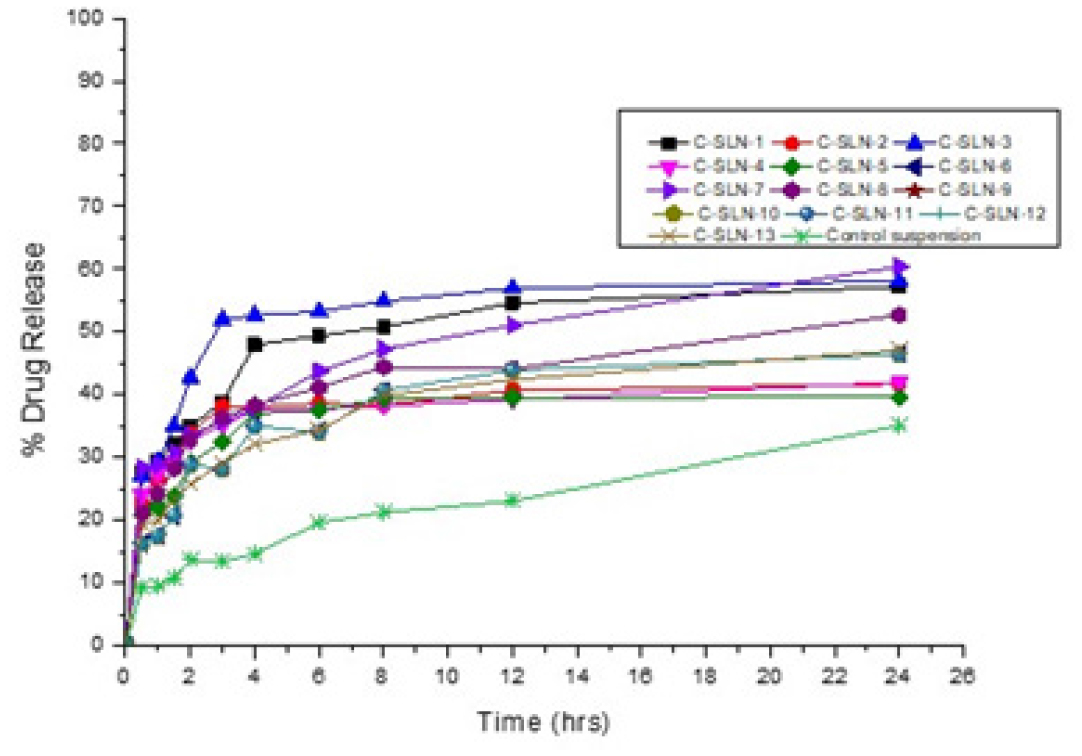
Figure 6:
Dissolution profile of candesartan cilexetil SLN.
CC in vitro release (Table 6) showed a maximum of 60.39% drug release from the C-SLN-7 and 46.4% released from C-SLN-12, and control suspension shows that 35.05% of drug release within 24 hr. The higher drug release from formulation may be attributed to a higher concentration of the Imwitor present in the SLN as well as the optimum sonication when compared to other formulations and the suspension. Moreover, this possesses a great entrapment efficiency of 94.34% when compared with other developed SLN formulations (Figure 6). Formulations C-SLN1, 3&8 shows good in vitro release profile due to the presence of a higher amount of lipid to accommodate more amount of drug. Formulations C-SLN 2, 4, 5, 6, 9-13 shows moderate release, which makes it less attractive due to the variable concentration of Imwitor and Tween 60 (Table 2).
% Drug Released Time in hrs. C-SLN-1 C-SLN-2 C-SLN-3 C-SLN-4 C-SLN-5 C-SLN-6 C-SLN-7 C-SLN-8 C-SLN-9 C-SLN-10 C-SLN-11 C-SLN-12 C-SLN-13 Control Suspension 0.5 27.55 22.81 27.07 23.91 20.72 16.25 28.38 21.13 16.25 16.25 16.25 16.25 19.32 9.29 1 29.55 26.71 29.45 27.38 22.10 17.46 28.79 24.23 17.46 17.46 17.46 17.46 19.95 9.52 1.5 32.19 29.37 34.98 29.15 23.85 20.70 30.83 28.26 20.70 20.70 20.70 20.70 23.59 10.80 2 34.90 33.94 42.76 32.75 29.11 28.85 33.58 32.84 28.85 28.85 28.85 28.85 25.68 13.66 3 38.90 38.21 51.89 35.11 32.50 28.16 35.72 36.35 28.16 28.16 28.16 28.16 29.16 13.44 4 47.97 38.01 52.63 37.51 37.03 34.98 37.89 38.33 34.98 34.98 34.98 34.98 32.09 14.60 6 49.38 38.65 53.28 37.68 37.54 34.07 43.79 41.14 34.07 34.07 34.07 34.07 34.43 19.58 8 50.76 38.32 54.90 38.24 39.39 40.65 47.22 44.43 40.65 40.65 40.65 40.65 39.84 21.22 12 54.58 40.65 56.99 39.21 39.53 43.88 51.07 44.12 43.88 43.88 43.88 43.88 42.44 23.03 24 57.25 41.66 58.07 41.97 39.59 46.40 60.39 52.71 46.40 46.40 46.40 46.40 47.09 35.05 Table 6:
Comments (0)