
Remember me


We performed a prospective, non-randomized, study in 60 patients with painful primary osteoarthritis, who were non-responsive to non-operative treatment and underwent TKA. We excluded patients who had previous fractures of the femur or tibia, or who had previous tibial or femoral osteotomy to eliminate any degree of malrotation. Patients who met the requirements and agreed to participate were consecutively recruited from 2015 to 2017. The procedures followed were in accordance with the ethical standards of the Helsinki Declaration of 1975, as revised in 2000. The local ethics committee approved the study (approval number AC-14-033) and all participants provided written informed consent. Five patients were ultimately excluded from the final clinical evaluation due to acute post-operative infection in two, and severe worsening of Parkinson disease, foot ischaemia, and stroke in three others. The study was conducted in two parts.
Part 1: Inter- and intra- observer reliabilityTwenty-three patients were selected by simple random sampling [26] from opaque sealed envelopes shuffled from the total group. The average age was 71 ± 8 years, average body mass index (BMI) was 30.8 ± 4.2 kg/m2, 15 were female and 12 had right TKA. The American Society of Anesthesiology score (ASA) [27] was type II, III and IV in 60.9%, 30.4% and 8.7%, respectively. Pre-operative HKA mechanical axis was measured on weight-bearing hip–knee–ankle lower limb radiographs using a semiautomatic software system (RAIM viewer® version 2.5.0.511). The HKA mechanical lower limb axis average was 5.9° ± 9.0° (2.0°–9.8°).
Three blinded observers [two orthopaedic surgeons (FYS, JCG) and one musculoskeletal radiologist (DGP)] not involved in the surgical procedures reviewed and analysed TKA rotational component angles in the CT images. All reviewers had a 4 h training period before starting the measurements. All measurements were performed twice, with a minimal interval of 6 weeks between each measurement and with no knowledge of previous measurements and those of each other at the time of observation.
Part 2: Discriminative capacity of TKA component rotation for predicting clinical successWe analysed the full cohort of 55 patients to ascertain the discriminative capacity of TKA component rotation values for predicting a successful clinical outcome. The average age was 71 ± 7 years, average was BMI 30.8 ± 4.2 kg/m2, with 36 females and 29 left knees. The ASA score was type I, II, III and IV in 5.2%, 54.5%, 36.4% and 3.6% of the patients, respectively. HKA mechanical lower limb axis average was 5.2° ± 7.7° (3.1°–7.3°).
One blinded observer [orthopaedic surgeon (JCG)] not involved in the surgical procedures or in the clinical follow up reviewed the CT images. That reviewer analysed in all patients the more reliable femoral, tibial and combined TKA rotational component angles, as established in part one of the study.
Surgical procedureAll patients received a cemented posterior stabilized (PS) Nex-Gen® TKA (Zimmer-Biomet, Warsaw, IN, USA). Antibiotic and thromboembolic prophylaxis was used in all patients. All were operated under tourniquet with a medial parapatellar approach, using a measured resection technique [28] with all instruments and guides provided by Zimmer-Biomet. The proximal tibia cut was made perpendicular to the mechanical axis in the antero-posterior and sagittal planes with the aid of an extramedullary guide. The distal femoral cut, perpendicular to the mechanical axis in the AP and sagittal planes, was performed with the aid of an intramedullary guide. We inserted all femoral component with three degrees of external rotation using a posterior referencing cutting guide. Staged ligamentous releases to balance flexion–extension gaps were performed [29, 30]. Tibial rotation was established in relation to the medial third of the anterior tibial tuberosity. Patellar resurfacing was performed in all procedures by subluxing the patella. All patients underwent the same post-operative protocol.
Clinical assessmentOne blinded observer (FYS) not involved in the surgical procedures examined all patients using the Knee Society Score (KSS) [31] clinical protocol at 1 year post-operative follow up. The KSS_POST is the sum of a clinically rated portion (knee score, KSS_KNEE-POST) that covers pain, range of movement, alignment and stability and a patient reported portion (function score, KSS_FUNCTION_POST) that covers patient’s mobility (walking distance and stairs) and potential walking aids. The KSS score range is from 0 to 100 points for each portion, with higher scores indicating better outcome.
2D-CT radiological measurementsNon-contrast material-enhanced helical 2D-CT scans were obtained at 6 months post-operatively using a LightSpeed VCT 64 scanner (General Electric, Hino, Japan). The protocol for CT scan uses 140 kV, 400 mA and 0.6 mm thick axial images obtained at four locations of the knee (the femoral epicondylar axis, the tibial component tray, the proximal tibial plateau and the tibial tubercle) and at the ankle joint. Only the axial imaging of the knee and ankle were considered for this study. Patients were scanned in the supine position with knees in maximum extension and legs fixed in neutral rotation as determined by facing the patella forward. regardless of the foot position. The knee was scanned from the superior patellar margin to the bottom of the anterior tibial tuberosity and 2–3 cm on either side of the tibiotalar joint. For the two regions the x, y and z axes were kept fixed for the duration of the scan to maintain the relative position of the two regions with respect to each other.
We used image processing software dedicated to DICOM images, with a measuring tool within the Alma Workstation 4.2.3.0 (Alma Medical Imaging, Barcelona, Spain) program to measure distances and angles. External rotation (ER) of the component was considered to be a positive value and internal rotation (IR), a negative value.
We determined Berger’s femoral component rotation angle (BFA) using the method described by Berger [1] (Fig. 1). To simplify the measurement, we, as other authors [3, 13] do not apply differing male and female corrections of native rotation from the posterior condylar angle (e.g. 0.3° ± 1.2° IR in females and 3.5° ± 1.2° IR in males).
Fig. 1
The Berger’s femoral component rotational angle (BFA). Axial CT image showing measurement of the rotation of the femoral component using the surgical transepicondylar axis and the posterior femoral condylar axis. The surgical transepicondylar axis is a line drawn between the lateral epicondylar prominence and the medial sulcus of the medial epicondyle in a slice where the two landmarks were visible. The posterior femoral condylar axis is a line drawn tangential to the posterior surface of the two condyles of the TKA femoral component
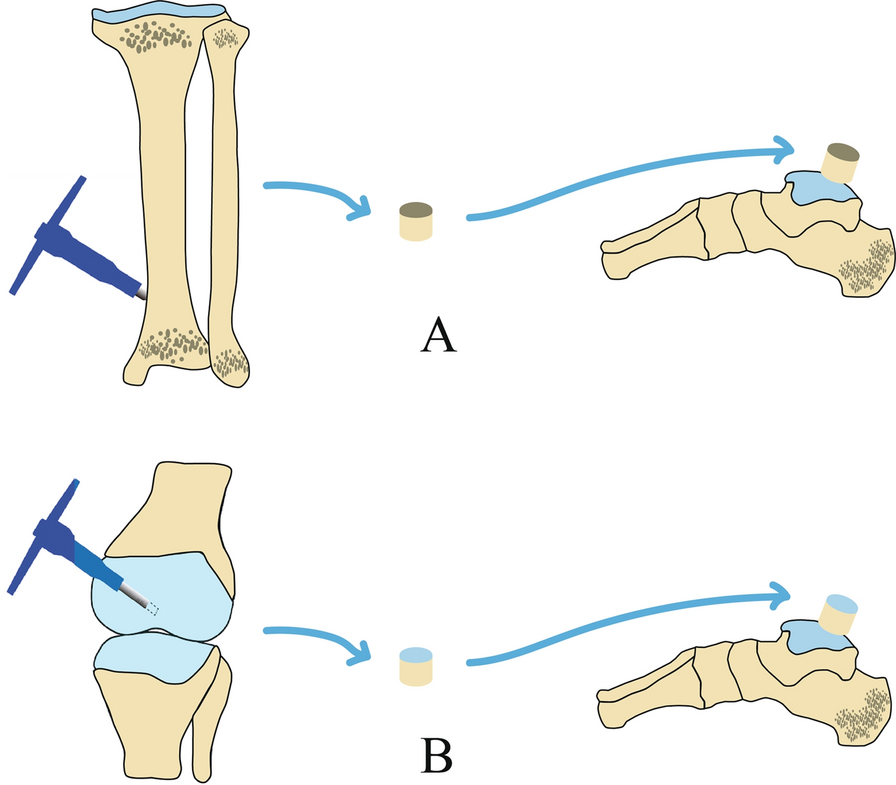
We assessed three tibial component rotation measurement techniques. First, Berger´s tibial angle (BTA) (Fig. 2A), using the method described by Berger [1]. Second, the anatomic tibial angle (ATA) (Fig. 2B), using the method described by Cobb [14]. Third, the bimalleolar posterior tibial component angle (BM_PTCA) (Fig. 2C), formed by the transmalleolar axis and the posterior tibial component axis. The transmalleolar axis is a line between the centre of the medial malleolus and the centre of the fibula in an axial slice situated on the ankle centre and bisecting the malleoli [32] (Fig. 2C-1). The posterior tibial component axis was a line tangential to the posterior TKA tibial plateau.
Fig. 2
TKA tibia component rotation measures. A Beger’s tibial angle (BTA) formed between the line that connects the geometric centre of the tibial plateau and the tip of the tibial tubercle and the anteroposterior tibial component axis. The geometric centre of the tibial plateau measured in the first CT slice just under the metal tray (A-1) was located and axially transposed to CT slice at the level of the tibial tubercle (A-3). Then, the geometric centre of the tibial plateau and the tip of the tibial tubercle are connected (A-3). The anteroposterior tibial component axis is drowned in a single axial scan through the tibial component perpendicular to the posterior tibial component axis (A-2) and transposed to the CT slice at the level of the tibial tubercle. The posterior tibial component axis was a line tangential to the posterior TKA tibial plateau. The tip of the tibial tubercle is 18° (± 2.6°) externally rotated from the native tibial articular surface, the tibial component was considered neutral (0°) when internally rotated 18° in relation to the tip of the tibial tuberosity. B Anatomic tibial angle (ATA) formed between the anatomic tibial axis (B-1) and the posterior tibial component axis (B-2). The anatomic tibial axis is the line defined by the geometric centre of the lateral tibial plateau and the geometric centre of medial tibial plateau measured in the first tibial CT slice just under the TKA tibial component (B-1). C Bimalleolar posterior tibial component angle (BM_PTCA) is the angle formed by the transmalleolar axis (C-1) between the centre of the medial malleolus and the centre of the fibula in an axial slice situated at the ankle centre and bisecting the malleoli and the posterior tibial component axis (C-2)
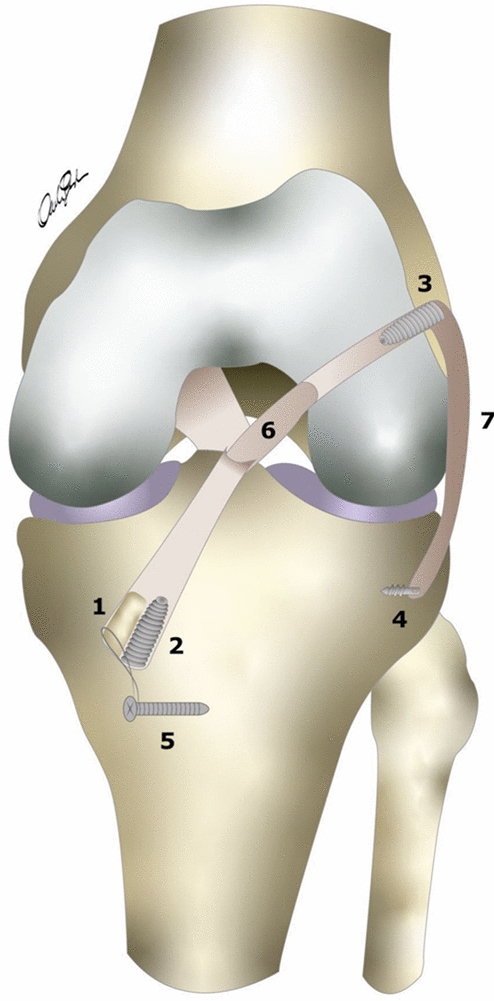
We evaluated four combined femoral and tibial TKA rotation measurement methods. First, the transepicondylar posterior tibial component angle (TE_PTCA) (Fig. 3A), formed by the surgical transepicondylar axis and the posterior tibial component axis. The surgical transepicondylar axis was a line drawn between the lateral epicondylar prominence and the medial sulcus of the medial epicondyle in a slice where the two landmarks were visible. Second, the bicondylar posterior tibial component angle (BC_PTCA) (Fig. 3B), formed by the posterior femoral component axis and the posterior tibial component axis. The posterior femoral component axis was a line drawn tangential to the posterior surface of the two condyles of the TKA femoral component. This angle measures the rotation between the TKA femoral and tibial components independently from anatomic landmarks, it is the device rotation. Third, the transepicondylar bimalleolar angle (TE_BM) (Fig. 3C), formed by the surgical transepicondylar axis and the transmalleolar axis. Fourth, the bicondylar bimalleolar angle (BC_BM) (Fig. 3D), formed by the posterior femoral component axis and the transmalleolar axis.
Fig. 3
TKA combined rotation measures. A Transepicondylar posterior tibial component angle (TE_PTCA) is the angle between the surgical transepicondylar axis (A-1) and the posterior tibial component axis (A-2). B The bicondylar posterior tibial component angle (BC_PTCA) is the angle formed by the posterior femoral condylar axis (B-1) with the posterior tibial component axis (B-2). C The transepicondylar bimalleolar angle (TE_BM) is the angle between the surgical transepicondylar axis (C-1) and the transmalleolar axis (C-2). D The bicondylar bimalleolar angle (BC_BM) is the angle between the posterior femoral condylar axis (D-1) and the transmalleolar axis (D-2)
Statistical analysesThe normal distribution of all the data was confirmed using the Kolmogorov–Smirnov test and the homogeneity of variances by Levene’s test.
A sample size calculation could not be done at the beginning of the study because we did not have data of the new angles studied, and it was performed at the end to determine whether the study had adequate power. The sample size calculation utilized previously published differences between methods for the already described femoral and tibial rotational angles [8] and the mean ± SD of the obtained values in the present study for the new tibial and combined rotational angles that lack of reference data. A desired sample size between 12 and 23 patients was calculated with an α level of 0.05 and a β level of 0.20 (80% power), using MedCalc statistical software version 19.0.3 (MedCalc Software Bvba, Ostend, Belgium) to assess agreement between the observers using the Bland–Altman plot analysis. The expected mean of differences, the expected SD of differences and the maximum allowed difference between methods was set at −0.9°, 1.6° and 6° for BFA; −4.1°, 3.0° and 12.0° for BTA; 0.1°, 4.0° and 16.0° for ATA; 1.1°, 4.3° and 17.0° for BM_PTCA; −0.5°, 2.8° and 11.0° for TE_PTCA; − 0.5°, 2.0° and 7.0° for BC_PTCA; − 2.0°, 2.8° and 11.0° for TE_BM and −2.8°, 3.0° and 12.0° for BC_BM, respectively.
The inter-and intra-observer agreement between two measurements was assessed using the Bland–Altman plot method [33]. For inter-observer agreement, Observer 3 (JCG) was taken as reference and the first rotational measure was used. For intra-observer agreement the first and second rotational measure of the three observers was taken. The limits of agreement (LOAs) were set, within which 95% of the differences between one measurement and the other are included were calculated.
The area under the ROC curve (AUC) analysis [34] was used to establish the discriminative capacity of BFA, ATA, TE_PTCA and BC_PTCA for predicting a successful clinical outcome according to the established KSS thresholds of 160, 70 and 86 points for KSS_POST, KSS_FUNCTION_POST and KSS_KNEE_POST, respectively [35], for discriminating between patients with or without treatment success following TKA. A test is considered good, very good or excellent when the AUC is 0.75–0.9, 0.9–0.97 or 0.97–1, respectively [34].
The analyses were performed using statistical software IBM® SPSS® version 28.0 (IBM Corp.; Armonk, NY, USA). The statistical significance was set at p < 0.05.
Comments (0)