
Remember me

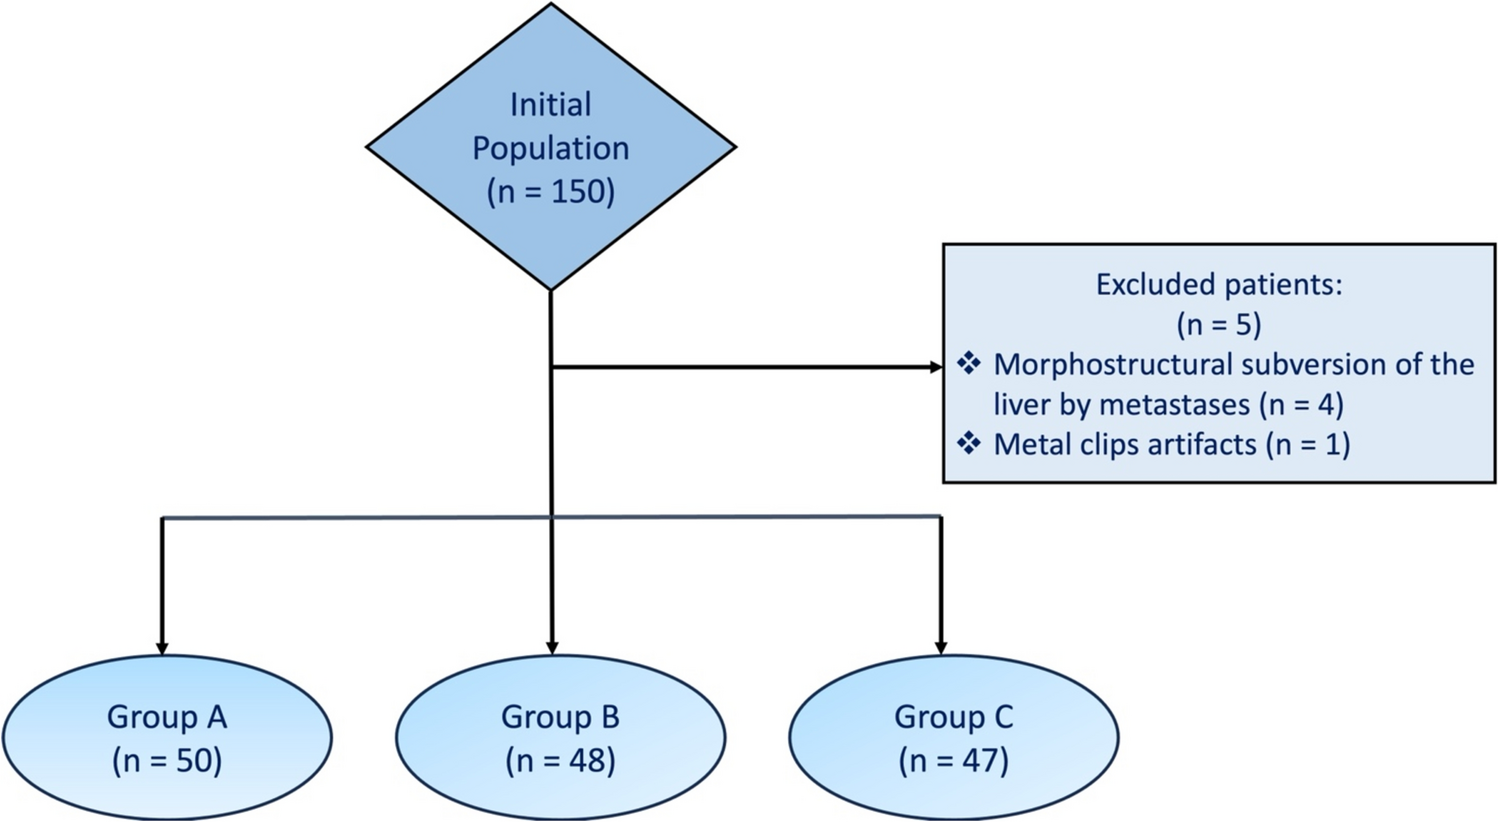


This is a retrospective monocenter study involving newly diagnosed BC patients treated with NAC and studied with baseline [18F]FDG PET/CT between February 2015 and November 2023 at the Sant’Anna University Hospital of Ferrara (Italy).
The inclusion criteria of the study were: (a) age > 18 years, (b) histologically proven diagnosis of BC; (c) baseline [18F]FDG PET/CT performed prior to the first cycle of NAC; (d) history of NAC; (e) availability of histopathology and follow-up survival data.
The exclusion criteria were: (a) concomitant diagnosis of other oncological diseases; (b) patients with a previous diagnosis of BC who already received oncological treatment; (c) patients with evidence of distant metastases at baseline [18F]FDG PET/CT (d) patients who did not complete the proposed scheme of NAC; (e) patients who did not receive surgery after NAC.
Available clinical-pathological data were collected, including age, histology, grade, Estrogen Receptor (ER) expression, Progesterone Receptor (PR) expression, Ki-67 index, HER-2 expression, BRCA mutational status. The patients were classified according to the St. Gallen consensus [24] into 5 molecular subtypes subgroups: (1) Luminal A (ER-positive and/or PR-positive and HER-2 negative; Ki67 < 20%); (2) Luminal B (ER-positive and/or PR-positive and HER-2 negative; Ki67 ≥ 20%); (3) Luminal B + HER-2 (ER-positive and/or PR-positive and HER-2 positive; Ki67 ≥ 20%); (4) HER-2 enriched BC (without hormonal receptors expression and HER-2-positive); (5) TNBC (without expression of both hormonal receptors and HER-2 protein).
The study was performed according to the Declaration of Helsinki, Good Clinical Practice, and local ethical regulations. The local ethical committee approved the study (protocol number: 402/2024/Oss/AOUFE) and patients’ written informed consent was collected.
NAC, surgery and histologyThe types of NAC proposed were: (a) Epirubicin and Cyclophosphamide (EC) + Taxol; (b) EC + Taxol + Trastuzumab; (c) Taxol + Trastuzumab; (d) EC + Taxol + Carboplatin. The selection of the NAC scheme was performed according to the subtype of BC and observing the most updated guidelines at the time of the therapeutic decision.
All patients underwent breast surgery (breast-conservative and/or total mastectomy) and axillary staging (lymph node dissection and/or sentinel lymph node radioguided technique) after completing NAC.
At histological analysis after surgery, pCR was considered the main outcome after NAC, according to the Sataloff criteria [25] and defined as the complete absence of residual invasive tumor cells on microscopy, both in the breast and in the collected lymph nodes. Patients were divided as non-pCR or pCR, according to the absence (Sataloff Grades B, C and D), or evidence of pCR (Sataloff Grade A), respectively.
[ 18F]FDG PET/CT imagingPET/CT scans were performed according to a standardized protocol detailed in a previous paper ([14].
The analysis of [18F]FDG PET/CT was performed by two experienced nuclear medicine physicians on a syngo.via workstation (Siemens Healthineers, Enlargen, Germany), as shown in Fig. 1. The primary tumor and, when applicable, the pathological regional lymph nodes were identified on the PET images. Circular regions of interest (ROIs) were manually drawn and automatically converted in 3D volumes of interest (VOIs) by the software. The most common semiquantitative parameters were collected, including maximum and mean Standardized Uptake Value (SUVmax and SUVmean, respectively), metabolic tumor volume (MTV) and total lesion glycolysis (TLG). A 40% SUVmax thresholding was used to calculate volumetric parameters.
Fig. 1
Baseline [18F]FDG PET/CT axial fused (a), CT (b), PET images (c) and MIP (maximum intensity projection) (d) of a 31 years-old women affected by TNBC. The exam shows focal [18F]FDG uptake (SUVmax = 23.8) in correspondence of the primary BC, as well as in a left axillary and in a homolateral internal mammary lymph nodes. The patient’s stage is therefore cT2;cN3. The patient achieved pCR after NAC
Imaging postprocessing and features extractionVOI segmentations of the primary tumor and the most significant lymph node metastasis (in terms of [18F]FDG uptake) were manually performed on [18F]FDG PET/CT images by two expert nuclear medicine physicians on MIM Maestro version 7.3.2 (MIM Software, Inc., Cleveland, OH), as shown in Fig. 2. Any discrepancies were resolved by consensus.
Fig. 2
Manual segmentation of the VOI on transaxial CT (a), PET (b) and fused (c) images around the area of focal 18F-FDG uptake using MIM Maestro software
Quantitative radiomics features (RFts) were extracted from each VOIs on PET and only from those of the primary breast lesions on CT images. The process was performed separately using the Radiomics package and 3D Slicer image computing platform, according to IBSI standardization [26].
Before extracting the high-quantitative features, a discretization process with a fixed bin number of 25 was applied both for PET and CT images. Overall 121 radiomic features were extracted from each segmented VOI both on PET and CT images. Among those, respectively divided by classes, 14 RFts belong to original image and mask, 14 to Shape (3D) class, 18 to First Order intensity statistics, 24 to Gray Level Co-occurrence Matrix (GLCM), 16 to Gray Level Run Length Matrix (GLRLM), 16 to Gray Level Size Zone (GLSZM), 14 to Gray Level Dependence Matrix (GLDM) and 5 to Neighboring Gray Tone Difference Matrix (NGTDM). In addiction 744 textural RFts were extracted from wavelet decomposed VOIs.
Statistical analysis and model constructionThe correlation between clinical parameters, [18F]FDG PET/CT metabolic (SUVmax, SUVmean) and volumetric (MTV and TLG) parameters and the pCR/non-pCR group was investigated using Two-tailed Wilcoxon-Mann–Whitney U-type test (p < 0.05). A sub-analysis of semiquantitative parameters in each molecular subgroups was performed with Pearson Chi square test (p < 0.05).
Before RFts reduction, The Synthetic Minority Over-Sampling Technique (SMOTE) strategy was used to balance the sample distribution of non-pCR and pCR into the dataset, obtaining a sample size of 78 lesions, 39 labeled non-pCR and 39 pCR. The cohort was then randomly divided into training set (70%) and internal validation set (30%). The training set was used to build a model for the prediction of pCR response after NAC.
A filter feature selection algorithm using a handcrafted python script was implemented to identify robust RFTs. Prior to the feature selection step, no data transformation or normalization was conducted. To evaluate the most robust, non-redundant and most reproducible RFts a p < 0.05 and a |rs|> 0.8 of the Wilcoxon-Mann-Witney U type test and Spearman Rank correlation coefficient respectively was considered. This analysis was independently performed for both CT-based and PET-based RFts datasets.
The bootstrap method and 10-Fold Cross Validation were used for the training of the ML Models. Four ML prediction models (PET Model_T, PET Model_T + N, CT Model and Clinical Model) were independently built. PET and CT Models were built using RFts selected and extracted from the corresponding images dataset (all VOIs for the PET Model_T + N; primary BC VOIs for PET Model_T and CT Model), whereas the Clinical Model was built using 8 clinical-pathological signatures (age, histology, grade, ER, PR, HER-2, Ki-67 and BRCA).
Orange data mining was used for training, test and validation of the different ML Models. For each ML Model, three different algorithms were trained: Random Forest (RF), Stochastic Gradient Descent (SGD) and Neural Network (NN).
Area under the ROC curve (AUC), Classification Accuracy (CA), Precision, Sensitivity, Specificity, True-Positive (TP) and True-Negative (TN) were calculated in the training and validation steps. This performance scores were used to evaluate the best algorithm for each ML Model.
Comments (0)