
Remember me
The treatment pathway for patients with moderately to severely active UC in Italy consists of first-line use of conventional therapies, such as 5-aminosalicylates or corticosteroids [6]. Where a response is inadequate, where response is lost, or where conventional therapies are not well tolerated by patients, then advanced therapies are used, which may include an anti-TNFα treatment (infliximab, adalimumab, and golimumab), vedolizumab (a α4β7 integrin antagonist), ustekinumab (an IL-12/23 inhibitor), or tofacitinib [a Janus kinase (JAK) inhibitor] [8]. If a response to an advanced therapy is inadequate, if response is lost, or if patients discontinue treatment because of adverse events, then patients are expected to cycle through all available advanced therapies until a response is achieved.
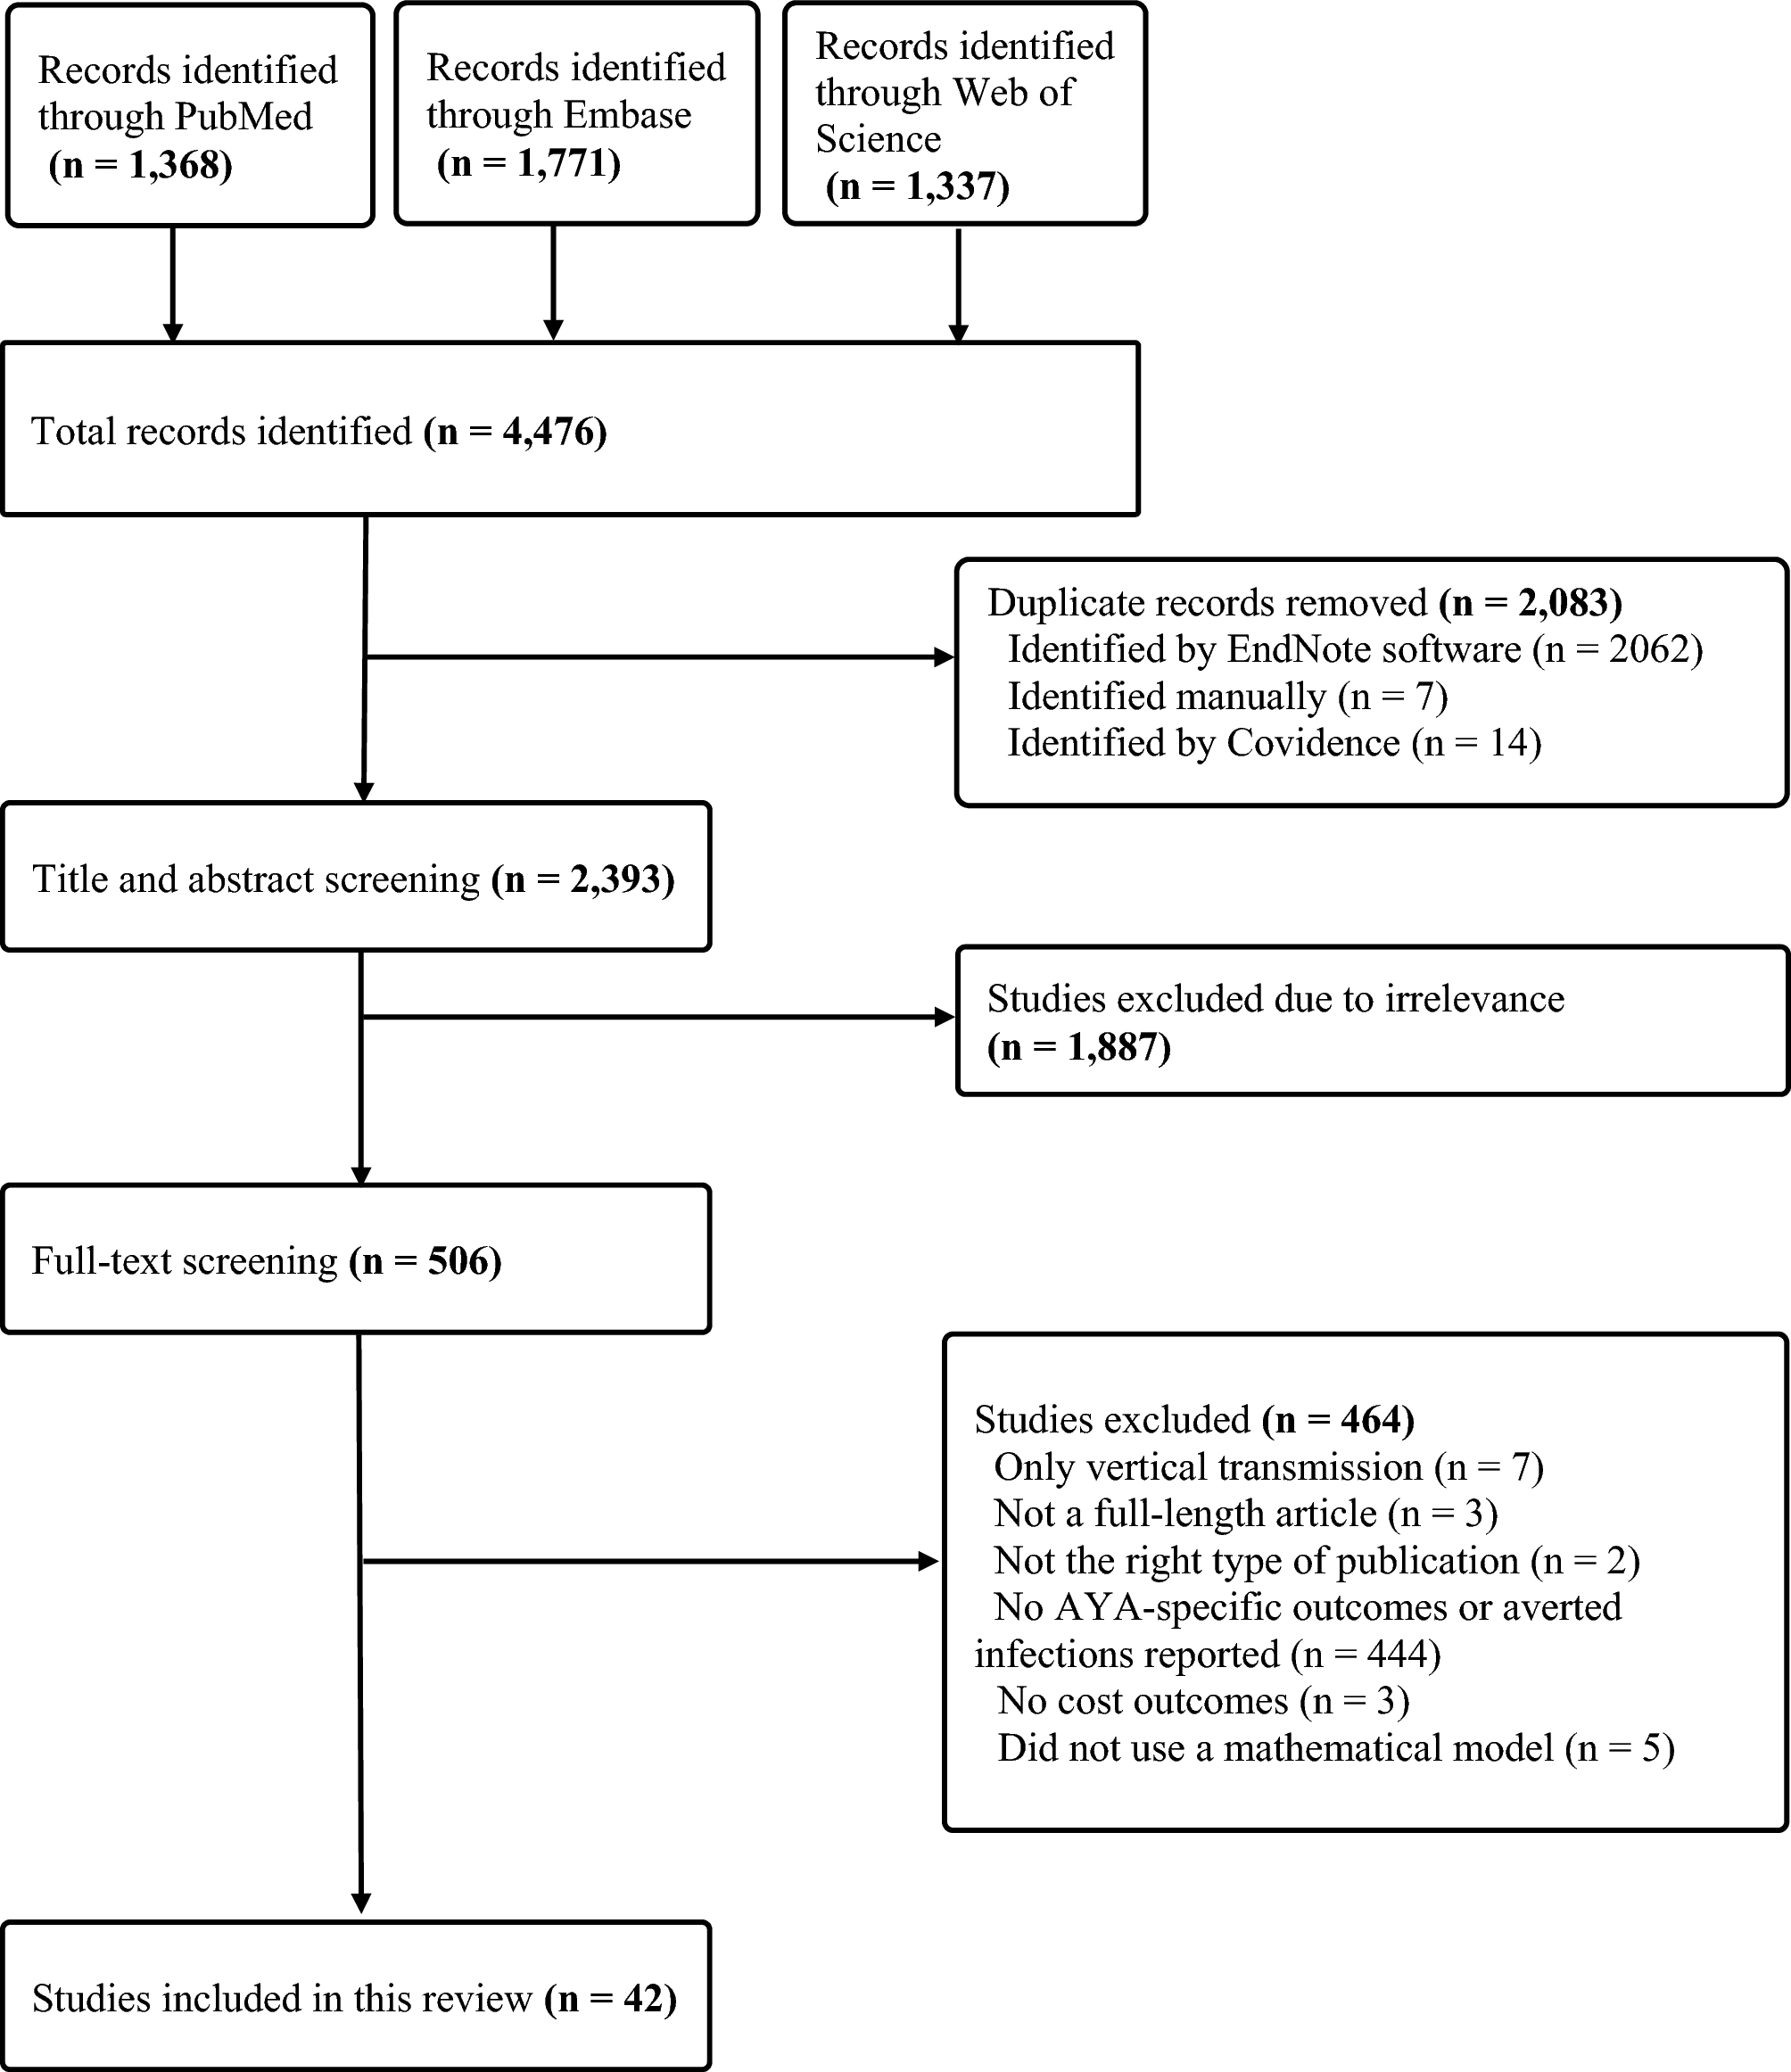
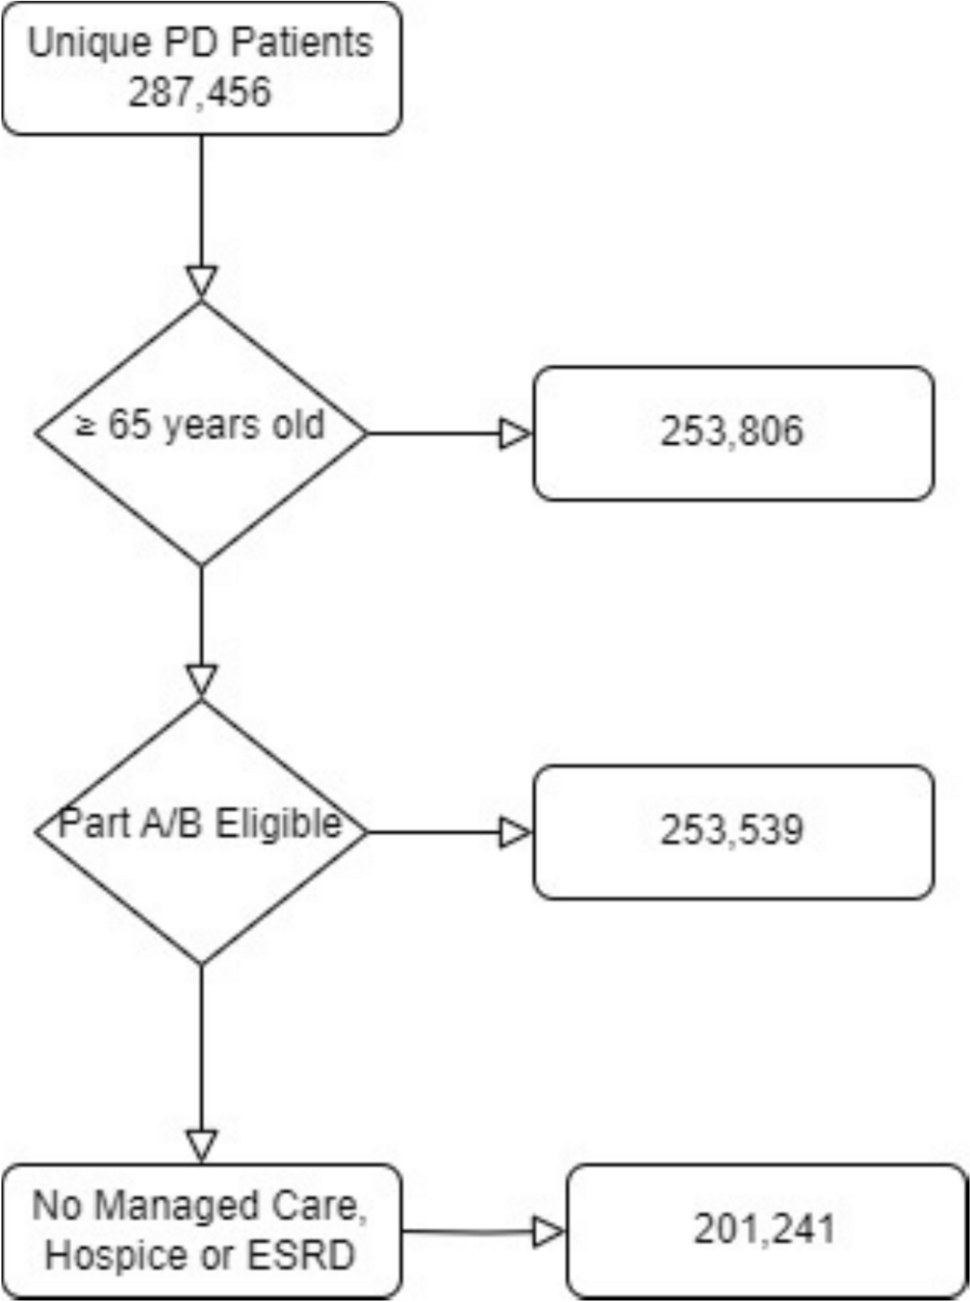
Where clinical guidelines provide statements regarding the choice of first-line advanced therapy, those guidelines suggest either infliximab (an anti-TNFα) or vedolizumab [7, 8]. This study compared sequences involving vedolizumab and adalimumab because of the availability of the direct comparison provided by the VARSITY clinical trial. The model was used to assess the impact of different levels of drug pricing and efficacy, such as may be observed for other therapies in the anti-TNFα class (e.g., infliximab). A comparison of the treatment sequences, in which vedolizumab and adalimumab appear as either first-line or second-line advanced therapies, is shown in Fig. 1. All advanced therapies beyond second-line treatments are represented as a single composite because of uncertainty regarding the number and ordering of subsequent treatments. Finally, patients may abandon advanced therapies and return to conventional therapies or surgery.
Fig. 1
Competing treatment pathways compared under the cost-effectiveness model base case. UC ulcerative colitis
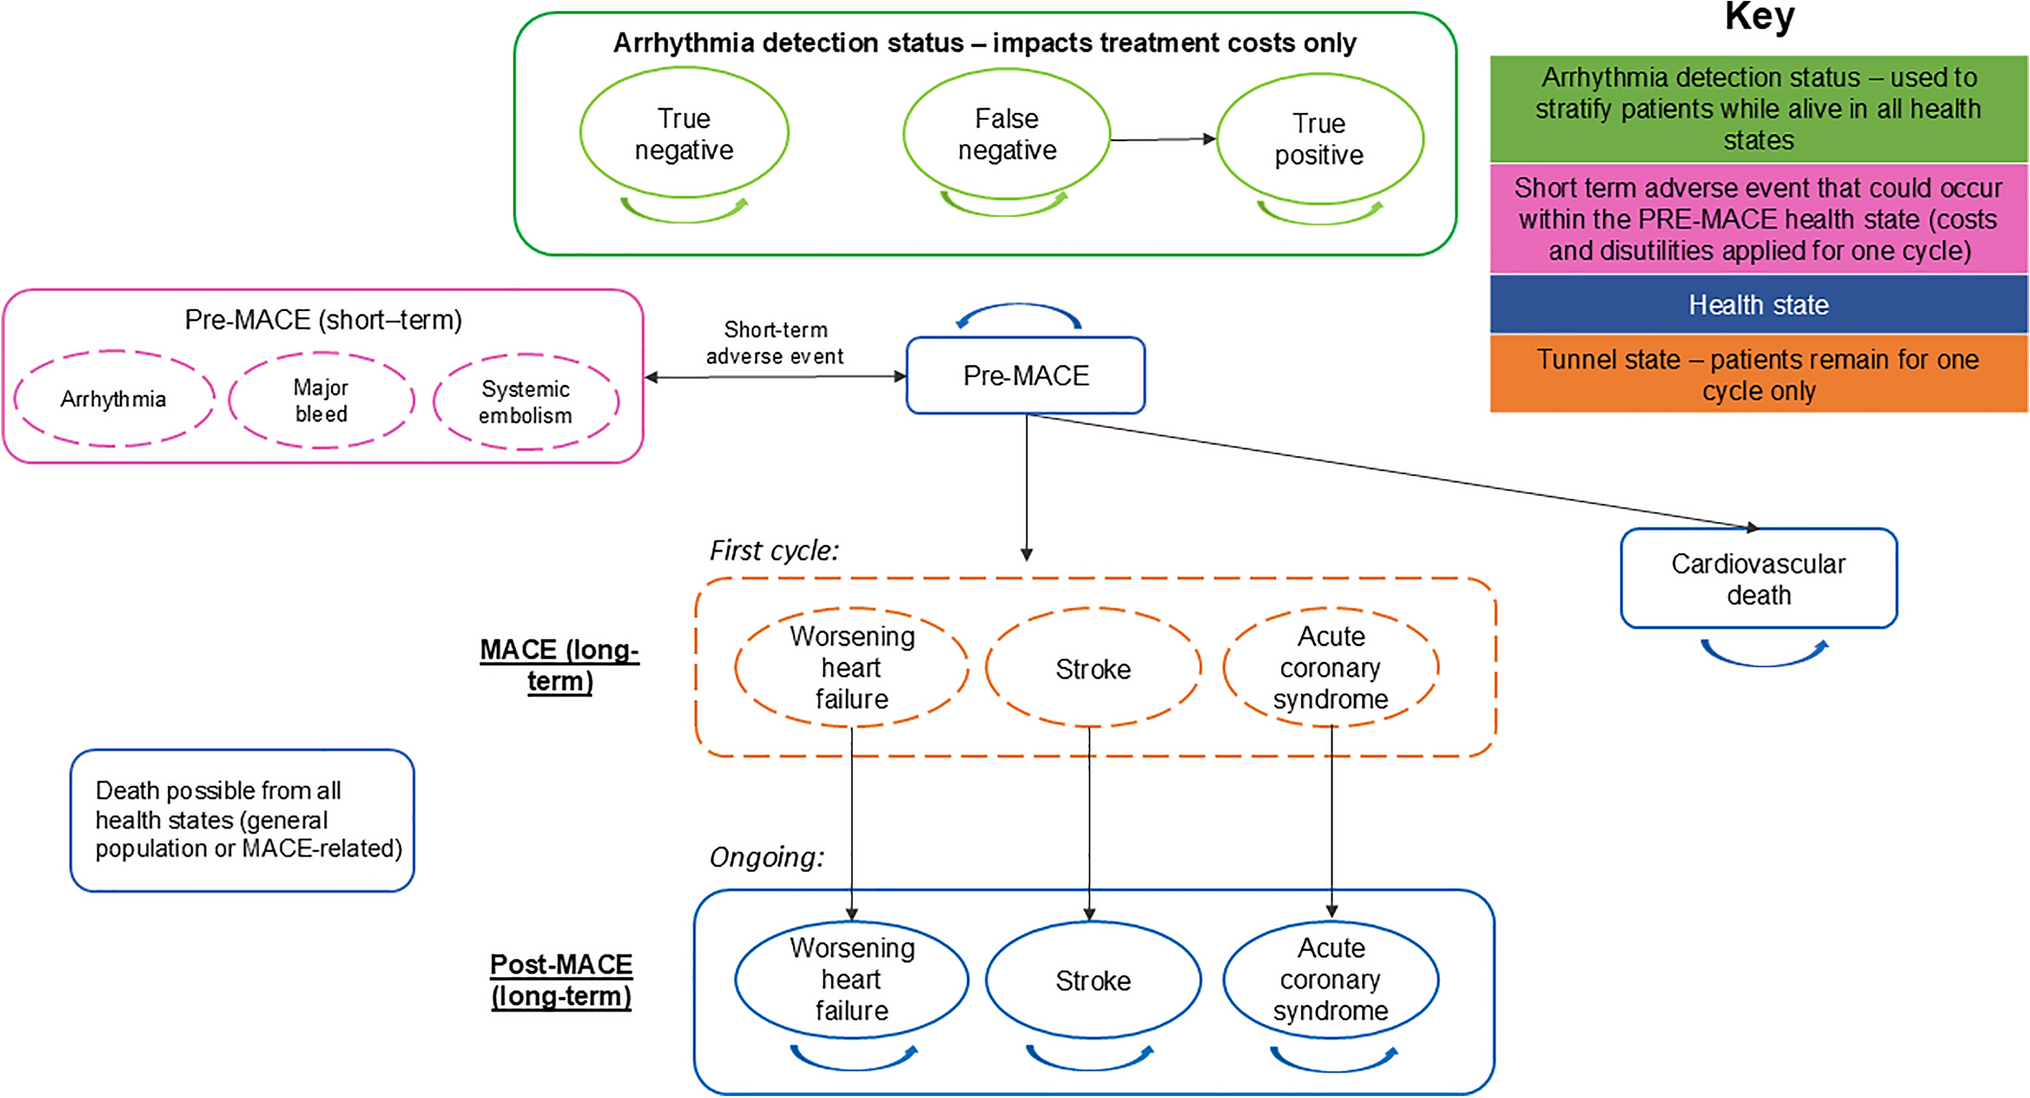
2.2 Model StructureThe cost-effectiveness model used a cohort state-transition structure (Markov model) throughout, with the treatment induction phase modeled as a series of tunnel states. The model used a cycle length of 2 weeks, chosen to capture the variable duration of treatment induction phases. The structure was closely related to the approach described in a recent submission to the National Institute for Health and Care Excellence (NICE) in the United Kingdom [12], and it was implemented in Microsoft Excel for Microsoft 365 (2023).
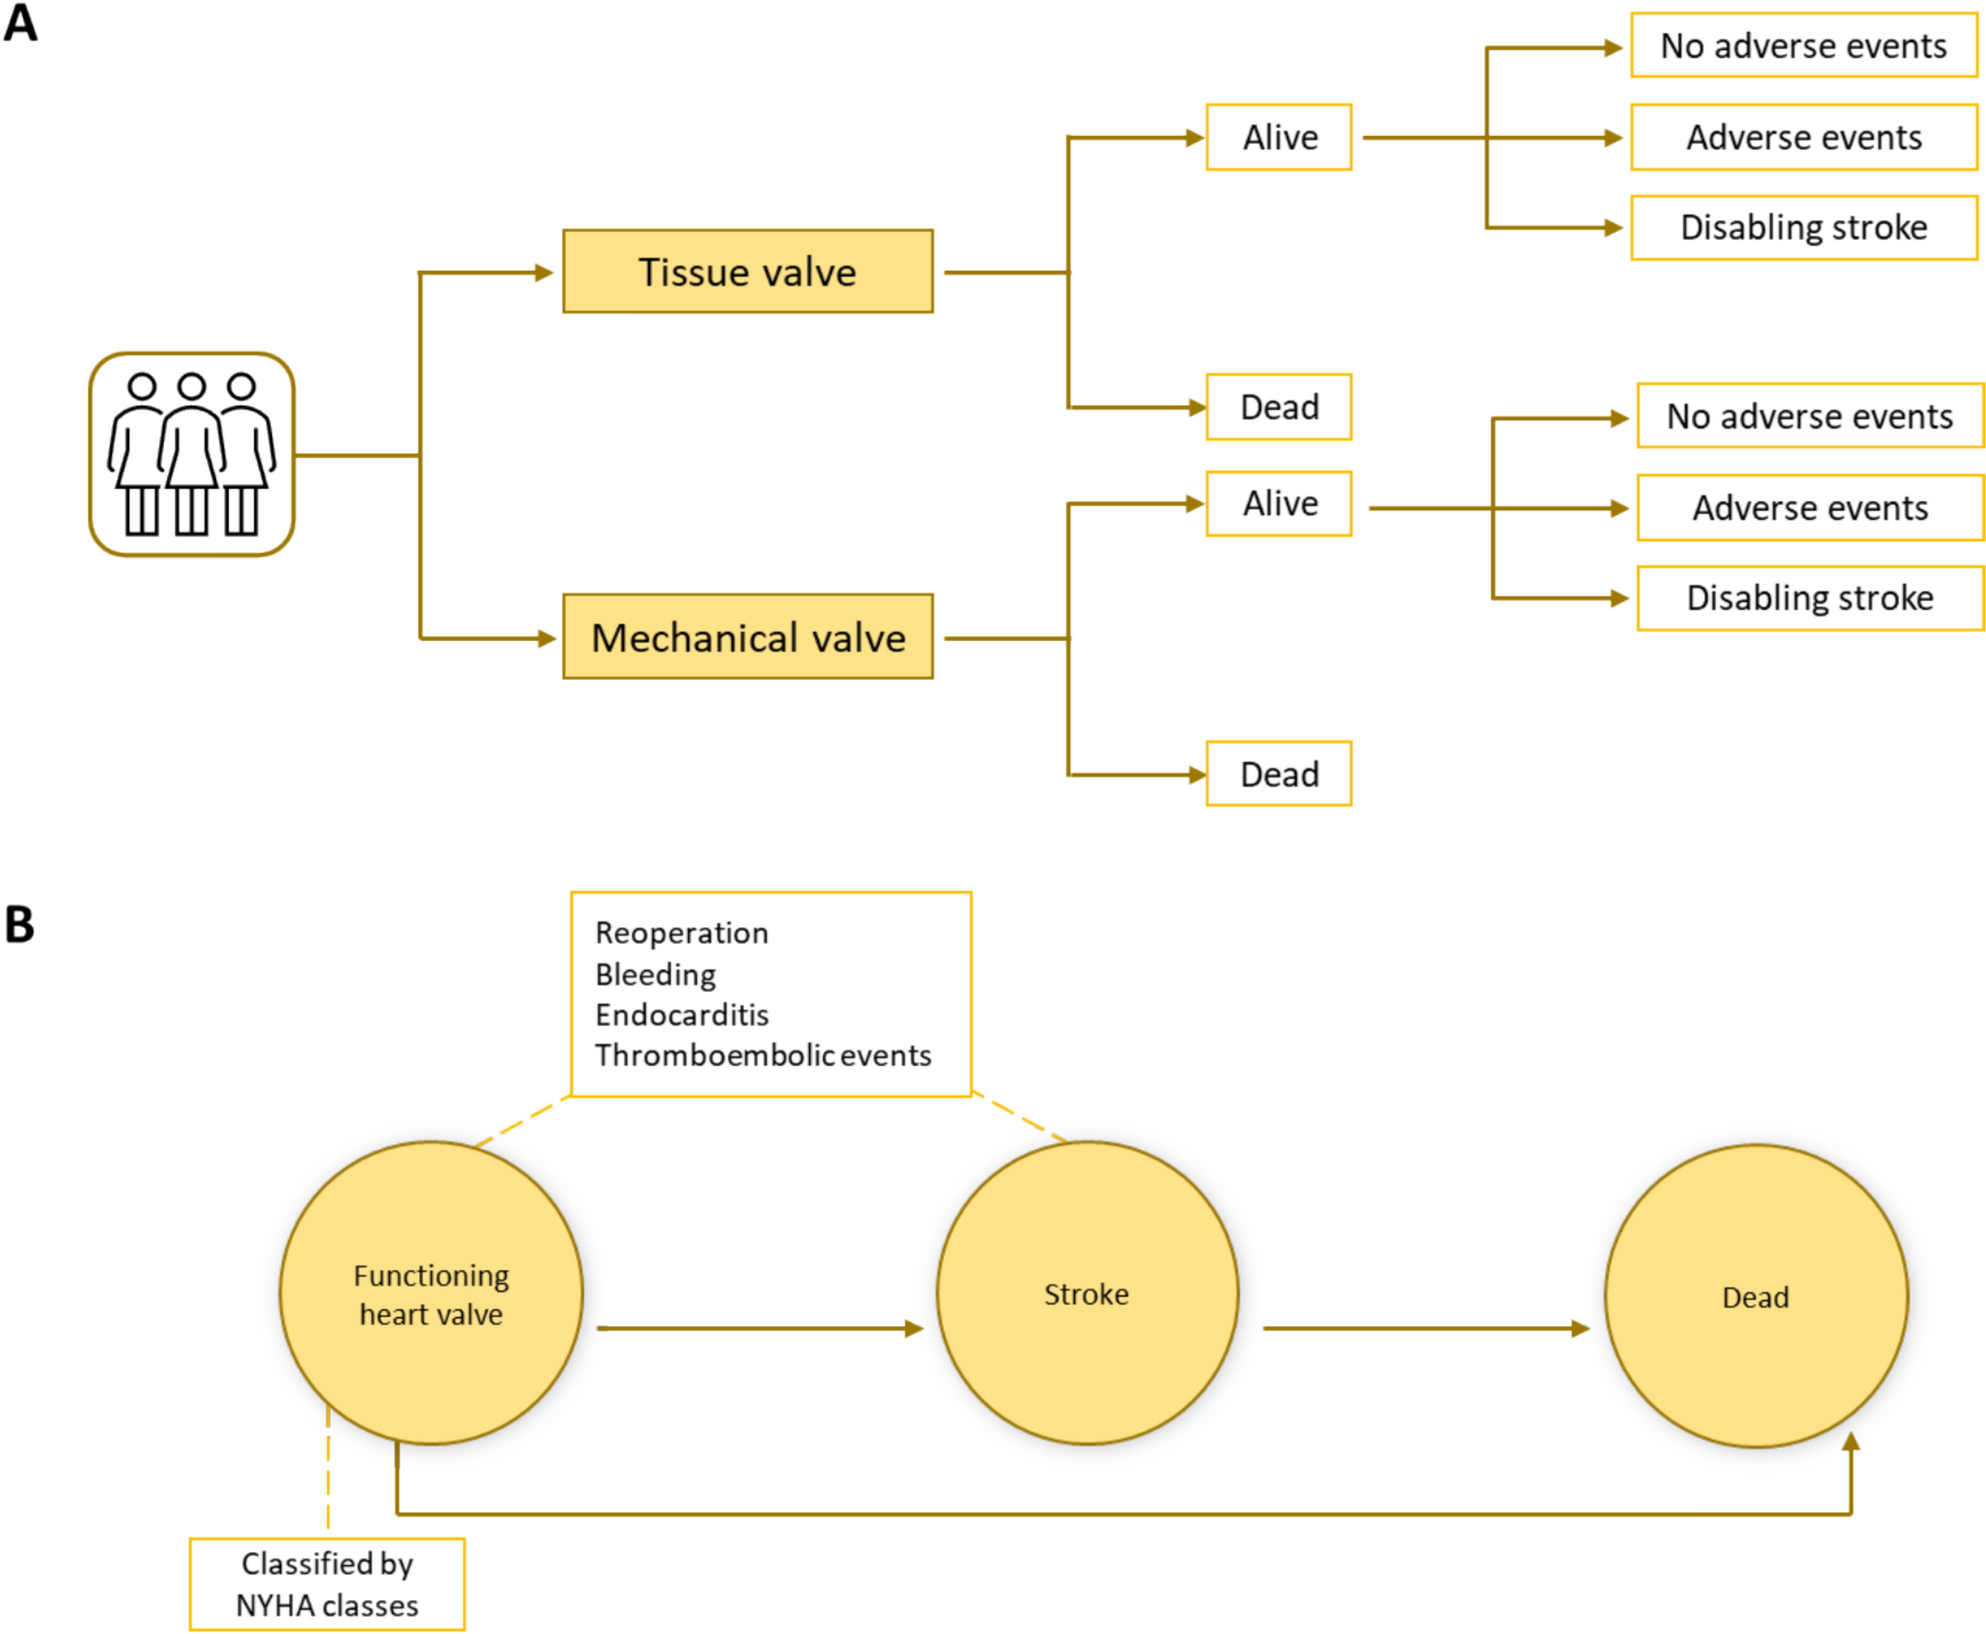
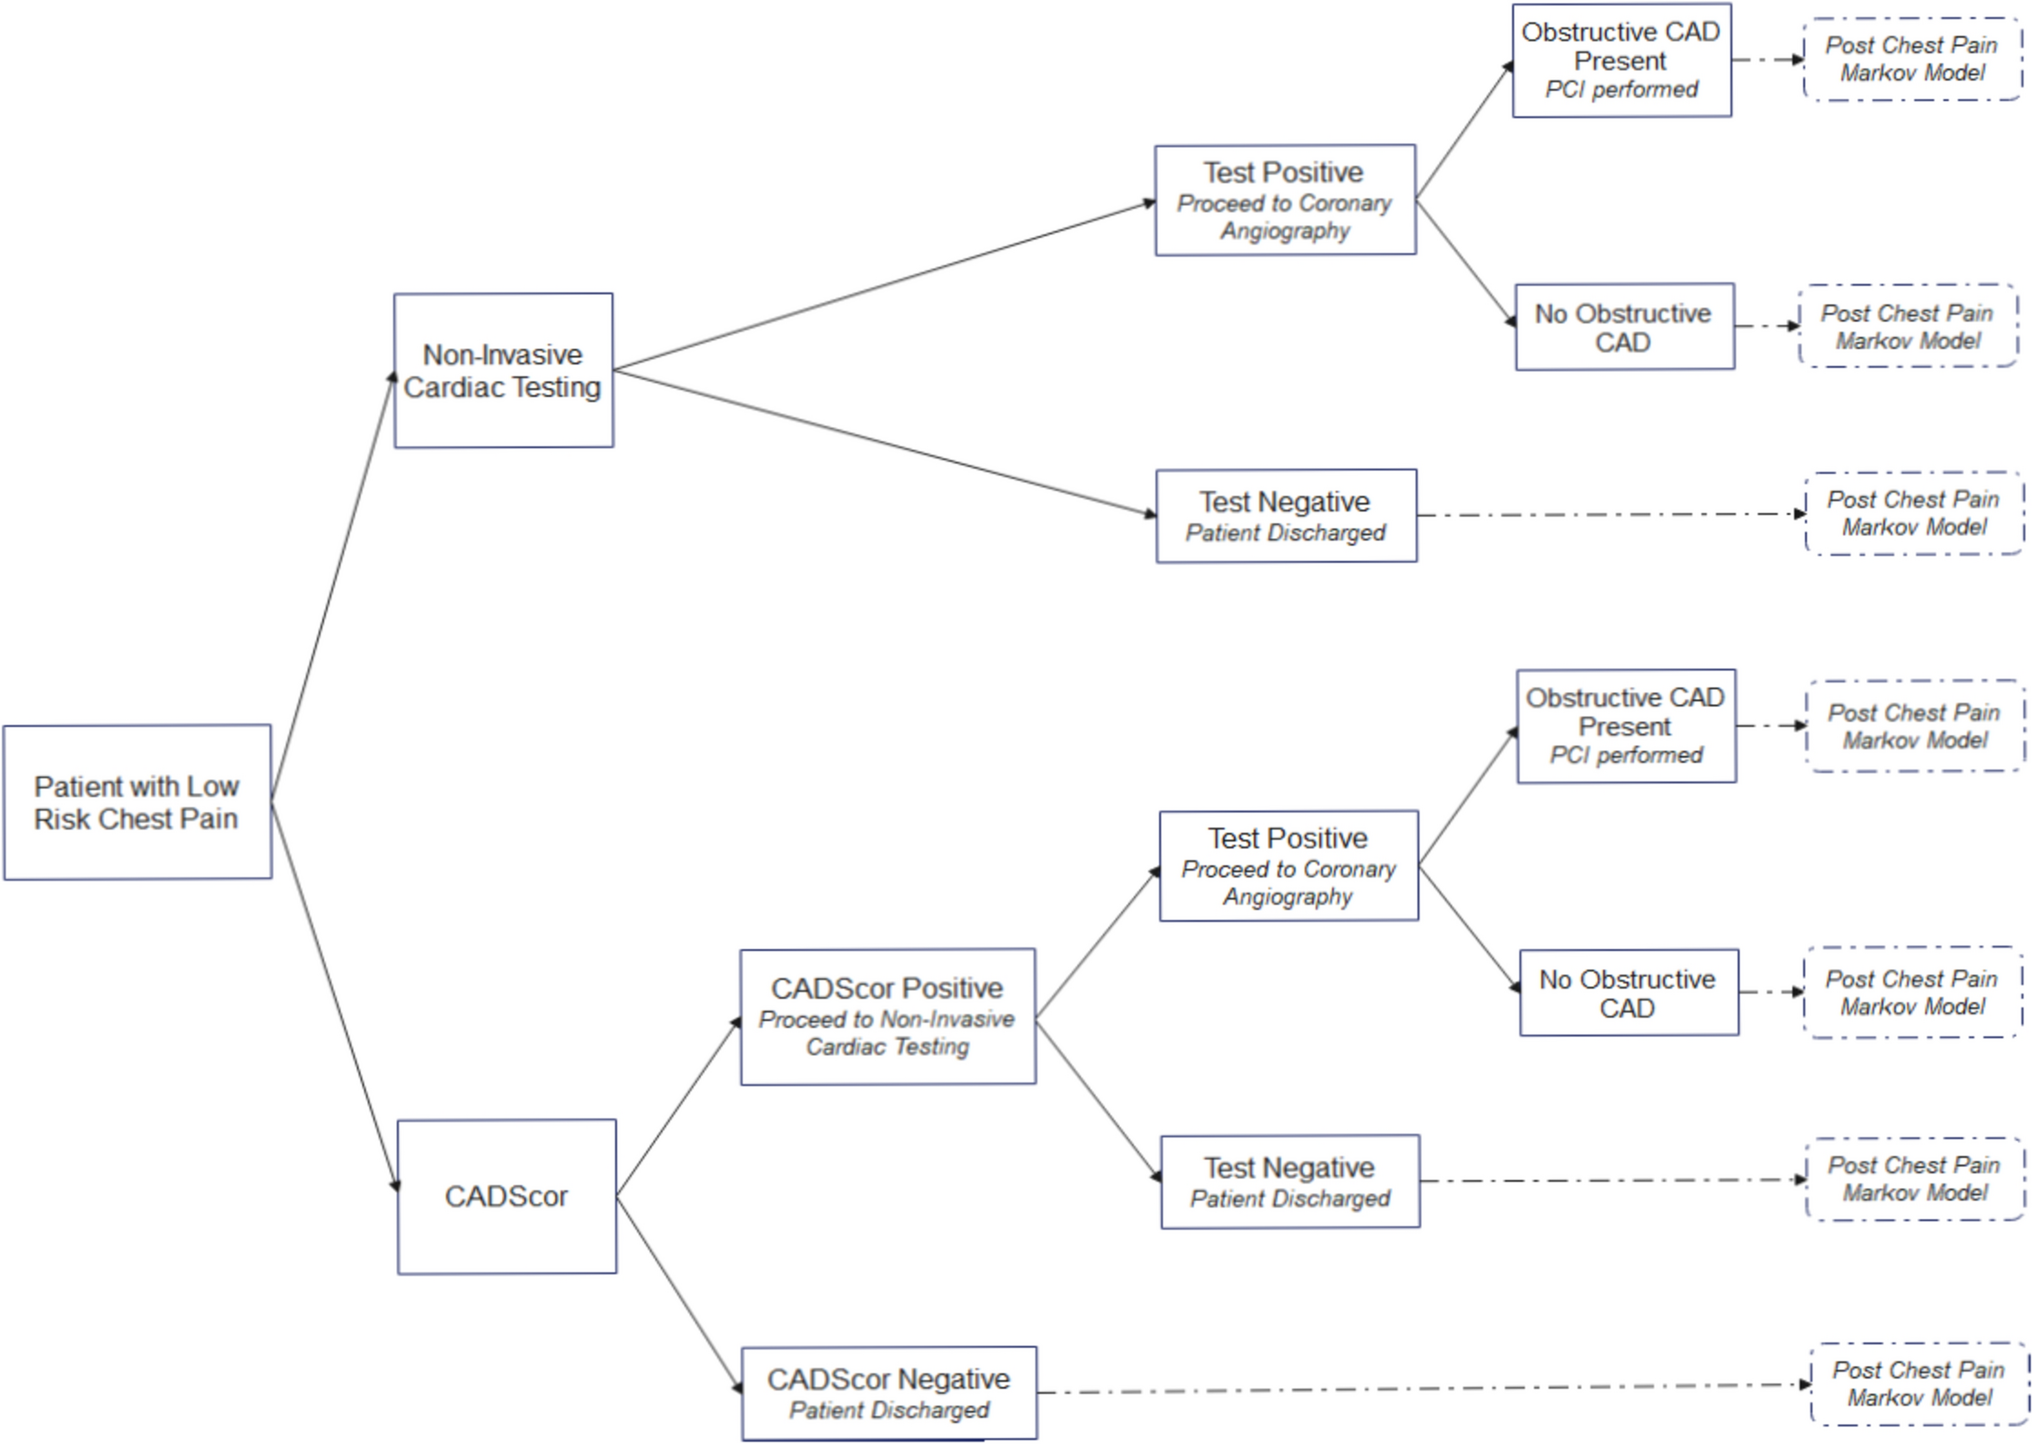
The health state structure of the cost-effectiveness model is shown in Fig. 2.
Fig. 2
Health state structure of the cost-effectiveness model. Pale purple indicates Markov model health states where patients may remain for more than one cycle. Dark purple indicates tunnel states where patients can remain for one model cycle only. Grey background indicates on-treatment health states where patients receive advanced therapy. UC ulcerative colitis
The starting cohort consists of patients in the active UC health state, having failed to achieve an adequate response on conventional therapies. These patients immediately begin induction on a form of first-line advanced therapy. Patients may discontinue treatment during any cycle of the induction phase and do discontinue at the end of induction if a clinical response or remission is not achieved. Transitions following discontinuation depend on the availability of subsequent lines of advanced therapy. Where these are available, patients immediately begin the induction phase of the subsequent treatment or, if unavailable, move to the active UC health state.
After completion of the induction phase, a proportion of patients enter the clinical response (without remission) or clinical remission health states. The definitions of clinical remission and clinical response are based on the Mayo and partial Mayo scores, respectively, and are aligned with criteria used in the VARSITY clinical trial [11]. Patients remain in these states during the treatment maintenance phase unless discontinuation occurs because of a loss of response or an adverse event. In the base case, patients cannot transition between response and remission states; a scenario analysis relaxes this assumption (Table 1, scenario 3).
Table 1 Details of scenario analyses performed to investigate key assumptions and uncertaintiesPatients entering the active UC health state are subsequently at risk of death or surgical intervention. The latter is the final treatment option for patients whose UC cannot be managed with pharmacotherapy; there is no option for spontaneous response or remission. The quality of life and healthcare effects of surgery were assumed to last for 6 months, in line with previous economic models [12], and they were modeled via tunnel states spanning 13 model cycles or approximately 6 months. After undergoing an initial surgical intervention, patients entered the post-surgery remission state or experienced post-surgery complications. However, patients with post-surgery remission were at risk of experiencing complications in subsequent cycles. Post-surgery complications may lead to a corrective surgical procedure, following which patients enter the post-second surgery remission state.
2.3 Model Inputs and Data Sources2.3.1 Patient PopulationThe target patient population are those with moderately to severely active UC who had an inadequate response to conventional therapies. The baseline characteristics of these patients was assumed to be represented by the cohort enrolled in the VARSITY clinical trial [11]. The mean age of these patients was 40.7 years, 42% were female, and their mean body weight was 72.7 kg. The proportion of enrolled patients who were naïve to treatment with an anti-TNFα therapy was 79%.
2.3.2 Perspective, Time Horizon, and DiscountingThe cost-effectiveness model was developed to capture the effects of alternative treatment strategies from the perspective of the National Health Service in Italy. The time horizon adopted for this decision problem was the lifetime of the typical patient, which was limited to an age of 100 years. Shorter time horizons of 5 and 10 years are tested in scenario analysis as per relevant guidelines for Italy [18]. Also aligned with Italian guidelines, costs and health benefits were discounted at a rate of 3% per annum [18].
2.3.3 Treatment EfficacyInputs relating to the safety and efficacy of adalimumab and vedolizumab were taken from the VARSITY clinical trial [11]. This was a multicenter, phase 3, double-blind, double-dummy, randomized, active-controlled trial. It is one of the few trials that provides a head-to-head comparison between two advanced therapies, and it is the only study directly comparing vedolizumab and an anti-TNFα treatment. The trial had a treat-through design, and patients were assessed for clinical response and remission at weeks 14 and 52.
The proportions of patients achieving a clinical response at week 14, with or without clinical remission, are presented in Table 2. Because the standard durations of the induction phase for both treatments are < 14 weeks (8 and 4 weeks for vedolizumab and adalimumab, respectively), these data were adjusted to reflect estimates of the proportions immediately post-induction. The adjustment method used the ratio between the result at week 14 and the result at the end of the induction period based on partial Mayo scores [19]. The trial results, based on partial Mayo scores and the data in Table 2 (after adjustment), are provided in the Supplementary Appendix (Table S1).
Table 2 Key efficacy data obtained from the VARSITY clinical trial [11]The probability that a patient, having progressed to the maintenance phase, would subsequently discontinue treatment during each cycle was estimated based on data on durable response and remission from the VARSITY trial [11, 20] (Table 2). Durable clinical remission was defined as clinical remission at week 52 among subjects who were in clinical remission at week 14; durable clinical response was defined as a response among subjects with a response at week 6.
The transition probabilities from remission and from response (without remission) were derived by assuming that there would be no movement between response states during the maintenance phase. Therefore, the probability of transitioning from the remission to the active UC (\(_,\text}\)) state during the maintenance phase was the complement of the probability of durable remission. The probability of transitioning from response (without remission) to active UC (\(_,\text}\)) is calculated based on the probability of loss of the overall response (\(_,\text}\)), loss of clinical remission (\(_,\text}\)), and the proportions of patients in the remission and response (without remission) states at the end of induction (\(}_}\) and \(}_}\) respectively). These probabilities are calculated as shown in Eq. (1). A scenario analysis was performed that allowed for transitions between response states during the maintenance phase.
$$_,\text}=\frac_,\text}\left(}_}}_}\right)-}_}_,\text}}}_}}$$
(1)
2.3.4 Treatment SafetyThe VARSITY study reported the incidence of adverse events occurring before the final safety follow-up at week 68 [11]. The only adverse events captured in these analyses were those due to serious infections and infestations because of their potential to have substantial cost and health implications; this is consistent with the approach of previous economic evaluations [12, 21]. The probability of each type of infection during each 2-week model cycle is given in Table 3. Because the incidence of adverse events is not reported for any other follow-up period, the risk of adverse events is assumed to be constant, and the probabilities in Table 3 are applied during every model cycle.
Table 3 Frequency and costs of serious adverse infection and infestation events from the VARSITY clinical trial2.3.5 Third-Line Treatment InputsShould a second-line advanced therapy fail to produce an adequate response, or if a patient’s response is lost, it is expected that additional lines of advanced therapy would be attempted. There is uncertainty regarding the number and sequencing of advanced therapies that may be attempted as third-line treatments and beyond. In this cost-effectiveness model, the aim was to avoid making explicit assumptions regarding the sequencing of later lines of advanced therapy. Therefore, all third-line treatments and beyond were represented as part of a composite advanced therapy phase. The effects on the model results of omitting this composite treatment phase, and of modifying the relevant inputs, were assessed in the scenario analyses.
In the base case, the composite treatment is constructed based on the safety and efficacy of a 50:50 composition of ustekinumab and tofacitinib, two available options from different therapeutic classes. The model base case already evaluates the anti-TNFα adalimumab as either a first-line or second-line treatment, but also varies the treatment-related inputs in scenarios that aim to assess the impact of using other therapies in the anti-TNFα class. Therefore, use of an anti-TNFα therapy in the composite was not considered. The required clinical inputs for ustekinumab and tofacitinib were odds ratios, versus 8-weekly doses of 300 mg of IV vedolizumab, sourced from a published network meta-analysis [20], and the cost inputs are presented in Table 4.
Table 4 Drug acquisition and administration cost inputsThe post-induction response and remission proportions for the composite treatment were estimated as the mean of ustekinumab and tofacitinib. The transit time for a patient through a two-treatment sequence will be greater than the transit time through any individual component, so the rate of discontinuation from the composite will be lower than the rate for any individual component. In the base case, the transitions in the maintenance phase (outside of the response states) used the minimum values for either ustekinumab or tofacitinib. The rate of discontinuation from the third-line composite is highly uncertain and was investigated in a scenario analysis (Table 1, scenario 2).
2.3.6 Surgery-Related InputsThe final treatment option for patients whose UC cannot be managed with pharmacotherapy is to undergo surgery. Due to lack of Italian-specific guidance regarding surgical interventions, the health states related to surgery were based on previously developed models, in particular, the recent NICE submission for ozanimod [12]. The relevance of the surgical health states to the Italian patient pathway was confirmed during conversations with an Italian clinical expert who was external to the investigators and to Takeda [22].
The annual probability of surgery was estimated to be 1% based on Dai et al. [23]. The probability that surgery leads to complications was assumed to be 33.5% based on a 2023 UK clinical audit of inpatient care for adults with UC [24]. Following a successful colectomy, without complication, patients are at risk of developing complications at a later date; this probability was assumed to be 3.35% based on Segal et al. [25]. Patients whose surgery has led to complications are at risk of requiring a corrective procedure, with an annual probability of 5%; this was based on the opinion of the external Italian clinical expert [22].
2.3.7 MortalityThere is no evidence that patients with UC have a lower life expectancy than the general population [26]. Therefore, the risk of death in all health states except surgery states was derived from life tables for the general population of Italy [27]. Patients with UC are at an increased risk of death following a surgical intervention, and a standardized mortality ratio of 1.3 was applied to all surgery tunnel states [28]. These assumptions are consistent with previous economic evaluations reviewed during the development of this cost-effectiveness model.
2.3.8 Cost InputsAll costs are reported in 2022 euros. The unit costs for the acquisition of advanced therapies included in this evaluation were sourced from the Gazzetta Ufficiale. These prices, presented in Table 4 reflect net ex-manufacturer prices with mandatory 10% discounts applied. For adalimumab, costs for both the originator and biosimilar products are provided, and the market share used for the originator product is 11.6% [29]. The IV administration costs for those treatments using this modality were taken from Ravasio et al. [30]. Treatments administered as SC injections were assumed to require a one-off training visit, with a cost equal to that of an IV administration visit. Per-cycle costs were calculated using the doses and regimens for the advanced therapies, as presented in Table 4.
Patients receiving an advanced therapy may continue to receive concomitant corticosteroids. The mean doses of oral corticosteroids in use, at baseline and week 52, were sourced from the VARSITY study for vedolizumab and adalimumab [11]. Corticosteroids were costed as prednisone [34], and the volume of use for other advanced therapies was calculated using the data from the adalimumab arm of the VARSITY study. Following the failure of all advanced therapy options, patients are assumed to remain in the active UC state and to receive a mix of conventional therapies. The type and usage of conventional therapies were obtained from an Italian real-world evidence study [10], and unit costs were obtained from the Gazzetta Ufficiale [35].
The healthcare resource use associated with each health state was informed through discussions with the external Italian clinical expert [22]. The unit costs for each resource item were obtained from the Ministero della Salute [36], and the per-cycle health state costs are given in Table 5. The unit cost for the first surgery was €13,793, based on the cost of major interventions in the large and small intestines; the unit cost for the second surgery was €11,203, based on the cost of a rectal resection [36]. Finally, unit costs were sourced for the management of serious infection and infestation events [36]. Complete tables of these cost inputs are provided in the Supplementary Appendix (Table S2).
Table 5 Health state utility and cost inputs2.3.9 Health State UtilitiesTo align with many recent evaluations [12, 24, 37], the model used health state utilities from Woehl et al. [14] and Arseneau et al. [16] (Table 5) in the base case. Woehl gathered information on 329 UK-based patients with Crohn’s disease to estimate health state utility values. Utility values from Arseneau were generated using the time-trade off (TTO) method on responses from 48 American UC patients to a questionnaire about their health-related quality of life. On model entry, all patients are in the active UC state, which they remain in during treatment induction. The health state utilities were not adjusted as patients aged. The occurrence of serious infection or infestation events incurs a disutility of 0.156 [38]. Several alternative sets of health state utilities from other published sources were used in the scenario analyses.
2.4 Base-Case AnalysisThe base-case analysis compared the relative positioning of adalimumab or vedolizumab as either first-line or second-line advanced therapies. When first-line advanced therapy is initiated, patients are thus naïve to any anti-TNFα treatments. Therefore, the treatment efficacy inputs used the results available for this subgroup from the VARSITY clinical trial. Following exposure to adalimumab, such as for second-line vedolizumab treatment, the treatment efficacy inputs were sourced for the anti-TNFα-exposed subgroup. For treatments given after the failure of vedolizumab therapy, no changes in treatment safety or efficacy were applied. This is line with evidence that the effectiveness of anti-TNFα therapy is not substantially affected by prior vedolizumab exposure [39, 40]. The inputs related to treatment safety, disaggregated by anti-TNFα exposure subgroups, were not available. A full list of assumptions that drive the base-case analysis can be found in the Supplementary Appendix (Table S3).
2.5 Model OutcomesThe economic model captures the cost outcomes according to subcategories including advanced therapy drug, conventional therapy drug, surgery, healthcare, and adverse event management costs. Health outcomes, both in terms of life years and QALYs, were captured according to the health state in which they were accrued. Treatment sequences were compared in terms of incremental costs, incremental QALYs, and incremental cost-effectiveness ratios (ICERs). Results are presented for both the model evaluated using inputs at estimated means (deterministic model), as well as averaged over the results of a probabilistic sensitivity analysis (PSA) obtained using 10,000 resampled sets of inputs (probabilistic model). The modeled ICERs were compared with the mean ICER for approved medicines in Italy of €33,004/QALY; this threshold was derived from submissions to the Italian Medicines Agency between October 2016 and January 2021 [41].
2.6 Scenario and Sensitivity AnalysesScenario analyses were used to investigate the potential impact of key model limitations or areas of high uncertainty on the model results. Twelve separate scenarios were evaluated; they are numbered and described in Table 1. Scenarios 1 and 2 assessed alternative assumptions relating to later lines of advanced therapy after second-line treatment, which are considered to be areas of high uncertainty. Scenario 3 assessed the effect of allowing patients to move between the response and remission states during maintenance, with the lack of data to inform these transitions in the base case being an important limitation. Scenarios 4–6 used alternative sources for health state utilities. Scenarios 7 and 8 evaluated the impact of adalimumab being more effective and less costly, respectively. Scenarios 9 and 10 assessed the effect of varying the rate at which patients receive surgical intervention. Finally, scenarios 11 and 12 investigated alternative modelled time horizons.
In addition to the scenario analyses, one-way sensitivity analyses were performed to obtain model outputs when each input was varied between the upper and lower bounds. These upper and lower bounds either reflected the 95% confidence interval from the source data, where available, or the range obtained from varying the input mean by an arbitrary 25%. The PSA results were used to calculate—on the basis of parametric uncertainty—the probability of a treatment sequence being cost-effective versus a comparator sequence for a range of cost-effectiveness thresholds.
Comments (0)