
Remember me


Six unrelated patients were enrolled from different clinics across Turkiye presented with symptoms of SCBMS. A summary of the demographic and clinical characteristics of the patients is given in (Table S1). Five of the patients were females, and one was male, the minimum-maximum age of the patients was (2–16 years). All patients were born to unrelated families with consanguineous marriages. The fact that the families were from distant regions of Turkiye suggested a founder effect. All of the patients had microcephaly, mental retardation, and epilepsy, thus exhibited the hallmarks of SCBMS disease [17]. All patients except Pt3 and Pt4 were blind. All patients failed to thrive, and had recurrent infections, except for P5, all had severe infections, showing symptoms of immunodeficiency. The disease symptoms started in the first year of life for all patients. Detailed immunological workups of patients are presented in Table S2. Pt1, 2, 3, and 4 had lymphopenia. All the patients had reduced CD4+ T cell absolute counts. Additionally, Pt3 and 4 also had lower absolute numbers of CD8+ T cells. Pt1 and 4 had reduced B cell number. Pt1, 3, and 4 had reduced absolute counts of NK cell. The antibodies against mumps and measles were absent in Pts 1, 2, 3, 4 and 5.
Whole exome sequencing of six patients revealed a homozygous variant in the DIAPH1 gene c.1051 C > T; p.R351* (NM_005219.4, isoform 1) of Pts1,2,3,4,5, and the c.964 C > T, p.R322* (NM_001079812.3, isoform 2) variant in Pt6. The pedigrees of the patients are illustrated in (Fig. 1a). These nonsense mutations fall in the FH3-DID and are expected to result in early termination in translation, and potential truncate proteins devoid of critical FH1 and FH2 domains (Fig. 1b, c). The mutations were confirmed by the Sanger sequencing or next-generation sequencing. The variant was identified initially using isoform 1 for Pt1,2,3,5 (NM_005219.4) and isoform 2 for Pt6 (NM_001079812.3), which are 20 aa apart.
Fig. 1
p.R351* and p.R322* mutations reduce DIAPH1 protein and mRNA expression. (a) Pedigree of the patients. (b) Cartoon of DIAPH1 domains and the mutations identified in 6 patients (Pt) enrolled in this study. (c) The structure of DIAPH1, position of p.R351* and p.R322* mutations. (d) anti-CD3/28 activated PBMCs of healthy controls and Pt 1–6 were stained with anti-DIAPH1 and DAPI. The slides were examined by confocal microscopy at 63x magnification, and two representative pictures (Pt5 and Pt6) are shown. (e) Flow cytometric quantification of DIAPH1 protein staining in PBMC samples from Pt1and Pt2 showed significant reduction in the protein levels. Representative flow plots and quantified bar graphs are shown. Only 2°Ab indicates no primary antibody addition and is a negative control. (f) The gene expression of DIAPH1 in PBMCs was quantified by real-time qPCR, 3 technical replicates/patients (upper) and averaged graphs (bottom) were shown separately. Patient: Pt. Healthy control: HC. For p-values *: <0.05, ***<0.001, **** < 0.0001
The p.R351* and p.R322* variants have recently been listed in gnomAD (their minor allele frequencies 2.05e-6 and 3.1e-6, respectively). However, no homozygotes have been reported for these variants, and no detailed investigations or functional studies have been previously performed.
p.R351* and p.R322* Variants Resulted in Reduced DIAPH1 Protein and mRNA Message in PBMCsWe employed confocal microscopy and flow cytometry to better understand the consequences of p.R351* and p.R322* mutations for the DIAPH1 protein expression. Confocal microscopy revealed no DIAPH1 signal in 6 of the patients’ PBMCs compared to healthy controls (Fig. 1d). Similarly, flow cytometric examination of Pt1 and 2 at different times, as well as those of Pt3 and 6 simultaneously (Fig S1a), ) revealed a significant reduction in the protein levels (Fig. 1e). We conducted RT-qPCR to compare the mRNA levels of all patients, which revealed significantly lower levels of mRNA message in the patient cells relative to the control (Figs. 1f and S1b), suggesting the involvement of nonsense-mediated mRNA decay (NMD). Collectively, these data support that both DIAPH1 variants result in protein loss and reduced mRNA levels in gene expression, arguing for their pathogenic nature.
DIAPH1 Deficiency Results in Impaired T Cell Activation, Proliferation, and T Cell Receptor SignalingDIAPH1 has been previously shown to provide structural support and regulate T cell signaling pathways [4]. We investigated whether the p.R351* and p.R322* variants would cause similar defects in T cell activation, proliferation, and signaling pathways. Upon activation of T cells with various mitogens such as CD3/28 and PHA for 4 days, the proliferation of T cells was severely impaired in DIAPH1-deficient T cells (Fig. 2a, b). Additionally, the early activation markers CD25 and CD69 surface expressions were significantly reduced by DIAPH1-deficient T cells (Fig. 2c-h). The same impairments in proliferation and activation were observed when sorted CD4+ T cells were used (Fig. S1b), suggesting a T-cell intrinsic defect.
To investigate potential issues in the TCR signaling pathway, we conducted DIAPH1 knockdown experiments in the Jurkat T cell line using three different commercial shRNA constructs with a GFP reporter (Fig. S2a). The experiments showed that shRNA#3 was particularly effective in downregulating DIAPH1 protein and mRNA (Figs. S2b-c and Fig. 2i-j) and was therefore used in the subsequent experiments. We observed a decrease in the proliferation of Jurkat cells after DIAPH1 knockdown (Fig. 2k). Our examination of the TCR signaling pathway revealed impaired TCR signaling components including ZAP70 and NF-κB, after the knockdown of DIAPH1 in Jurkat cells upon stimulation with anti-CD3/28 (Fig. 2l-m and S1d, e). ERK phosphorylation in DIAPH1-deficient Jurkat T cells was normal (Fig. S2f-g).
To better probe the functional consequences of DIAPH1 deficiency in T cells, cytokine production of T cells upon anti-CD3/CD28 or PMA/Ionomycin activation was examined. DIAPH1-deficient T cells produced significantly lower levels of TNFα and IL-22 (but not IL-17 A, IL-2 and IFN-γ, although a trend was observed) (Fig. 3a). These findings are consistent with a defect in the TCR signaling pathway. In line with these findings, serum levels of TNF-α, IL-17 A, and IL-4 were significantly reduced in the patients compared with those of healthy age and sex-matched controls (Fig. 3b).
Since DIAPH1 is associated with cytoskeleton regulation, we assessed the ability of peripheral blood mononuclear cells to migrate through a trans-well chamber. Equal numbers of healthy control and patient cells were added to the FBS-free medium. The cells were then placed in 24-well plates with complete medium and FBS and cultured for 4 h to migrate to the lower wells. Our findings indicate that individuals with DIAPH1 defects exhibit lower T cell migration across the transwell (Fig. 3c).
Fig. 2
p.R351* and p.R322* variants of DIAPH1 or DIAPH1 knockdown impairs T cell activation, proliferation and T cell receptor signaling. (a) PBMCs from Pt1, 2, 3 and 6 were labeled with Tag-it-violet and activated with anti-CD3/CD28 or PHA for 4 days in complete medium, cell proliferation was measured by flow cytometry. Percentages of proliferating cells were shown as histogram plots, (b) and quantified bar graphs, three technical replicates/patient. (c-d). PBMCs from the Pt2, Pt6 and controls were stimulated in triplicate overnight with or without anti-CD3/CD28 and cells were stained with early activation markers CD25 and CD69. (e-h). Quantified graphs of CD25 and CD69 surface expression in the peripheral blood of Pt2, Pt6 and healthy controls. (e-f) Percentages and Mean Fluorescent intensity (MFI) of CD25 surface expression. (g-h) Percentages and MFI of CD69 surface expression. (i-j) Percentages and MFI of DIAPH1 post-silencing in Jurkat cell line. Jurkat cells infected by shRNA#3 or control shRNA were collected and DIAPH1 expression was analyzed by RT-PCR. (k) After DIAPH1 silencing Jurkat cells were labeled with CFSE and activated with CD3/CD28 for 3 days in complete medium. Then, the percentage of cell proliferation was quantified. (l-m). After DIAPH1 silencing, Jurkat cells were activated with anti-CD3/CD28 for 30 min in serum free medium. Then, 20 µg of secondary antibody (APC anti-mouse IgG) was added and incubated for 20 min at 37ºC and finally fixed, permeabilized and stained for pZAP70, p-NF-κBp65, and p-ERK. For p-values *<0.05, **<0.01,***<0.001, ****< 0.0001
We also noticed that PBMCs from DIAPH1-deficient patients died more frequently in the culture medium. After stimulating the cells with anti-CD3/CD28 overnight, we confirmed that DIAPH1-deficient cells died more frequently and stained more with Annexin V and 7-AAD (Fig. S3a).
All these data collectively suggest that T cells with the homozygous p.R351* and p.R322* DIAPH1 variants have multiple defects in T cell proliferation, activation, survival, and migration as well as partial defects in the TCR signaling pathway. Additionally, T cells have limited cytokine production capabilities.
DIAPH1 Deficiency Results in Impaired Treg Cell Expansion, and Impaired STAT5 PhosphorylationAs previously mentioned, cytoskeletonopathies can result in defects in CD4+ T cell subsets. as shown by Treg [22,23,24,25,26,27,28,29,30] and Th17 [31, 32] cell defects in DOCK8, CDC42 and WASP deficiencies Thus, we investigated whether DIAPH1 deficiency had an impact on regulatory T cells. Our findings revealed a significantly elevated percentage of FOXP3+ Treg cells in the peripheral blood of DIAPH1-deficient patients compared with healthy controls (Fig. 3d). However, the absolute numbers of Treg cells were normal due to a decrease in the patients’ CD3+ T, and CD4 + T cell absolute counts (Fig. 3d). Importantly, in vitro polarization of naive T cell into Treg lineage revealed that DIAPH1-deficient T cells could generate only a very small absolute number of regulatory T cells. However, the percentages of Treg cells were not dramatically low (Fig. 3e, f). These results suggest that conversion to regulatory T cells from naïve CD4+ T cells probably is affected in vitro more so than in vivo, and that the expansion of Treg cells is negatively affected by DIAPH1 deficiency.
Fig. 3
Impaired cytokine production by DIAPH1-deficient T cells, and impaired Treg cell expansion (a-c). DIAPH1-deficieny does not affect the differentiation of naïve CD4+ T cells into Treg cells, but negatively impacts expansion of Treg cells (d-f). (a) PBMCs from Pt2, Pt6 and healthy controls were stimulated with anti-CD3/28 or PMA/ionomycin and Golgi Stop for 4 h and percentage of IL-17, IL-22, IL-2, TNFα and IFN-γ cytokines production were quantified. (b) The levels of IL-17, TNFα and IL-4 in the serum of healthy controls and DIAPH1 patients were measured by ELISA. (c) Transwell migration of equal numbers of healthy control and Pt1/Pt2 lymphocytes into the medium with FBS was tested after 4–5 h. and quantified absolute number (d) The frequency of FOXP3+ cells among CD4+, or their absolute numbers in PMBCs of DIAPH1 patients and healthy controls was shown (5 patients, with 2–3 technical replicates). (e-f) Naive CD4+ T cells from Pt1/Pt2 and healthy controls were selected magnetically, polarized into Treg cells ex vivo and FOXP3 staining was performed. (e) representative flow plot. (f) Absolute number and the percentages of FOXP3+ cells in cultures. (g) Total CD4+ T cells from Pt2/Pt3 and healthy controls were selected magnetically, polarized into Treg cells ex vivo and Ki67, ANNEXINV, and FOXP3 staining was performed on day 5. For p-values *<0.05, **<0.01, ****< 0.0001
STAT5 plays a critical role in the expansion and survival of conventional T cells and Treg cells owing to its functions downstream of IL-2 receptor. To test whether DIAPH1-deficiency impacts STAT5 phosphorylation in response to IL-2 ligation, primary T cells from DIAPH1-deficient patients and healthy donors were activated with IL-2, and those experiments revealed a diminished IL-2-dependent STAT5 phosphorylation (Figs. 4a, b and S3b). Moreover, both IL-7 and IL-15-dependent STAT5 phosphorylation were markedly reduced (Fig. 4a, b). The defect in STAT5 phosphorylation was also observed in samples of Pt2 and Pt6 with the p.R351* and p.R322* mutations, respectively. However, we did not observe any significant reduction in STAT3 (perhaps even an elevation was observed) and STAT4 phosphorylation in response to IL-6 and IL-12, respectively (Figs. 4a, b and S3c).
To ensure that defective STAT5 phosphorylation is due to DIAPH1 but not an overlooked gene defect, we repeated the experiments using DIAPH1-silenced Jurkat T and primary T cells. Our findings confirmed a decrease in STAT5 phosphorylation when DIAPH1-silenced Jurkat cells with shRNA were activated with IL-2 (Fig. 4c). Due to low expression of CD25 by Jurkat cells, we activated them with PHA following transfection with shRNA in order to increase the surface expression of CD25 and rested them for 2 h in serum-free media. Similarly, STAT5 phosphorylation was also reduced in the DIAPH-silenced Jurkat cells compared with scrambled shRNA, suggesting DIAPH1-mediated regulation of the IL-2/STAT5 axis (Fig. 4d). Of note, CD25 surface expression was significantly lower on the cell surface of Jurkat cells after DIAPH1 knockdown, which may partly explain reduced STAT5 phosphorylation in response to IL-2 (Fig. 4e). However, we could not observe a significant difference in IL-2-mediated STAT5 phosphorylation in primary T cells which may be due to lower knockdown efficiency or compensatory mechanisms (Fig. S3d). Collectively these results support a role for DIAPH1 in IL-2, IL-7 and IL-15-mediated STAT5 phosphorylation. The deficiency of these three signaling pathways may thus partly explain not only the Treg cell expansion, but also the non-Treg T cell activation and proliferation defects.
The Proteomic Analyses of DIAPH1 Deficient CD4+ T CellsTo have a better understanding of T cell defects associated with DIAPH1 deficiency, differential protein expression among 1694 proteins commonly expressed by both HCs and DIAPH1-deficient patients was analyzed using label-free quantitation. All the results, including a comprehensive list of protein identifications can be located in supplemental Table S3. After data processing and normalization, 233 differentially expressed proteins (DEPs) (P < 0.01, log2 fold change (FC) > 1 or < -1), including 91 upregulated DEPs and 142 downregulated DEPs, were identified (Table S4). Upregulated and downregulated proteins were visualized in the volcano plot and heat maps (Fig. 5a, b). Consistent with defects in T cell signaling, ZAP70, LCK, CD4, TRAF3IP3, SH3BP1, DGKA, and FKBP4 proteins were downregulated in DIAPH1-deficient CD4+ T cells. Importantly, the proteins unique to each group most likely represent missed protein assignments because of their low expression levels. Some proteins were below detection range in the patient samples which included DIAPH1, CD3e, CD5, and some MAP kinases consistent with reduced protein levels in DIAPH1 and impaired TCR signaling (Fig. 5c). Additionally, differentially regulated proteins were subjected to annotation based on Gene Ontology (GO) processes. In both upregulated (Fig. 5d) and downregulated (Fig. 5e), gene list enriched processes were visualized by bubble chart and revealed several immune processes including T cell activation, migration, differentiation, chemotaxis as well as microtubule and actin organization. Collectively, these results mark the critical roles played by DIAPH1 protein in CD4+ T cell biology and function and support the various abovementioned experimental evidence, which revealed major defects in T cells.
Fig. 4
Impaired IL-2/IL-7/IL-15-dependent STAT5 phosphorylation in DIAPH1-deficient patient PBMCs and IL-2/STAT5 axis DIAPH1-silenced Jurkat T cells. (a-b) PBMCs from Pt1, 2, 6 and healthy control were rested for 2 h in the serum-free media, then stimulated with IL-2, IL-7, and IL-15 for p-STAT5, IL-6 for p-STAT3 and IL12 for pSTAT4 20 min. Then, fixed, permeabilized, and stained. (a) a representative flow chart and percentage and percentage bar chart for each condition for Pt1 and 2 were shown, four technical replicates run. (b) Percent phosphorylation chart for each condition was shown for Pt6, with 4 replicates. (c) After DIAPH1 silencing in Jurkat T cells for 48 h, cells were stimulated with IL-2 for p-STAT5 20 min at 37 °C. Stimulated cells fixed, permeabilized and stained for p-STAT5. Percentage and MFI bar chart are shown. (d) After DIAPH1 silencing in Jurkat T cells for 24 h, PHA was added for 24 h, cells were rested 2 h, and stimulated with IL-2 for p-STAT5 20 min at 37 °C. Stimulated cells fixed, permeabilized and stained for p-STAT5. Percentage and MFI bar chart are shown. (e) Forty-eight hours after DIAPH1 silencing in Jurkat T cells CD25 expression was quantified by MFI via surface staining and flow cytometry. For p-values *<0.05, **<0.01,***<0.001, ****< 0.0001
DIAPH1 Deficiency Results in Numeric Reduction in Innate Lymphoid Cells and Functional Defects in Cytotoxic NK CellsRecently, we have reported numeric and functional defects in innate lymphoid cells in another actinopathy associated with DOCK8 deficiency [33]. Thus, we examined different subsets of helper ILCs (ILC1, ILC2, ILC3) and the cytotoxic NK activity in the PBMCs obtained from DIAPH1-deficient patients and healthy controls. The gating strategy for ILCs is given in Fig. 6a. All subsets of helper ILCs were dramatically reduced in the peripheral blood of all four patients tested (Fig. 6b, c). Both the frequency of ILC3 among all helper ILCs and their absolute numbers were reduced indicating a major negative impact of DIAPH1 deficiency on ILC3s (or ILC precursors). Additionally, helper ILC1 and ILC2 numbers are significantly reduced as well, consistent with a major reduction in the ILC3 quadrant which is also shown to contain precursors ILCs by others [34]. These findings argue that at least in some actinopathies, ILCs are negatively impacted underlining the importance of those genes in the maintenance/generation/function of these cells.
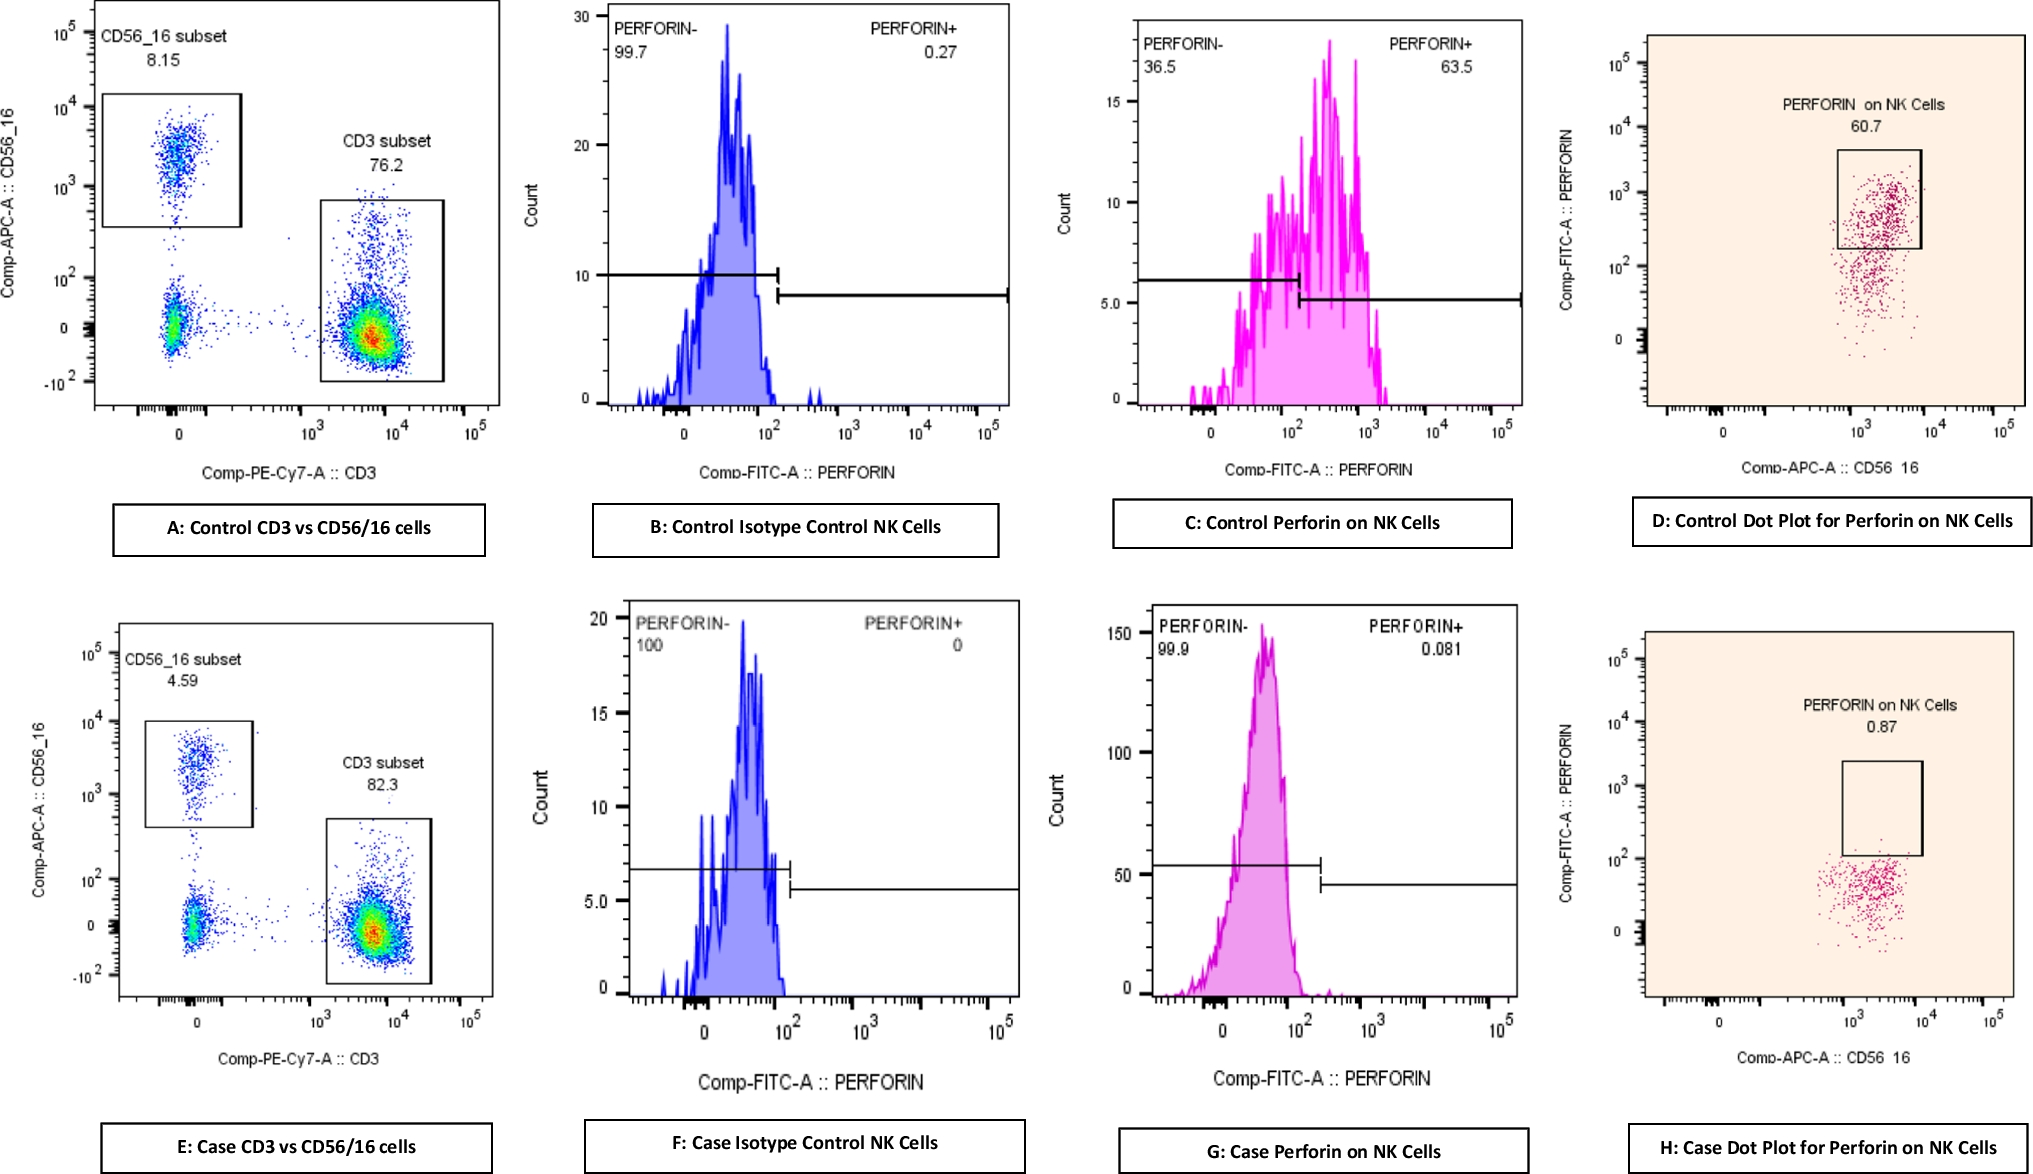
Lastly, we assessed the cytotoxic ability of PBMCs obtained from the Pt1, 2, 4, and 6 (Figs. 6d and S4a). Only Pt1 had low (compared to reference values (5–20%) NK cell percentage in PBMCs among six patients (Table S2). We used labeled-K562 cells as targets, and measured apoptosis on the target cells induced by equal number of patient derived PBMCs. These assays revealed reduced cytotoxic activity of DIAPH1-deficient PBMCs, suggesting a functional defect in NK cell cytotoxicity function. Since NK cells are not sorted, the reduction may also be attributed to a decrease in NK cell numbers in the peripheral blood. Therefore, we also measured NK cell surface activation markers CD69, KLRG1, NKp44, as well as granzyme B, IFN-γ and TNF-α among PBMCs cultured with or without K562 cells by gating on CD56+ or CD94+ NK cells (from Pt2) (Fig. S4b). These experiments revealed statistically significantly reduced CD69, NKp44 surface and Granzyme B and IFN-γ production by DIAPH1-deficient NK cells, collectively arguing for an impaired NK cell function in the absence of functional cellular DIAPH1. To definitively confirm that defects in NK cells are due to functional impairment not reduction in number, we sort purified NK cells via Miltenyi Microbeads and repeated the cytotoxicity experiments, which revealed reduced target killing (Fig. S5a). Importantly, impaired IL-2/STAT5 axis was also detectable in DIAPH1-deficient NK cells (Fig. S5b). In line with this, cultured pure NK cells (in the presence of IL-15), had slightly but significantly higher apoptosis, and reduced CD25 surface expression (Fig. S5c-e). Pt2’s NK cells were also biased in favor of CD56high population, and perforin protein expression was reduced in both the CD56high and CD56int NK cells, whereas Granzyme B+ cells was only reduced in frequency in CD56high subset (Fig. S5f-h). Altogether these data support the presence of qualitative and quantitative defects in helper ILCs and cytotoxic NK cells in human DIAPH1 deficiency.
Fig. 5
DIAPH1 deficiency alters intracellular proteome of anti-CD3/28 activated patient CD4 + T cells. (a) Volcano plot of differentially expressed proteins in DIAPH1-deficient patient CD4+ T cells (P < 0.01, log2 fold change (FC) > 1 or < -1) (b) Heatmap depicting the upregulated and downregulated proteins in DIAPH1-deficient patient CD4+ T cells. Due to size limitations, the names of specific proteins are listed directly in the figure. (c) select proteins which were not detected in DIAPH1 deficient CD4+ T cells (but present in those of the HC (d) Bubble chart of upregulated and (e) downregulated cellular processes in DIAPH1 deficient CD4+ T cells. 3 patients and 3 HC samples were used
Fig. 6
Reduced numbers of peripheral blood ILC subsets and impaired NK cell cytotoxic activity in DIAPH1-deficient patients. (a) Gating strategy for ILCs, representative plots for healthy controls (HC) and patients (Pt) PBMC. Total ILCs were gated as Lineage negative (TCRαβ-, TCRγδ-, CD34-, CD123-, CD94-, CD14-, BDCA2-, FcεRIα-, CD1a-, CD11c-, CD19-, B220-) CD3-CD161+ CD127+ Lin- cells, ILC3s as cKit + CRTH2- CD127 + CD161+ Lin-, ILC2s as CRTH2+ CD127+ CD161+ Lin- and ILC1s as cKit- CRTH2- CD127+ CD161 + Lin-. (b) Percentage of total or subsets of ILCs in the peripheral blood of Pts and HCs. The samples from four Pts and four HCs were shown. (c) Absolute number of total or subsets of ILCs in the peripheral blood of Pts and HCs per mL of peripheral blood. (d) PBMCs from HCs and Pt1, 2, 4, and 6 were cocultured with labeled K562 cells as targets at 37 °C for 4 h. Target to effector ratio (T: E) was 1:25 or 1:50. The death in target cells stained with ANNEXIN V and 7-AAD was quantified. The error bars show +/- SEM. For p-values *<0.05, **<0.01,***<0.001, ****< 0.0001
Comments (0)