An important innovation of this study is the application of deep learning techniques to assist in the diagnosis of depression, particularly in handling non-invasive biomarkers. Our findings highlight the value of tongue feature analysis in the diagnosis of mental disorders, providing new perspectives and methods for the auxiliary diagnosis and treatment efficacy assessment of subthreshold depression and laying a solid foundation for further research.
Despite the promising results of this study, the implementation of deep learning models in actual clinical settings still faces technical and operational challenges. Key factors that need to be addressed include the integration of the model into existing clinical workflows, training of medical staff, and secure management of patient privacy data. Ideally, researchers would use the model to replicate the diagnostic process as closely as possible to determine diagnostic status. However, this is not always feasible due to resource constraints, including the need for trained personnel. Future studies should consider these practical issues and design models that are easier to apply in clinical environments.
Currently, research on the identification of tongue image features has made some progress, with multiple studies confirming their association with certain health conditions. However, their application in the diagnosis of depression is still in its infancy. Traditional image processing techniques, limited by high computational complexity and lengthy analysis time, cannot fully meet the clinical needs. The emergence of deep learning techniques has brought a breakthrough in medical image analysis (1, 2). Particularly in image recognition and classification tasks, deep learning algorithms have demonstrated superior performance beyond traditional methods. Despite successful applications in other medical imaging domains, research on their usage in identifying tongue image features is relatively scarce (3, 4).
Deep learning algorithms, especially Convolutional Neural Networks (CNN), have become a research hotspot in image recognition due to their powerful feature extraction capabilities (5–7). These five models, DenseNet169, MobileNetV3Small, SEResNet101, SqueezeNet, and VGG19_bn, have shown excellent recognition and classification abilities in various fields with their unique network architectures and optimization algorithms. By learning a large amount of image data, they can capture subtle changes in tongue images that are difficult to achieve with traditional methods (8). Therefore, exploring the application of these deep learning models for identifying tongue image features is of great significance in improving the accuracy and efficiency of depression diagnosis (3, 4).
However, applying deep learning techniques to the field of auxiliary diagnosis of depression faces challenges such as data diversity, model generalization capability, and interpretability (9, 10). The diverse tongue image features of depression patients pose a key research question of ensuring the model’s recognition performance across different individuals (11–13). Furthermore, the medical field demands high interpretability from models, necessitating not only excellent performance but also providing explainable evidence in their decision-making process (14, 15). This study aims to fill the current research gap and address some of these challenges (16).
The objective of this study is to compare and analyze the performance of five different deep learning models in identifying tongue image features of subthreshold depressed patients, determine the optimal model, and further explore the association between the predictive scores of the model and the effectiveness of acupuncture treatment. We chose the SEResNet101 model, which incorporates attention mechanisms and deep residual networks, achieving an impressive recognition accuracy of 98.5% and an F1 score of 0.97. Moreover, it exhibited a significant positive correlation of 0.72 with the effectiveness of acupuncture treatment in practical applications. This finding not only provides a new tool for the auxiliary diagnosis of subthreshold depression but also offers an objective evaluation method for non-pharmacological treatments such as acupuncture. The results of this study are expected to drive the development of personalized medicine, providing support for precision healthcare, while also opening up new avenues for the application of deep learning techniques in the medical field.
2 Materials and methods2.1 Ethical statementThis study was conducted in accordance with the ethical standards of the Helsinki Declaration. The study was approved by the ethics committee of the Shenzhen Bao’an Authentic TCM Therapy Hospital. Written informed consent was obtained from all individual participants included in the study.
2.2 Study design and participantsData Collection: Two groups of subjects were recruited from the acupuncture outpatient department of Shenzhen Bao’an Authentic TCM Therapy Hospital in Shenzhen: 100 healthy individuals and 120 patients diagnosed with subthreshold depression (17). Before the experiment, patients underwent detailed medical history interviews and physical examinations to ensure they met the selection criteria for the study. A comparison of general clinical data between the two groups is presented in Table 1.
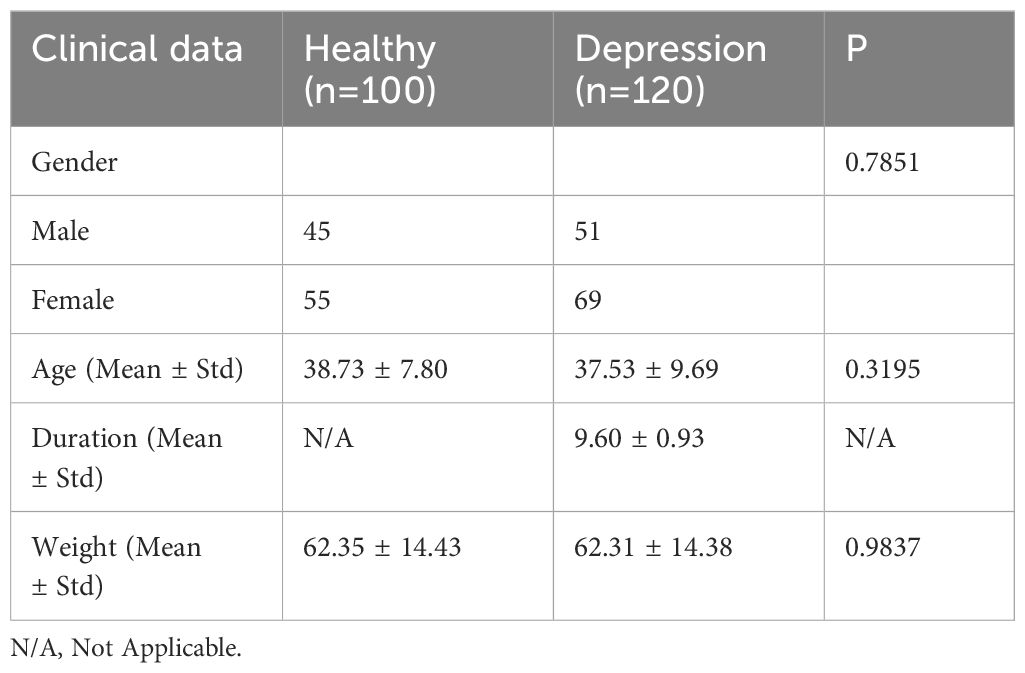
Table 1 Comparative analysis of general clinical data.
2.3 Diagnosis criteriaCriteria for Subthreshold Depression Diagnosis: Subthreshold depression refers to patients showing significant depressive symptoms in clinical settings but not reaching the severity level of a formal diagnosis of depression. In this study, the criteria for diagnosing subthreshold depression was based on internationally recognized criteria for depressive symptoms (DSM-5). Generally, the main diagnostic criteria for subthreshold depression include the following points: the presence of depressive mood, such as feeling down, loss of interest, or decreased sense of happiness; relatively short duration of depressive symptoms, typically less than 2 weeks; depressive symptoms having some impact on daily life and social functioning for the individual, but not severe enough to require antidepressant treatment.
Inclusion Criteria for Subthreshold Depression: To ensure the accuracy and consistency of the study, the researchers include subthreshold depression patients who meet the following criteria: age range, for example, patients between 18 and 65 years old; meeting the criteria for a subthreshold depression diagnosis as previously mentioned; no acupuncture treatment received: participants have not received any acupuncture treatment before the study to avoid treatment influences on the research results (18–20).
Threshold Exclusion Criteria for Depression: In order to eliminate potential confounding factors that could influence the research results, the researchers exclude subthreshold depressed patients who are not suitable for participation in the study based on the following criteria: severe physical illness - individuals with significant organic diseases or other severe physical illnesses were excluded to avoid interference with the research results caused by these illnesses; other psychiatric disorders - individuals with other mental disorders such as schizophrenia or bipolar disorder were excluded; non-depressive symptoms - individuals whose symptoms do not meet the diagnostic criteria for subthreshold depression were excluded; lack of informed consent - individuals must be willing to participate in the study and provide informed consent (21).
Inclusion Criteria for the Control Group: In order to compare the differences between subthreshold depressed patients and the healthy population, the researchers include a group of healthy individuals as the control group. The inclusion criteria for the healthy population typically include the following points: age range - for example, between 18 and 65 years old; absence of depressive symptoms - ensuring that the healthy population does not have symptoms of depression or any other psychiatric disorders; no prior acupuncture treatment - the healthy population has not received acupuncture treatment prior to the study (22, 23).
2.4 Depression scalesPrior to acupuncture treatment, standardized depression scales such as the Hamilton Depression Rating Scale (HDRS) were used to assess the severity of depression in patients. The total score on the HDRS is calculated by summing up the scores of each item, typically ranging from 0 to 52 points. The interpretation of the total score is as follows: 0-7 points: no depression or within the normal range; 8-16 points: mild depression; 17-23 points: moderate depression; 24 points and above: severe depression (Table 2) (24, 25).

Table 2 The scores of two groups on the HDRS factors.
2.5 Grouping and treatment methods for subthreshold depressed patientsThe 120 enrolled subthreshold depressed patients were randomly divided into two groups using a random number table method: the control group and the acupuncture treatment group, with 60 patients in each group. For the acupuncture treatment group, acupuncture points were selected based on previous research conducted by the team. The chosen acupuncture points were Baihui (GV20), Yintang (GV29), Hegu (LI4), and Taichong (LR3). The acupuncture needles used were stainless steel needles with a diameter of φ0.30mm and a length of 25mm (1 inch), provided by Suzhou Huatuo Acupuncture Instrument Co., Ltd. The procedure involved the patients lying in a supine position, disinfecting the selected acupuncture points, and quickly inserting the needles into Baihui, Yintang, Hegu, and Taichong vertically. After removing the guide tube, the needle was inserted diagonally backward for Baihui and towards the tip of the nose for Yintang, at an angle of 30 degrees. The depth of insertion for both points was 0.5 inches, with the needles rotated gently three times. The sensation of localized soreness and distension was used as an indicator. The needles were inserted directly into Hegu and Taichong to a depth of 0.5 inches, with the same gentle rotations. The needles were retained for 30 minutes during each session, with two interventions per week for a total of four weeks.
In the control group, the treatment frequency, treatment cycle, and acupuncture points selection were the same as those in the acupuncture group. PSD acupuncture needles and retractable blunt needles were chosen for the procedure. The patients were positioned in a supine position, and the acupuncture points were routinely disinfected. The blunt needles were inserted, with the needle head exposed outside the skin, and lightly fixed by the practitioner’s right hand. The index finger was then used to tap the needle end, mimicking the insertion of a needle. Since the needle head was blunt and the needle end was hollow, the blunt needle would not penetrate the skin. The retention time, removal of the needle, and treatment course were the same as those in the acupuncture group.
2.6 BlindingDue to the nature of acupuncture treatment, blinding of the acupuncturists during the treatment process was not feasible. However, blinding was implemented for the study participants and other researchers, including data analysts and outcome assessors. To ensure blinding, participants were prohibited from communicating with each other during the treatment period, and treatment was conducted using isolated treatment beds to prevent patients from witnessing others’ treatment. In subsequent data analysis, the control group and acupuncture treatment group were defined as Group A and Group B, respectively.
2.7 Image acquisition and processingIn this study, researchers utilized professional high-resolution digital cameras to capture tongue images (26–28). During the image acquisition process, emphasis was placed on oral hygiene, complete exposure of the tongue, standardized tongue color, and multi-angle capturing (29). After the acquisition, image preprocessing was conducted to ensure image quality and standardization, which included denoising, enhancement, and size adjustment (30–32). Preprocessing of the collected tongue images encompassed denoising, image enhancement, and size adjustment operations to ensure the accuracy and stability of subsequent neural network models (33).
2.8 Data evaluation and selectionExpert Evaluation and Classification: To ensure the quality and accuracy of tongue images, the research team invited ten traditional Chinese medicine experts with normal vision and color perception to participate in the process of image evaluation, screening, and classification (34, 35). These experts possessed extensive clinical experience and specialized knowledge in traditional Chinese medicine diagnosis and tongue examination (36). Initially, the researchers provided the experts with the collected tongue images, along with corresponding medical records, for a comprehensive understanding of each subject. Subsequently, the experts independently conducted image evaluation and classification (37). They carefully observed and analyzed acupuncture points and tongue images in line with traditional Chinese medicine diagnostic criteria and experience, aiming to identify characteristics of subthreshold depression patients and determine if they met inclusion criteria (38–40).
In cases of inconsistent diagnostic results during the evaluation process, the research team organized expert meetings to facilitate discussions and reach a consensus (41, 42). Images with inconclusive diagnoses were excluded from the dataset to ensure their quality and accuracy (43, 44). Finally, based on the evaluations of the experts, the research team constructed a dataset suitable for training and testing, containing tongue images and the consistent diagnostic results provided by the experts.
Dataset Construction: A dataset suitable for training and testing was constructed based on the evaluations of traditional Chinese medicine experts, including tongue images and corresponding labels (45).
Dataset Split: The constructed dataset was randomly divided into training, validation, and testing sets with an 8:1:1 ratio, facilitating model training, fine-tuning, and evaluation (46–48).
2.9 Five deep learning algorithm modelsDenseNet169 Model: DenseNet (Densely Connected Convolutional Networks) is a convolutional network with dense connections (34, 49). In this network, each layer is directly connected to all previous layers, allowing for feature reuse and improved efficiency with fewer parameters (50–52). DenseNet169 is one variant with 169 layers deep. Compared to traditional convolutional networks, DenseNet reduces overfitting risks and model complexity through feature reuse (53–55). This model is particularly suitable for image recognition tasks, such as extracting tongue image features in medical image analysis (45, 56).
MobileNetV3Small Model: MobileNetV3 is a lightweight deep learning model optimized for mobile and embedded vision applications (57, 58). It leverages hardware-aware network structure search (NAS) and the NetAdapt algorithm to optimize network architecture, significantly reducing computational requirements and model size while maintaining accuracy. MobileNetV3Small is a smaller, more efficient version of MobileNetV3 achieved through pruning and other optimization techniques, reducing parameter count and computational costs (59). This model is suitable for real-time image processing tasks in resource-constrained environments, such as tongue image analysis on mobile devices (60).
SEResNet101 Model: SENet (Squeeze-and-Excitation Networks) introduces a new structural unit called the SE block, which enhances network representational power by explicitly modeling interdependencies among channels. SEResNet101 results from integrating SE blocks into the ResNet101 network. ResNet101 is a residual network with 101 layers, addressing the gradient vanishing problem in deep networks through residual connections (61–63). In SEResNet101, the SE block further allows dynamic recalibration of inter-channel feature responses, enhancing feature extraction, which is particularly useful in analyzing tongue image features with subtle differences.
SqueezeNet Model: SqueezeNet is a highly computationally efficient CNN. It reduces model size and computational costs by minimizing the number of parameters while maintaining comparable accuracy to larger models (64). SqueezeNet employs building blocks called “Fire” modules, which consist of a squeeze layer and an expanded layer (64, 65). This model is particularly efficient in image processing, especially in cases with limited computational resources, making it suitable for extracting tongue image features on embedded systems or mobile devices.
VGG19_bn Model: VGG19_bn is a variant of the VGG19 model, including batch normalization (Batch Normalization) (66). Batch normalization accelerates the training process and improves the stability and performance of the model (67–69). VGG19_bn consists of a 19-layer deep convolutional network that follows a strategy of repetitively using small 3×3 convolutional kernels. Compared to the original VGG19, VGG19_bn improves robustness to variations in input data distribution by adding batch normalization after each convolutional layer (66). This model is suitable for large-scale image recognition tasks and, due to its depth and performance, particularly applicable to complex image features, such as extracting tongue image features.
2.10 Model evaluation and results analysisModel Training and Testing: Five algorithm models were trained using the training set and tested on the test set to obtain the classification results of tongue images (70).
Evaluation metrics including accuracy, recall, precision, and F1-score were used to evaluate the performance of the five algorithm models in the multi-class classification of tongue images (71). Based on the results of the evaluation metrics, a comprehensive analysis and comparison of the performance of the five algorithm models were conducted to explore the potential application of deep learning techniques in the treatment of depressed patients under the acupuncture threshold (72, 73).
2.11 Statistical analysisDescriptive Statistical Analysis: Descriptive statistics, such as mean, standard deviation, median, maximum, and minimum values, were used to understand the basic characteristics and distribution of the collected data.
Correlation Analysis: The correlation between acupoint infrared images, tongue images, and the depression questionnaire scores of patients was analyzed by calculating the correlation coefficients (e.g., Pearson correlation coefficient or Spearman rank correlation coefficient) to investigate the existence of correlations (74–76).
Random Group Analysis: Patients were divided into different acupuncture treatment groups and control groups using random group allocation. Differences between different groups, such as the difference in depression questionnaire scores before and after acupuncture, were compared using t-tests or analysis of variance (ANOVA) (77, 78).
Performance Evaluation of Deep Learning Models: The performance of the constructed five algorithm models was evaluated by calculating metrics such as accuracy, recall, precision, and F1-score to assess the classification performance of the models (79–81).
ROC Curve Analysis: Receiver Operating Characteristic (ROC) curves were plotted, and the area under the curve (AUC) was calculated to evaluate the classification accuracy and sensitivity of the five algorithm models in tongue image classification (82–84).
Classifier Comparison: The performance of different classification algorithms (e.g., SVM, KNN) was compared with the five algorithm models in image classification tasks to assess their effectiveness in diagnosing depressed patients under the threshold (85, 86).
Cross-Validation: Cross-validation was used to verify the stability and generalization ability of the five algorithm models by dividing the dataset into multiple subsets for multiple rounds of training and testing (87, 88).
3 Results3.1 Performance analysis of the Densenet169 model in recognizing tongue image features of subthreshold depressed patientsThe Densenet169 model has demonstrated excellent performance in recognizing tongue image features of subthreshold depressed patients. As shown in Figure 1, the classification accuracy on the test set reached 93.2%, indicating a high recognition ability. Among the samples predicted as a positive class, the Densenet169 model correctly identified 88% of the actual positive samples (precision), while among the actual positive samples, the model accurately predicted 84% of the positive samples (recall). The harmonic mean of these two metrics, the F1 score, was 0.86, indicating a good balance between precision and sensitivity. This performance metric is particularly important as it ensures that the model neither misses genuine cases nor reports excessive misdiagnoses.
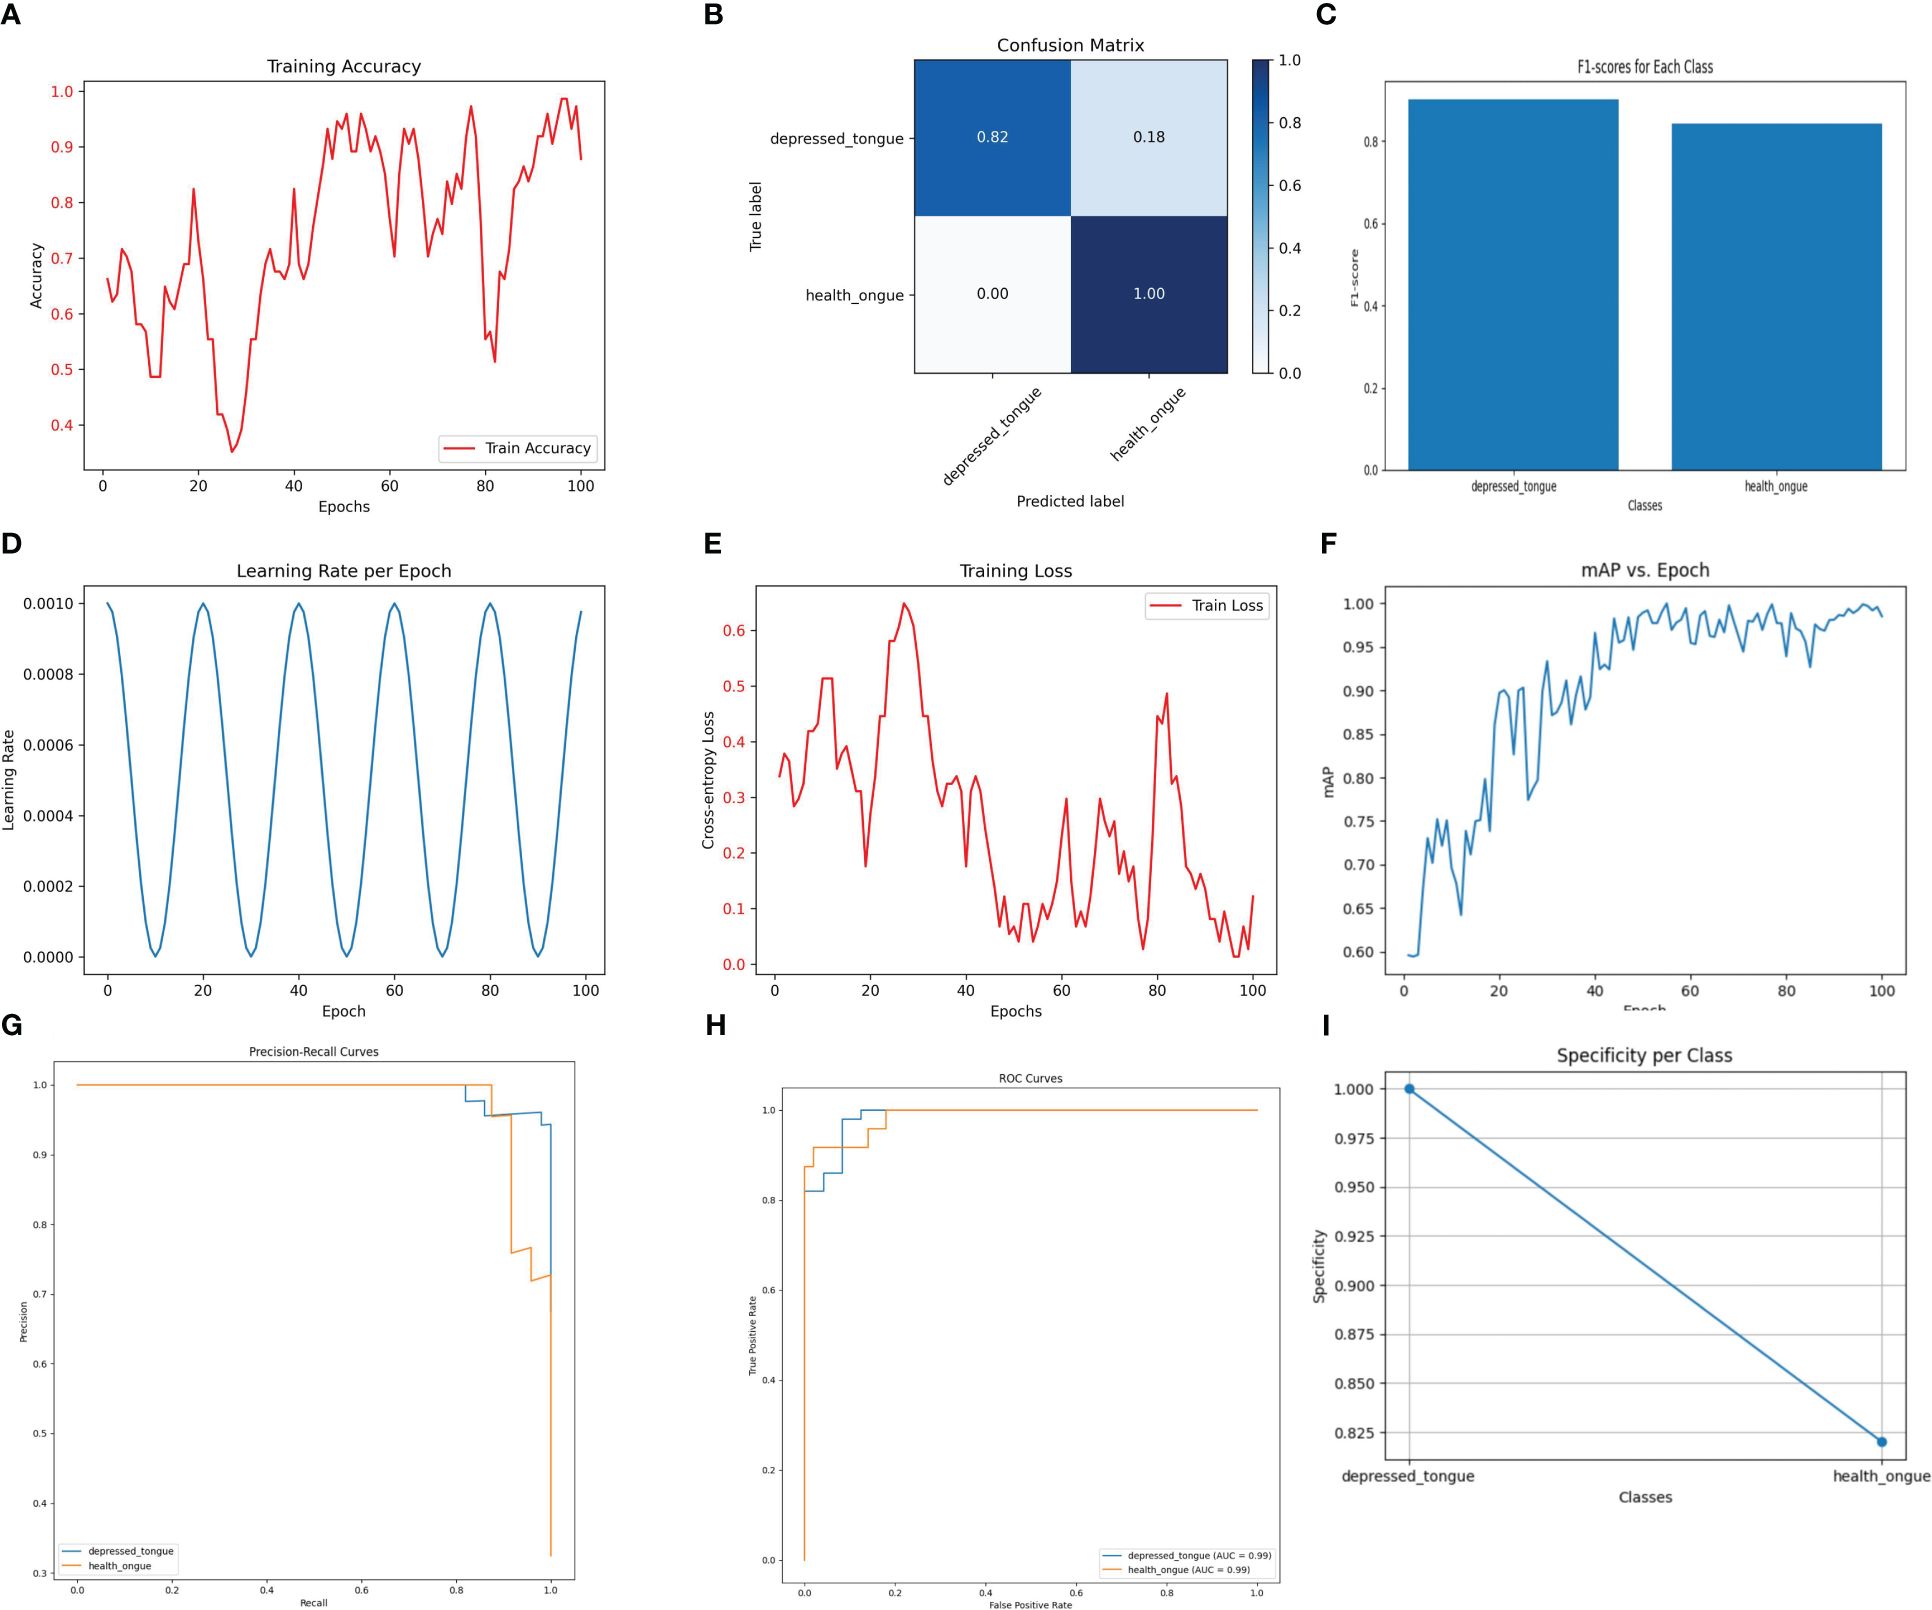
Figure 1 The performance of the DenseNet169 model. (A) Training Accuracy; (B) Confusion Matrix; (C) F1 Scores; (D) Learning Rate; (E) Training Loss; (F) Mean Average Precision (mAP); (G) Precision-Recall Curve; (H) ROC Curve; (I) Specificity for Each Class.
3.2 Performance analysis of the MobileNetV3Small model in recognizing tongue image features in subthreshold depressed patientsDespite being a lightweight model designed to operate in resource-constrained environments, MobileNetV3Small performed satisfactorily in the recognition of tongue image features. As depicted in Figure 2, the model achieved an accuracy of 94.1% on the test dataset, demonstrating its practicality in tongue image analysis. The precision and recall of the model were 0.88 and 0.90, respectively, with an F1 score of 0.89, indicating its effectiveness in ensuring diagnostic accuracy while maintaining simplicity.
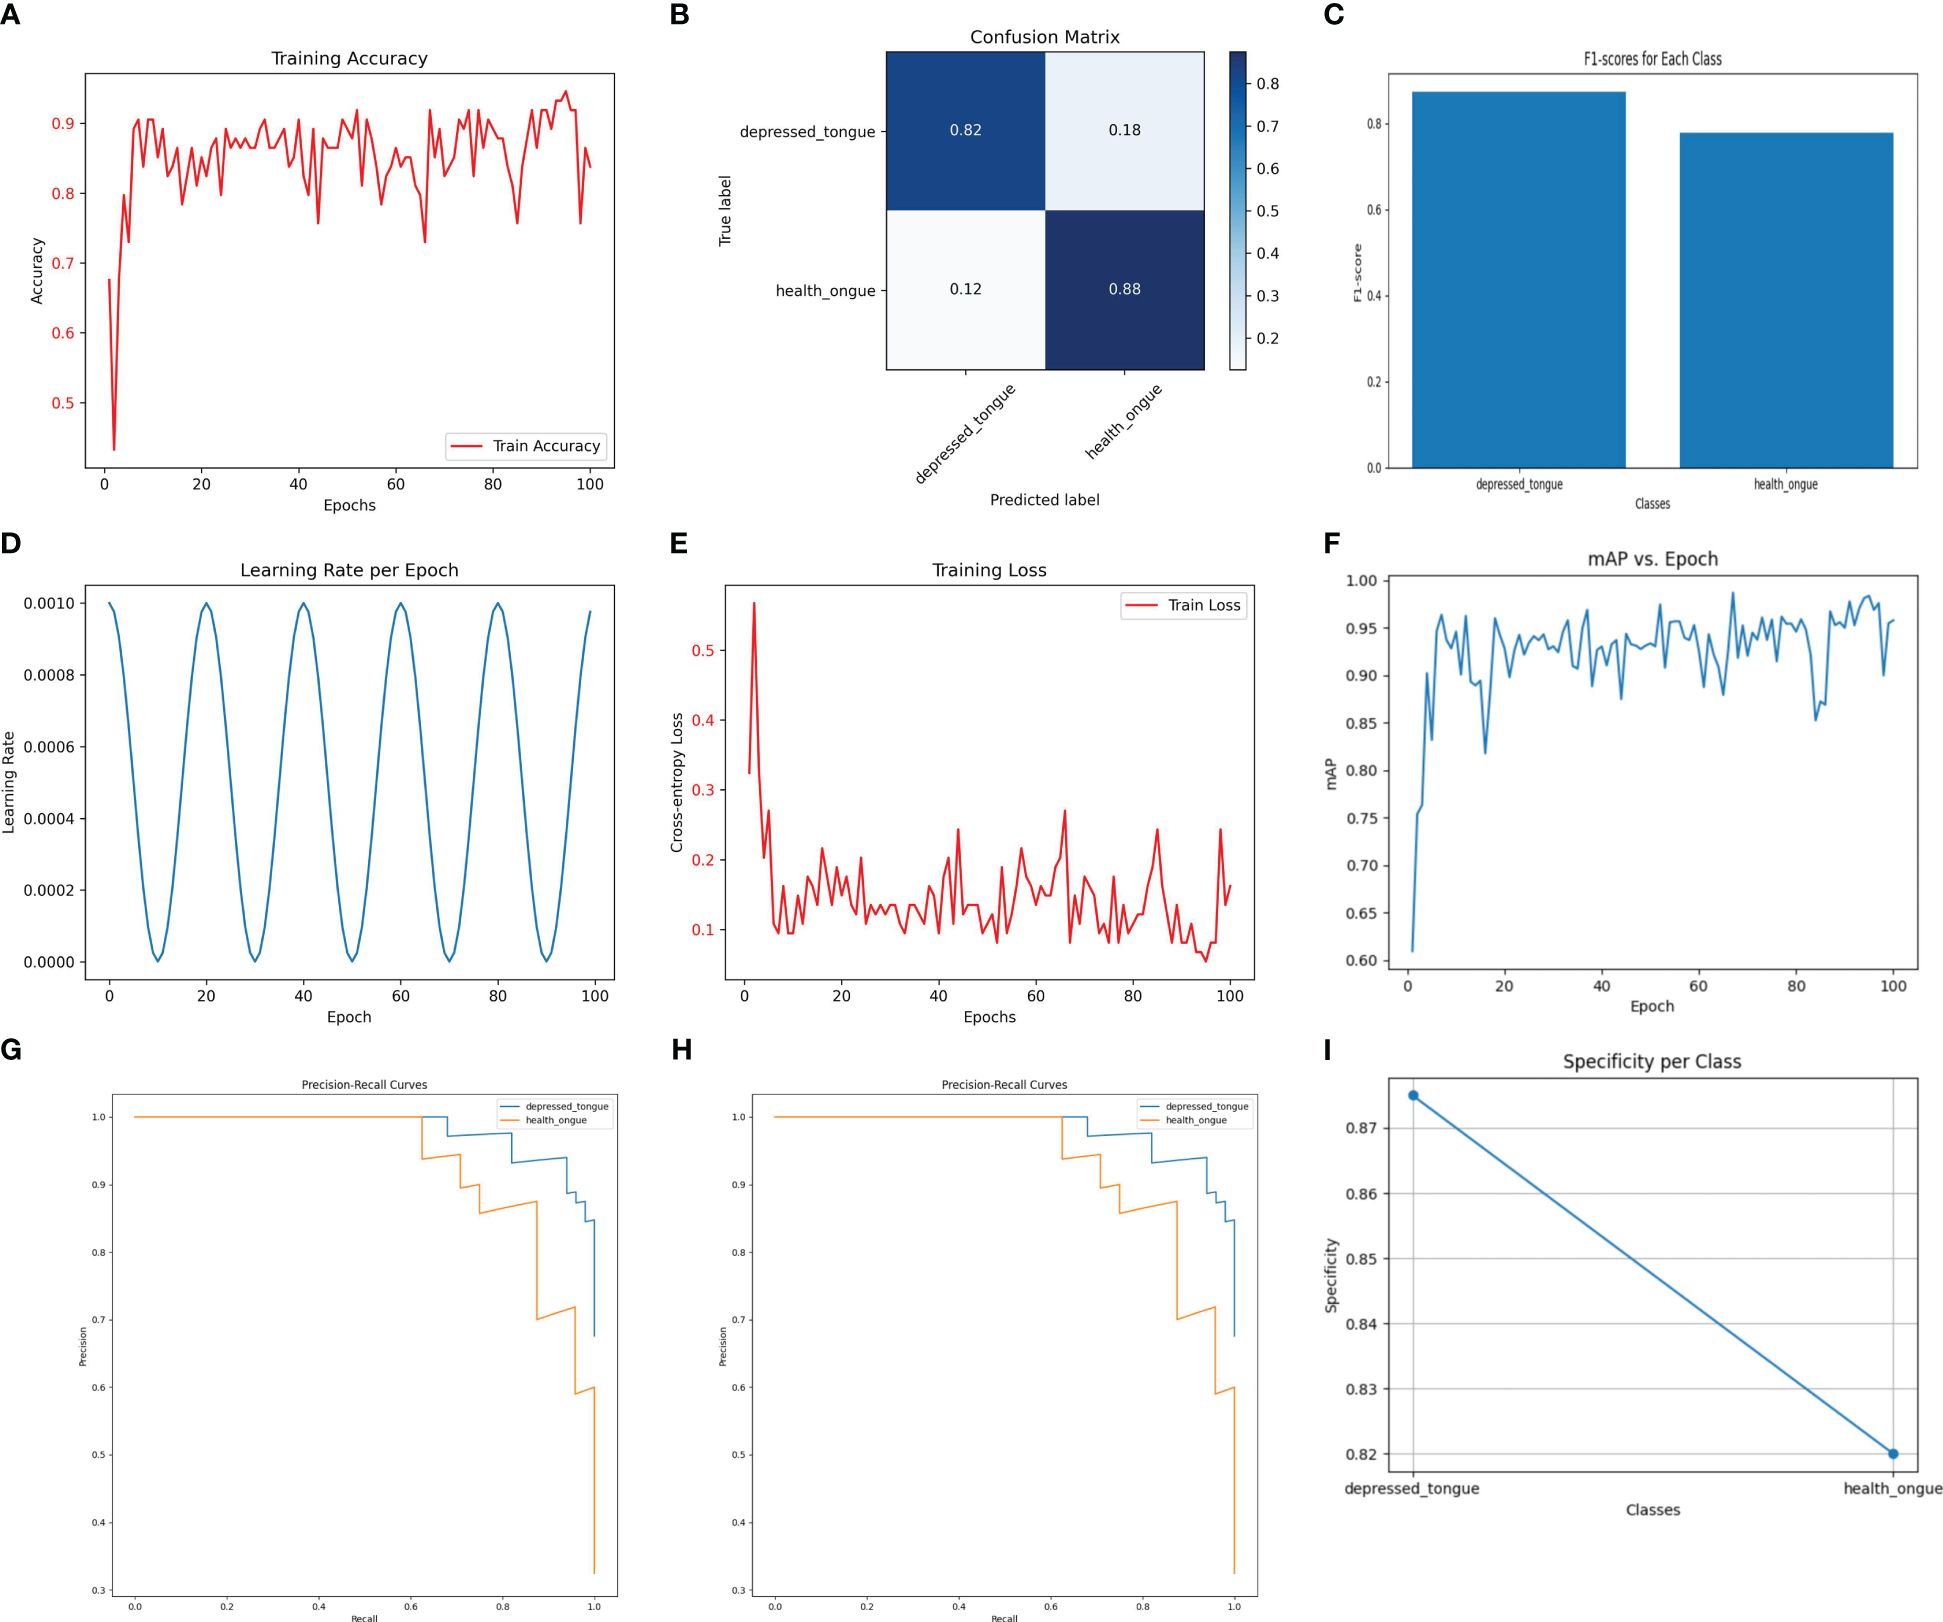
Figure 2 The performance of the MobileNetV3Small model. (A) Training Accuracy; (B) Confusion Matrix; (C) F1 Scores; (D) Learning Rate; (E) Training Loss; (F) Mean Average Precision (mAP); (G) Precision-Recall Curve; (H) ROC Curve; (I) Specificity for Each Class.
3.3 Performance analysis of the SEResNet101 model in recognizing tongue image features of subthreshold depressed patientsThe SEResNet101 model exhibited the highest level of performance across all tested metrics, making it the standout in this study. As shown in Figure 3, the SEResNet101 model achieved a classification accuracy of 98.5% on the test set, with precision and recall rates of 0.96 and 0.98, respectively, and an F1 score of 0.97. Furthermore, the model demonstrated exceptional ability in handling tongue images with rich details, accurately classifying them by detecting and utilizing subtle feature variations. This is especially important for complex or blurry images.
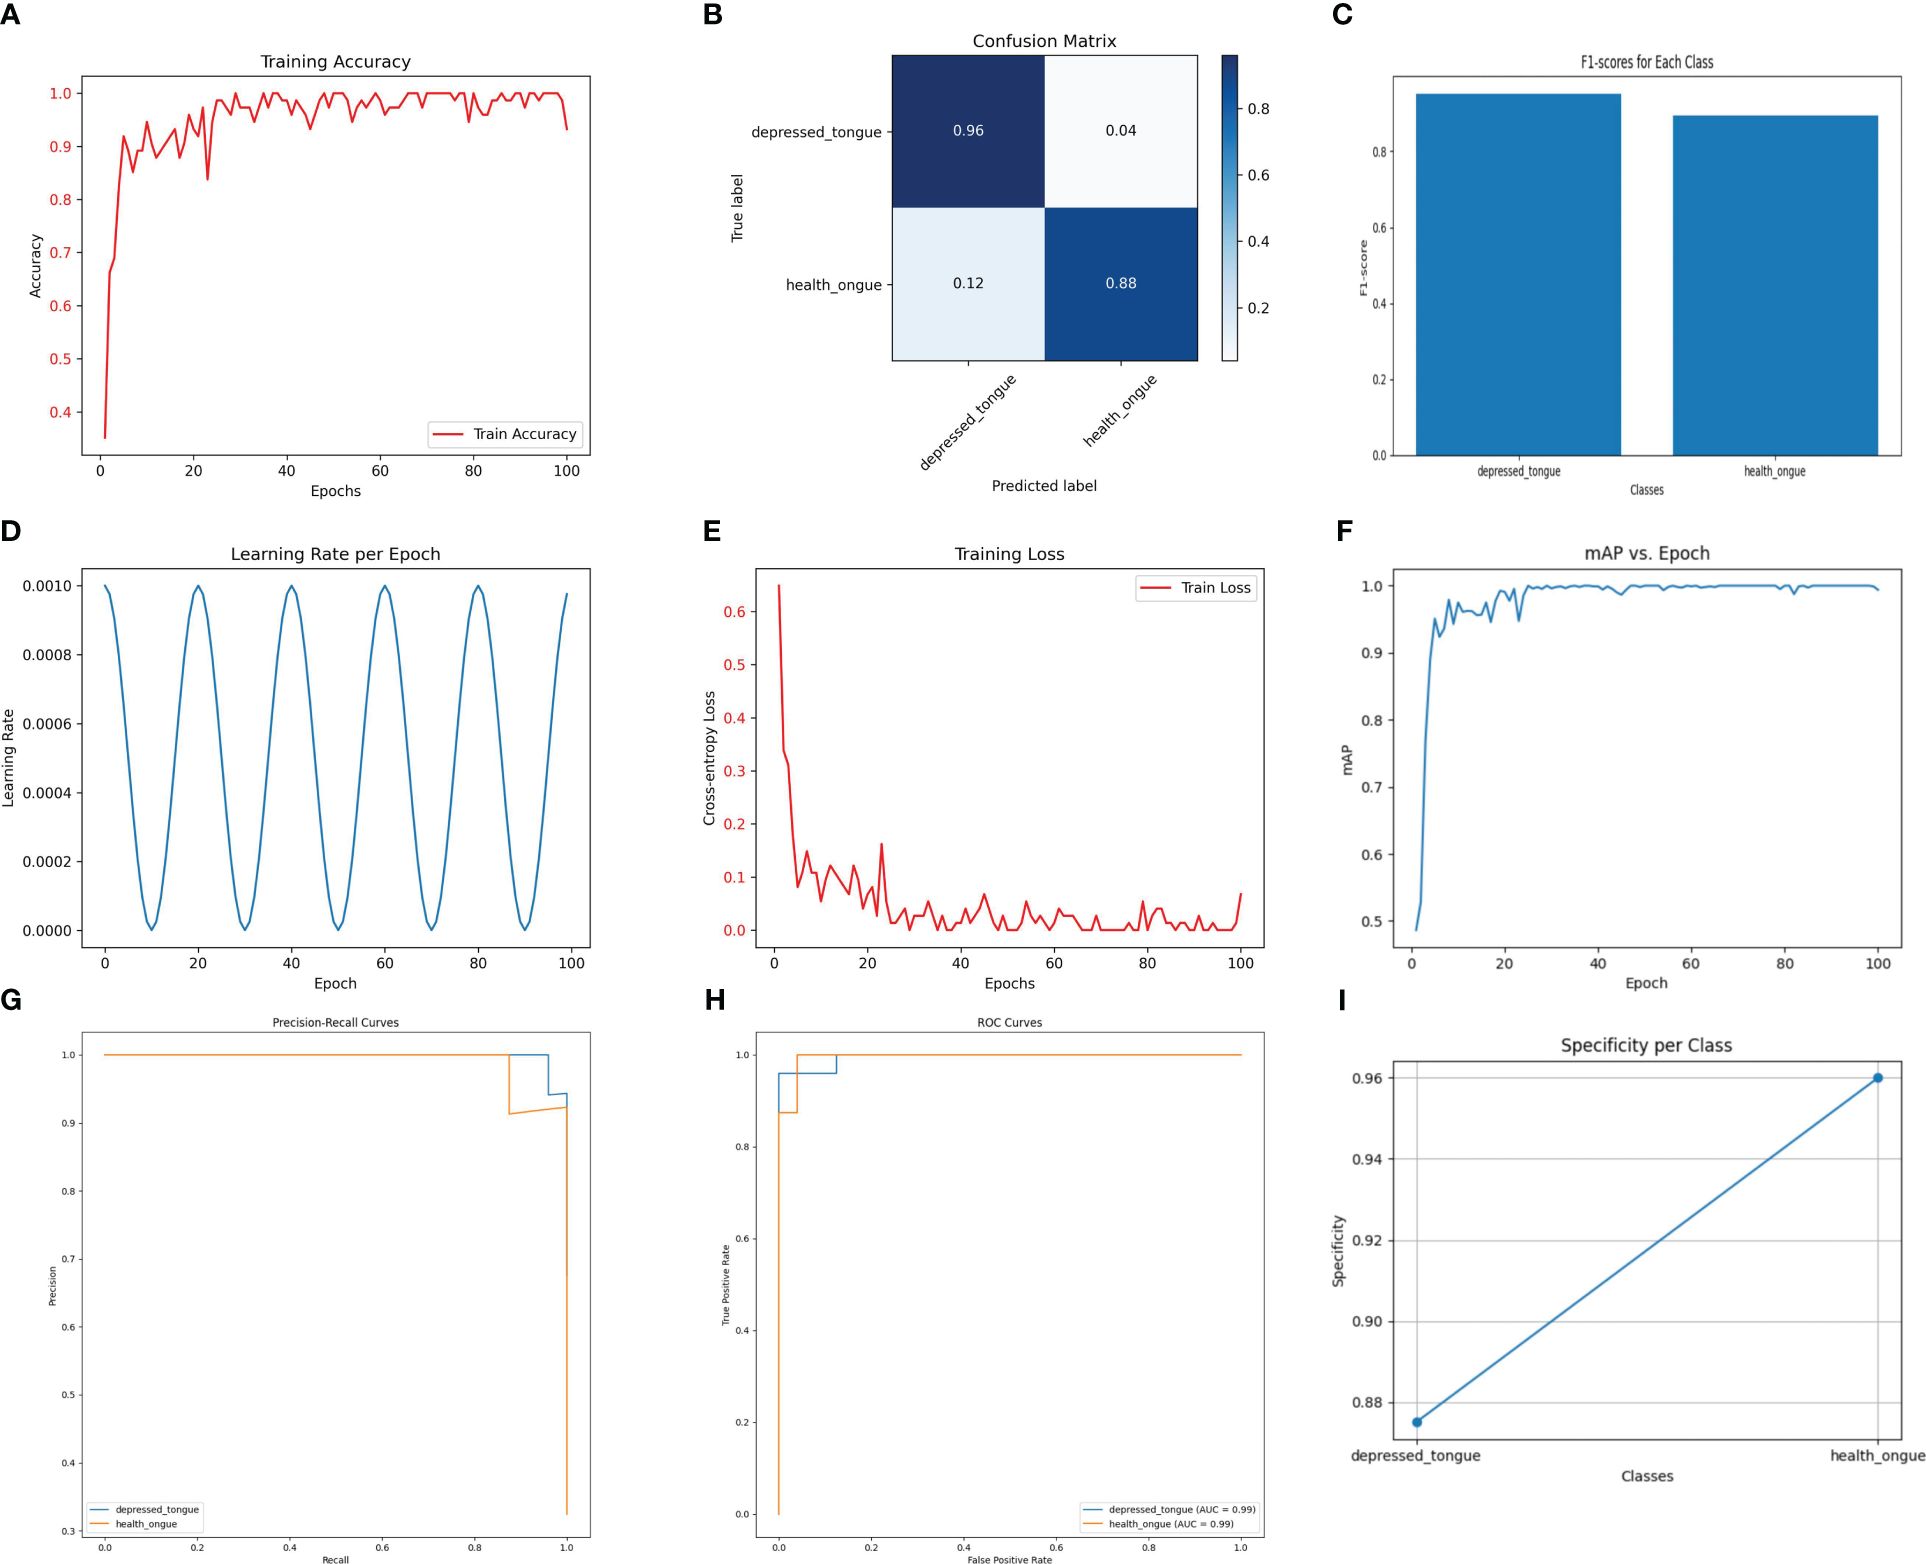
Figure 3 The performance of the SEResNet101 model. (A) Training Accuracy; (B) Confusion Matrix; (C) F1 Scores; (D) Learning Rate; (E) Training Loss; (F) Mean Average Precision (mAP); (G) Precision-Recall Curve; (H) ROC Curve; (I) Specificity for Each Class.
3.4 Performance analysis of the SqueezeNet model in recognizing tongue image features of subthreshold depressed patientsThe SqueezeNet model demonstrates a considerable performance in the recognition task while maintaining relatively low computational cost. As shown in Figure 4, the SqueezeNet model achieves an accuracy of 92.3% on the test set, with a precision of 0.88, a recall of 0.90, and an F1 score of 0.89. Although these values are slightly lower compared to other models, it is important to consider its significantly lower parameter count and computational requirements. SqueezeNet exhibits clear advantages in efficiently processing and analyzing a large number of tongue images.
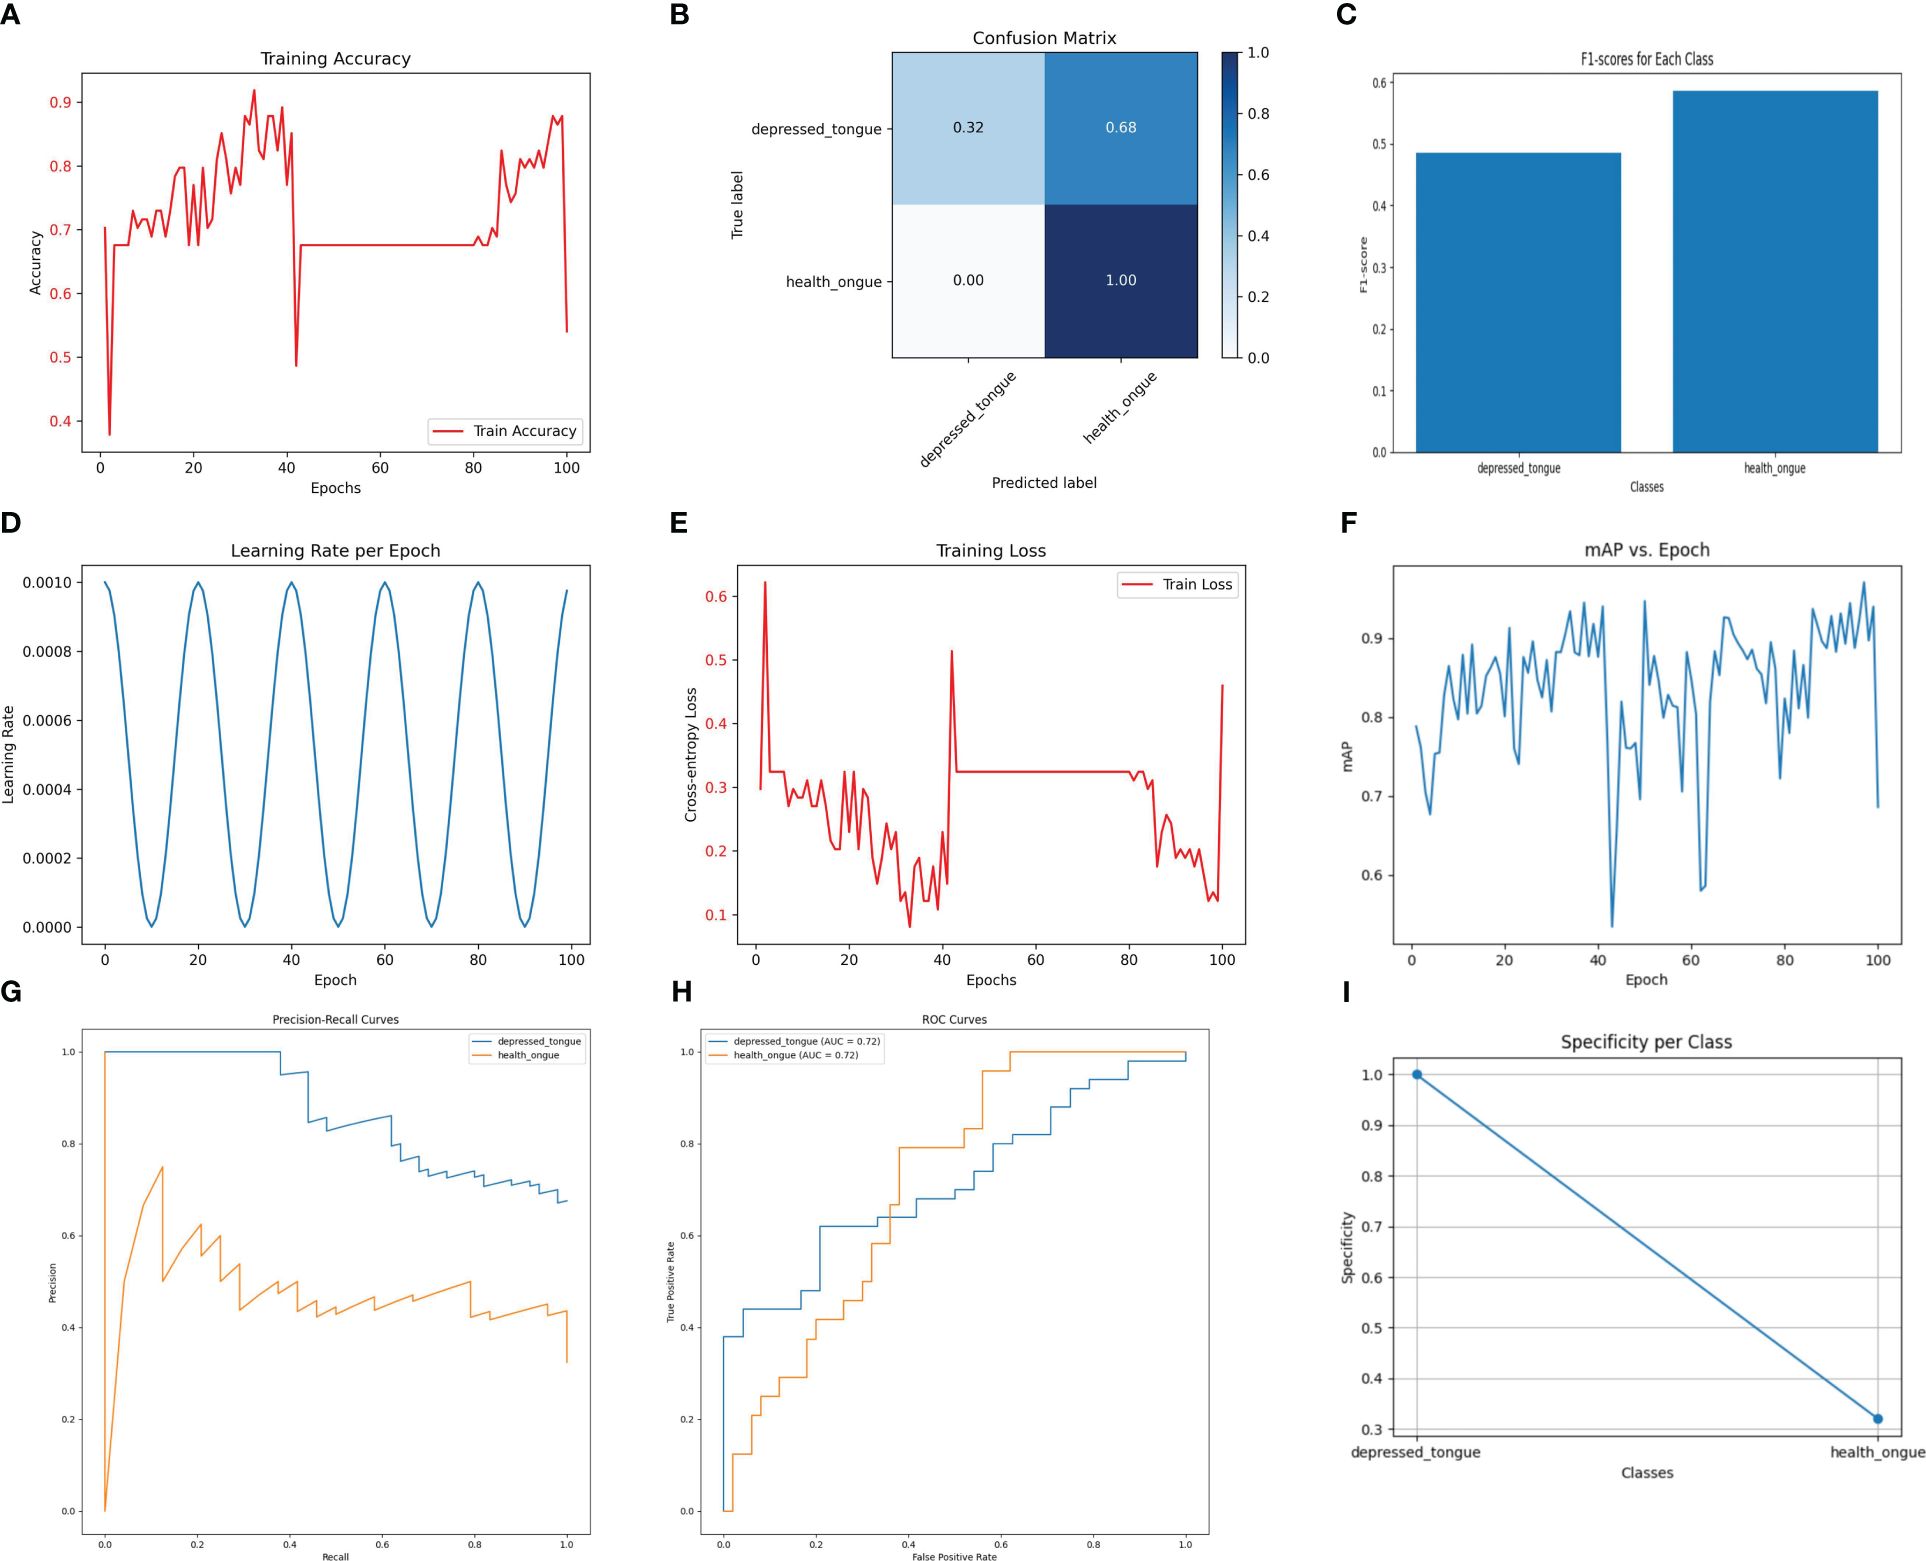
Figure 4 The performance of the SqueezeNet model. (A) Training Accuracy; (B) Confusion Matrix; (C) F1 Scores; (D) Learning Rate; (E) Training Loss; (F) Mean Average Precision (mAP); (G) Precision-Recall Curve; (H) ROC Curve; (I) Specificity for Each Class.
3.5 Performance analysis of the VGG19_bn model in recognizing tongue image features of subthreshold depressed patientsAs shown in Figure 5, the VGG19_bn model achieves the highest accuracy of 92.4% on the test set, thanks to its deep network architecture and batch normalization. However, it should be noted that this model exhibits a precision of 0.62, a recall of 0.66, and an F1 score of 0.64. While the VGG19_bn model excels in extracting deep-level image features, making it suitable for complex image recognition tasks, its computational efficiency falls behind and its accuracy is slightly lower.
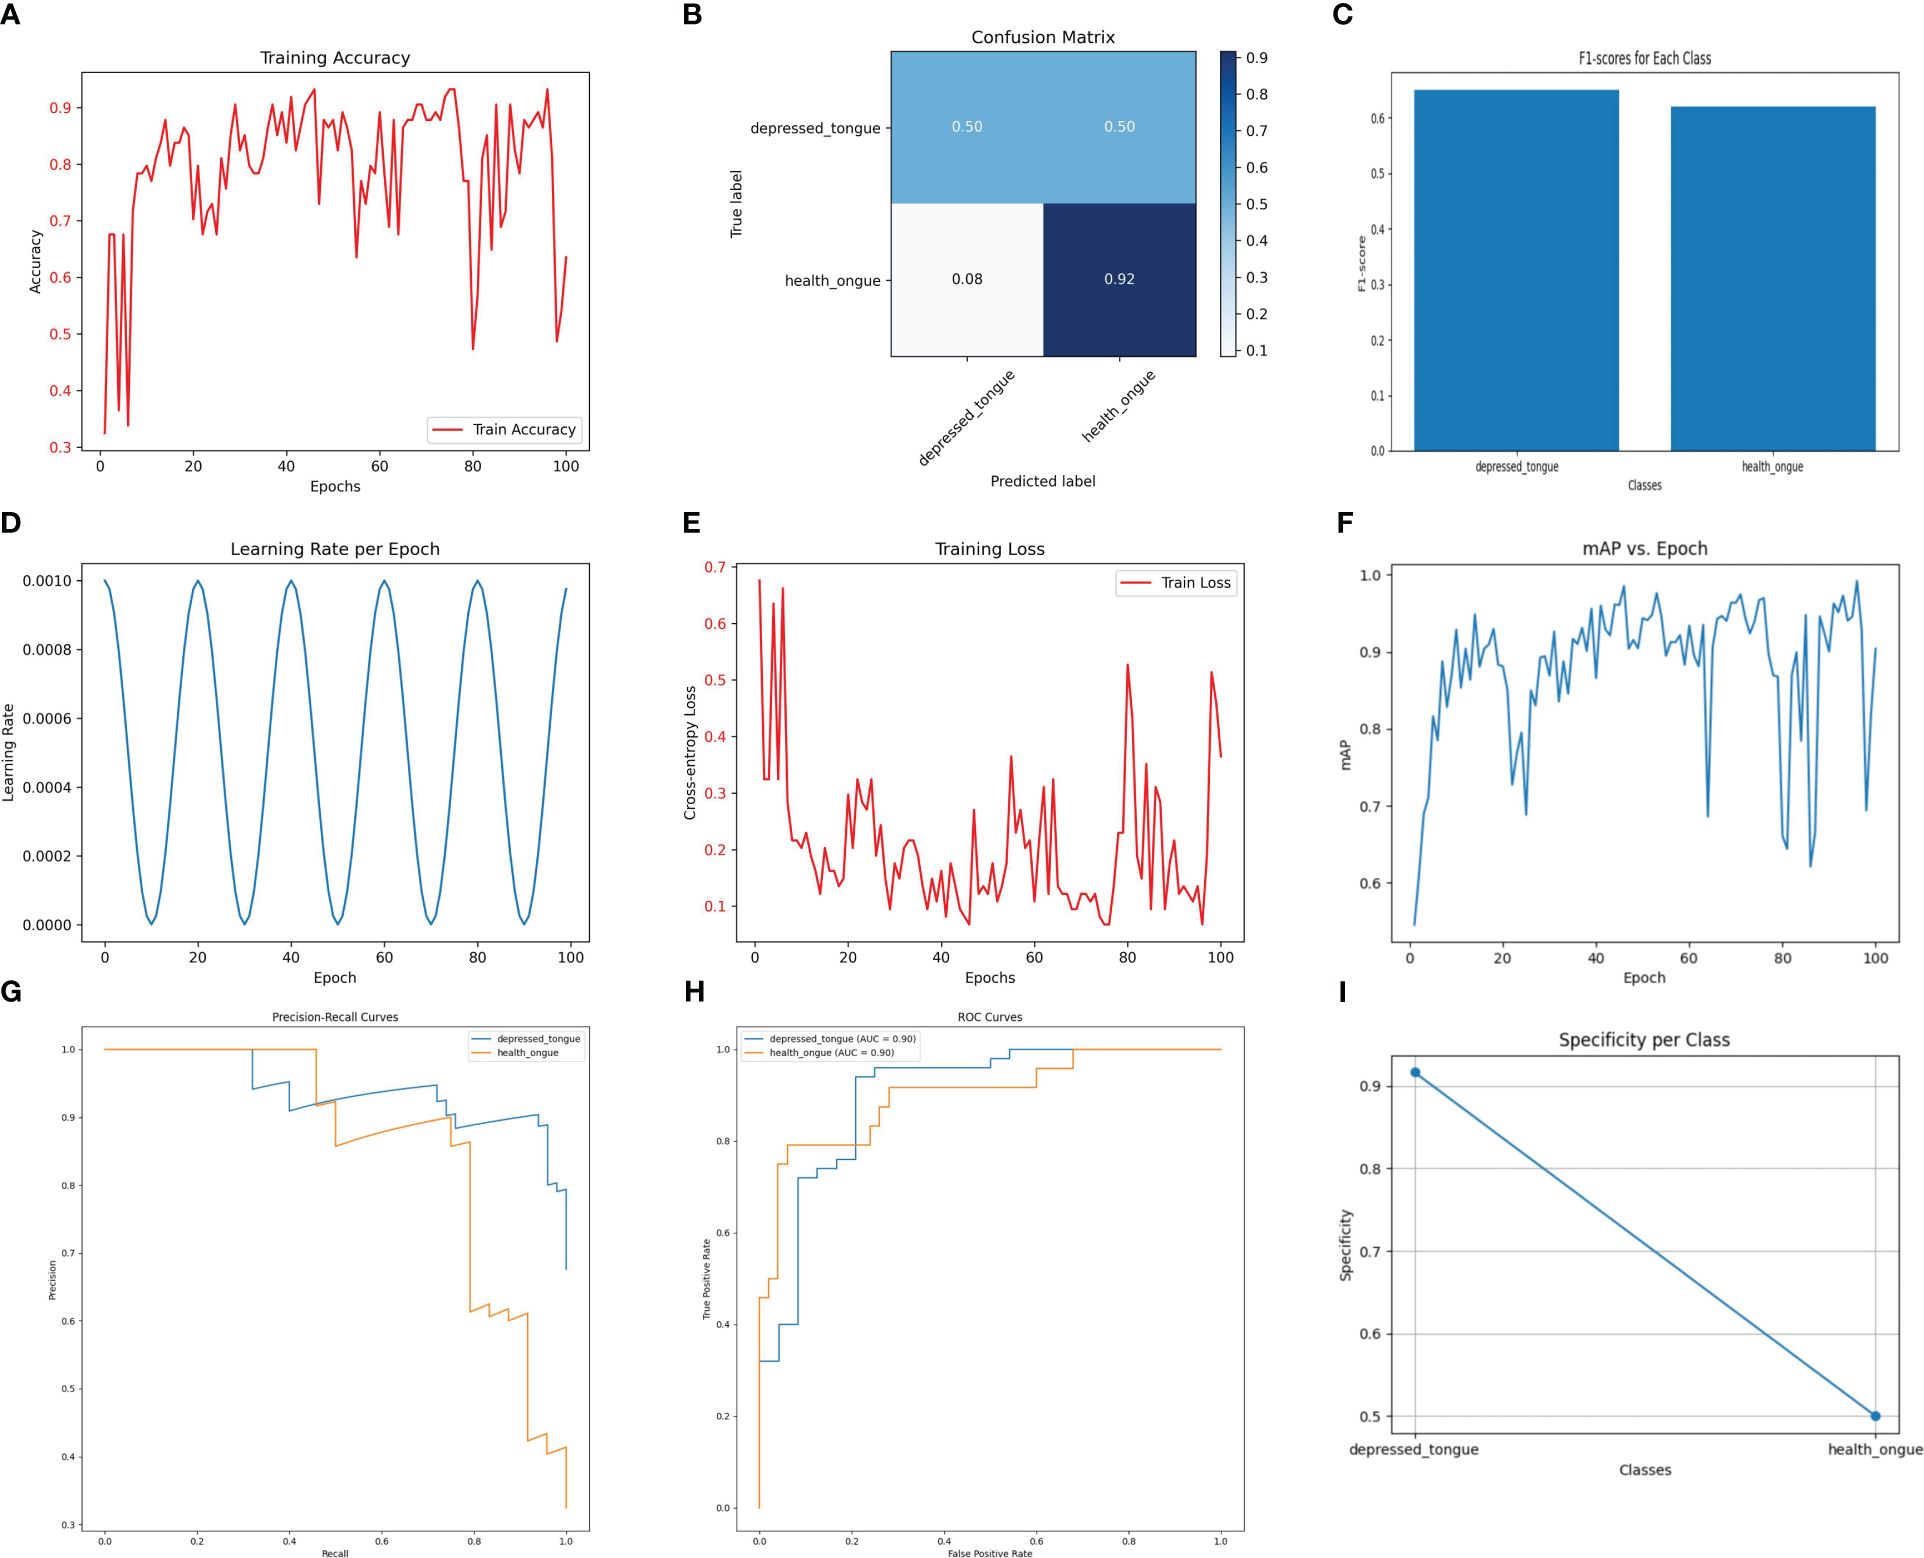
Figure 5 The performance of the Vgg19_ bn model. (A) Training Accuracy; (B) Confusion Matrix; (C) F1 Scores; (D) Learning Rate; (E) Training Loss; (F) Mean Average Precision (mAP); (G) Precision-Recall Curve; (H) ROC Curve; (I) Specificity for Each Class.
3.6 A comparative study on the efficacy of five algorithm models in identifying tongue image features of subthreshold depressed patientsAfter comparing the five models mentioned above, it can be concluded that the SEResNet101 model outperforms others in all evaluation metrics, demonstrating its exceptional performance in identifying tongue image features (Figure 6). Further analysis reveals that the SEResNet101 model is capable of capturing finer details in tongue images, possibly due to its attention mechanism and deep residual network architecture, enabling it to effectively learn important features within the images.
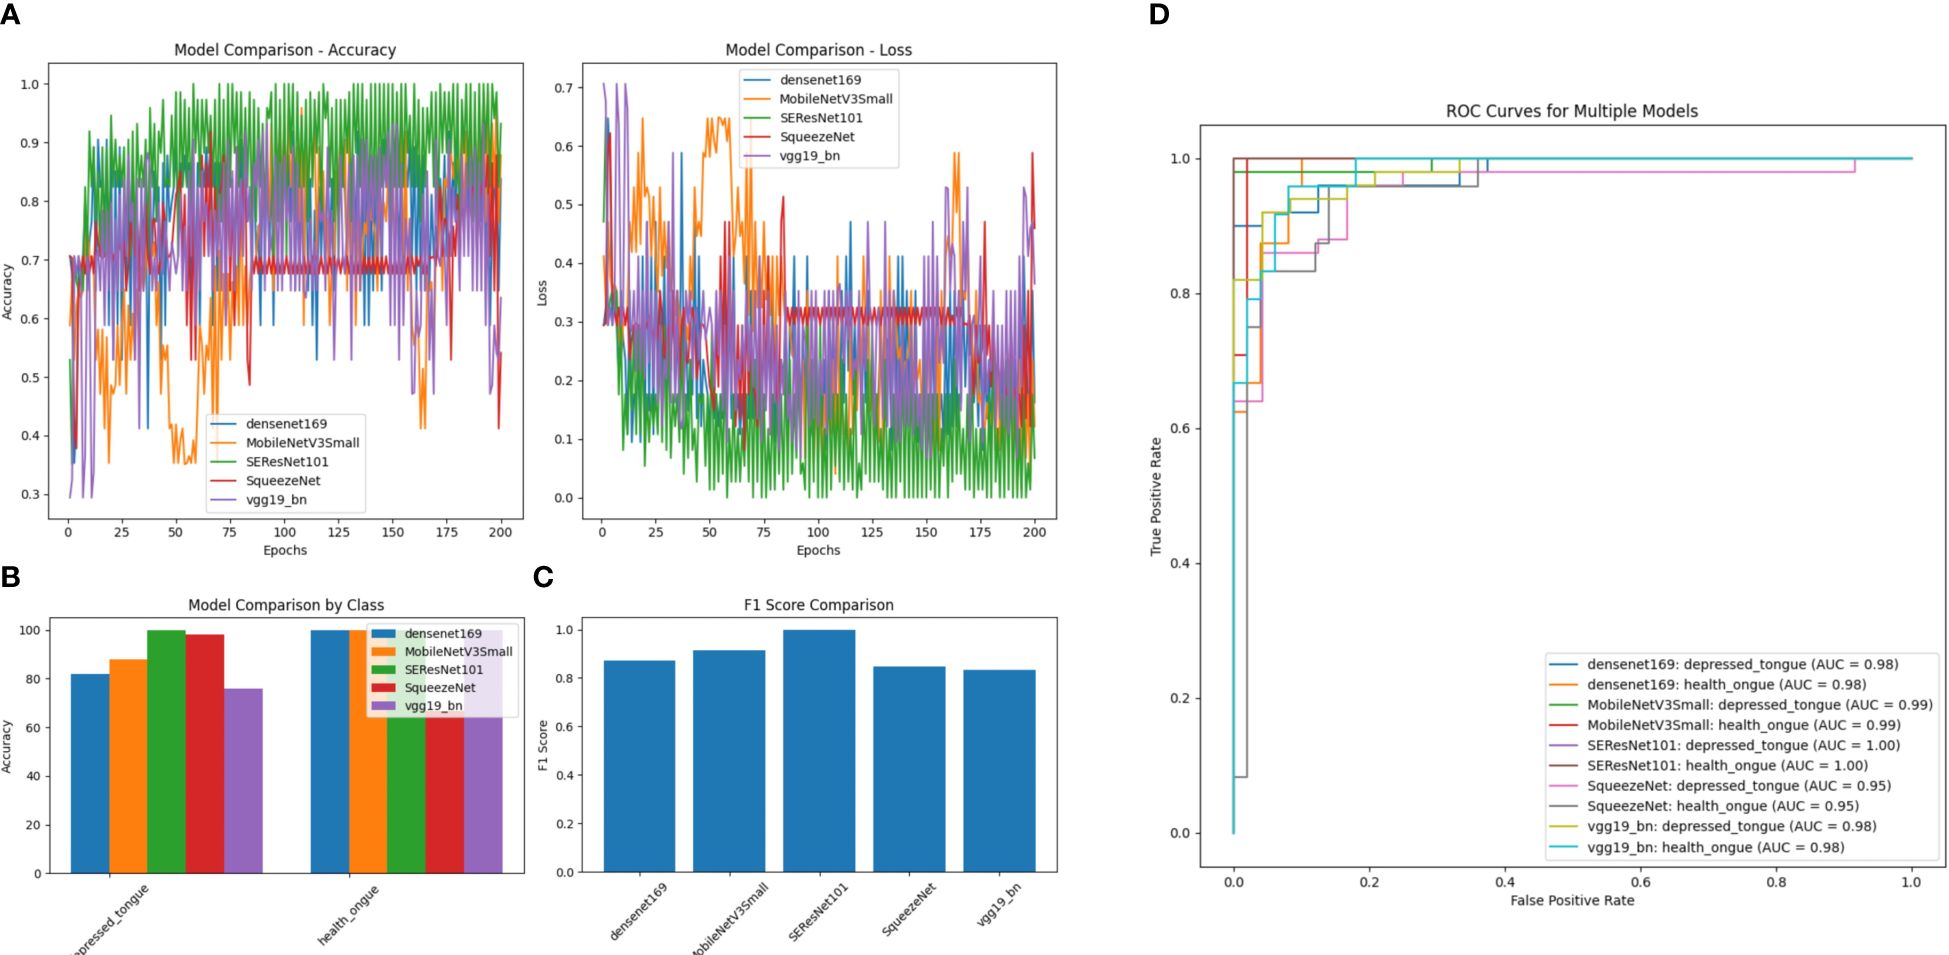
Figure 6 A comparison of performance among Five Algorithm models. (A) Accuracy comparison of different models (comparing the accuracy differences of DenseNet169, MobileNetV3Small, SEResNet101, SqueezeNet, and VGG19_bn models across different training epochs); (B) Loss comparison of different models (the lower the numerical value, the better the performance for each model across different training epochs); (C) Performance comparison of different models by category (comparing the performance differences of different models in distinguishing subthreshold depressed patients’ tongue images from tongue images of normal healthy individuals, with SEResNet101 performing the best); (D) Comparison of F1 scores among different models (comparing the F1 scores of different models, where F1 score is a measure of test accuracy that combines precision and recall, with SEResNet101 achieving the highest F1 score of 0.98).
3.7 Association analysis between the optimal model SEResNet101 and the efficacy of acupuncture treatment for subthreshold depressed patientsRegarding the association analysis between the SEResNet101 model and the efficacy of acupuncture treatment, we discovered a significant positive correlation between the predicted tongue image feature scores of the model and the degree of improvement in depressive symptoms after treatment (Figure 7, Pearson correlation coefficient = 0.72, p<0.001). This result indicates that the predicted scores of the model can serve as a robust quantitative indicator, not only for identifying tongue image features of subthreshold depressed patients but also for predicting the effectiveness of acupuncture treatment.
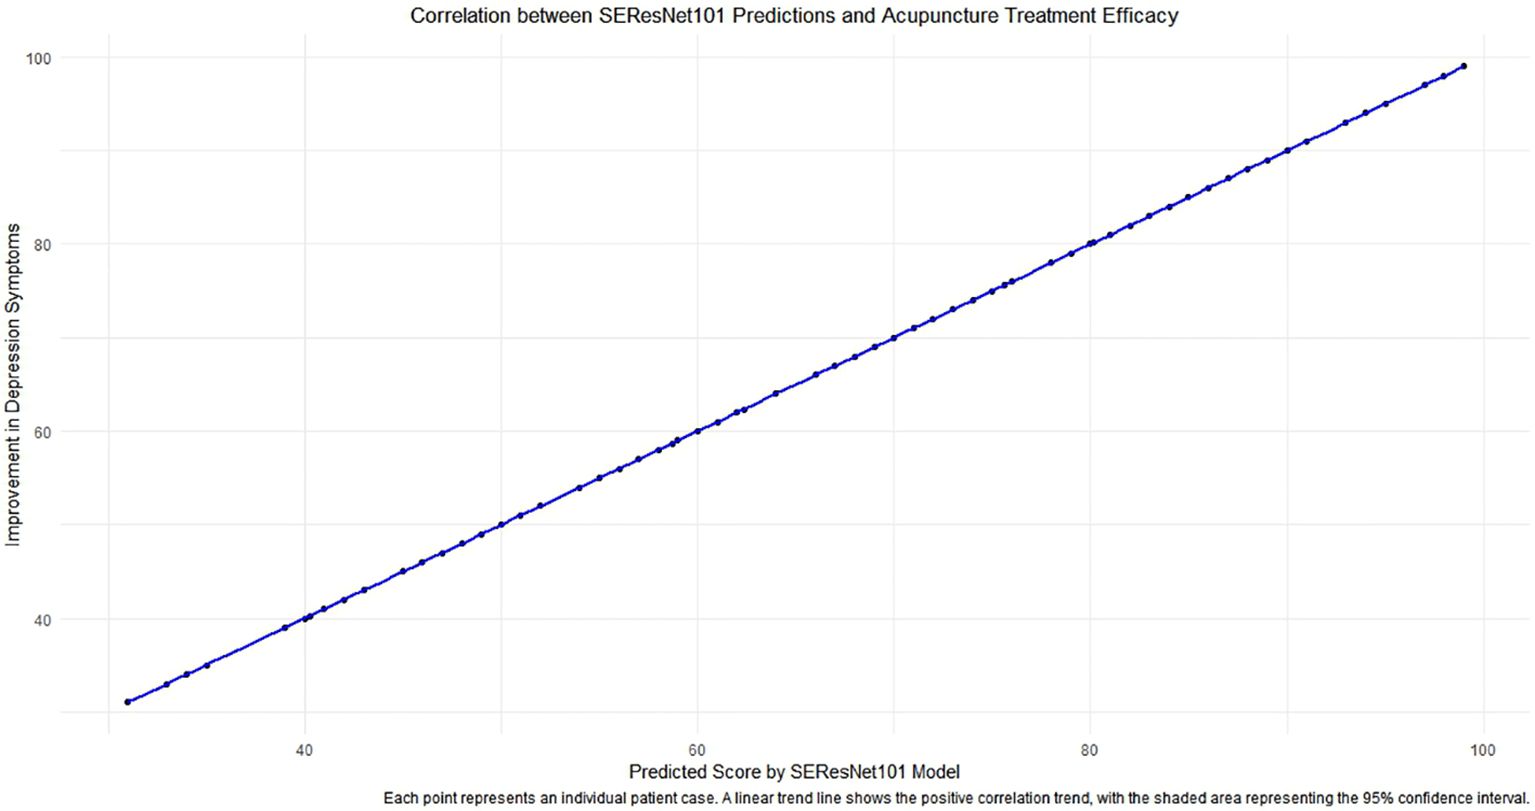
Figure 7 The correlation analysis between predictions of the SEResNet101 model and the efficacy of acupuncture treatment. The figure demonstrates the relationship between the prediction scores provided by the SEResNet101 model based on tongue image features of subthreshold depressed patients and the improvement of depressive symptoms after acupuncture treatment. By conducting a Pearson correlation coefficient analysis, we found a significant positive correlation between the two variables (Pearson correlation coefficient = 0.72), which is highly statistically significant (p<0.001). This chart reflects a strong alignment of the model’s prediction scores with the clinical treatment outcomes, supporting the potential utilization of the SEResNet101 model as an auxiliary tool for assessing the efficacy of acupuncture treatment. Each data point represents an individual patient case, where the x-axis represents the model’s prediction scores and the y-axis signifies the degree of improvement in depressive symptoms after acupuncture treatment. The linear trendline depicts a positive correlation trend between the two variables, and the shaded area indicates a 95% confidence interval, further emphasizing the robust linear relationship between the prediction scores and the actual treatment outcomes.
3.8 Alignment of the optimal model SEResNet101 with SCID and MINI in diagnosing depressionThe study aimed to assess the consistency between the optimal model SEResNet101 and the SCID and MINI diagnostic tools for identifying subclinical depression. A total of 120 individuals with subclinical depression (51 males, 69 females) participated in the study, wherein SEResNet101, SCID, and MINI diagnostic criteria were used to diagnose subclinical depression. By calculating Cohen’s Kappa coefficients pairwise, the study evaluated the level of agreement among the three diagnostic methods. The results indicated that Kappa values exceeding 0.75 demonstrate excellent consistency in diagnosing depression (Table 3).

Table 3 Consistency between SEResNet101 and SCID and MINI diagnosis.
4 DiscussionThe primary contribution of this study is the utilization of advanced deep learning models, particularly SEResNet101, to identify subtle changes in tongue images of patients with depression (89). This study not only demonstrates high accuracy in classification performance but also establishes a significant positive correlation between prediction scores and the effectiveness of acupuncture treatment through statistical analysis (90–92). This finding is important as it provides clinicians with a non-invasive diagnostic tool to aid in early identification and monitoring of the treatment process (93, 94).
Previous literature on using tongue image features for disease diagnosis remains limited and primarily focuses on rule-based image processing techniques (95). In comparison to these studies, our work employs deep learning methods, specifically in analyzing tongue images, which can learn more complex data representations and improve diagnostic accuracy. The focus on subthreshold depression stems from the necessity to address the gaps in early intervention diagnostic tools. Therefore, we opted to study subthreshold depression instead of MDE and MDD, as investigating and treating subthreshold depression can be advantageous in preventing the onset of MDD and MDE. Furthermore, this study highlights the correlation between the model’s prediction scores and treatment effectiveness, a point scarcely reported in existing research.
The SEResNet101 model stands out among other models due to its high performance. Analysis demonstrates its effectiveness in extracting and learning crucial features from tongue images, possibly attributed to its unique residual connections and attention mechanisms that render it more sensitive in processing image features (96). Additionally, this model exhibits good generalizability across various tongue manifestations, which is particularly important for handling diverse data in a clinical setting (97, 98).
Subthreshold depression is defined as the presence of two or more depressive symptoms for at least two weeks, but not meeting the diagnostic criteria for dysthymia and/or major depressive disorder (MDD). Patients with subthreshold depression are at a higher risk of developing MDD and major depressive episodes (MDE), especially in old age. A family history of psychiatric disorders and chronic illnesses are two factors that can lead to the progression of subthreshold depression to MDD (99). Subthreshold depression represents a less severe but often undiagnosed form of depression, which can significantly impact the quality of life (100). Given the frequency with which subthreshold depression escalates to major depression, recognizing and acknowledging the importance of subthreshold depression in research, clinical practice, and policy-making could contribute to the development and application of early detection, prevention, and intervention strategies.
An important innovation of this study is the application of deep learning techniques to assist in the diagnosis of depression, particularly in handling non-invasive biomarkers. Our findings highlight the value of tongue feature analysis in the diagnosis of mental disorders, providing new perspectives and methods for the auxiliary diagnosis and treatment efficacy assessment of subthreshold depression, and laying a solid foundation for further research.
Despite the promising results of this study, the implementation of deep learning models in actual clinical settings still faces technical and operational challenges. Key factors that need to be addressed include the integration of the model into existing clinical workflows, training of medical staff, and secure management of patient privacy data. Ideally, researchers would use the model to replicate the diagnostic process as closely as possible to determine diagnostic status. However, this is not always feasible due to resource constraints, including the need for trained personnel. Future studies should consider these practical issues and design models that are easier to apply in clinical environments.
A major limitation of this study is the relatively small sample size, which may affect the evaluation of the model’s generalization ability. Additionally, the study did not cover all possible tongue variations, which may limit the model’s applicability to a broader population of depressed individuals. Future research needs to develop models that calibrate the weights of MDD classification according to different reference standards, facilitating the integration of results using different diagnostic interviews. From a clinical perspective, it is not sufficient to assess diagnostic status solely with deep learning models; rating tools and self-report questionnaires are also needed to describe the severity and specific nature of symptoms.
Although the results of this study are promising, the implementation of deep learning models in practical clinical settings still faces technical and operational challenges. Key factors that require attention include integrating the model into existing clinical workflows, training healthcare professionals, and ensuring secure management of patient privacy data. Future studies should consider these practical issues and design models that are more suitable for application in a clinical environment. A major limitation of this study is the relatively small sample size, which may impact the evaluation of the model’s generalizability. Additionally, the study failed to cover all possible tongue variations, which may limit the model’s applicability to a wider population with depression.
This research confirms the effectiveness of deep learning models, particularly SEResNet101, in identifying and predicting treatment responses for depression (Figure 8). However, considering the limitations of this study, future work should focus on expanding the sample size, encompassing a broader range of tongue variations, and exploring the potential of the model in diagnosing other mental disorders. Additionally, research should address the clinical integration and operational convenience of the model to facilitate the translation from theory to practice.
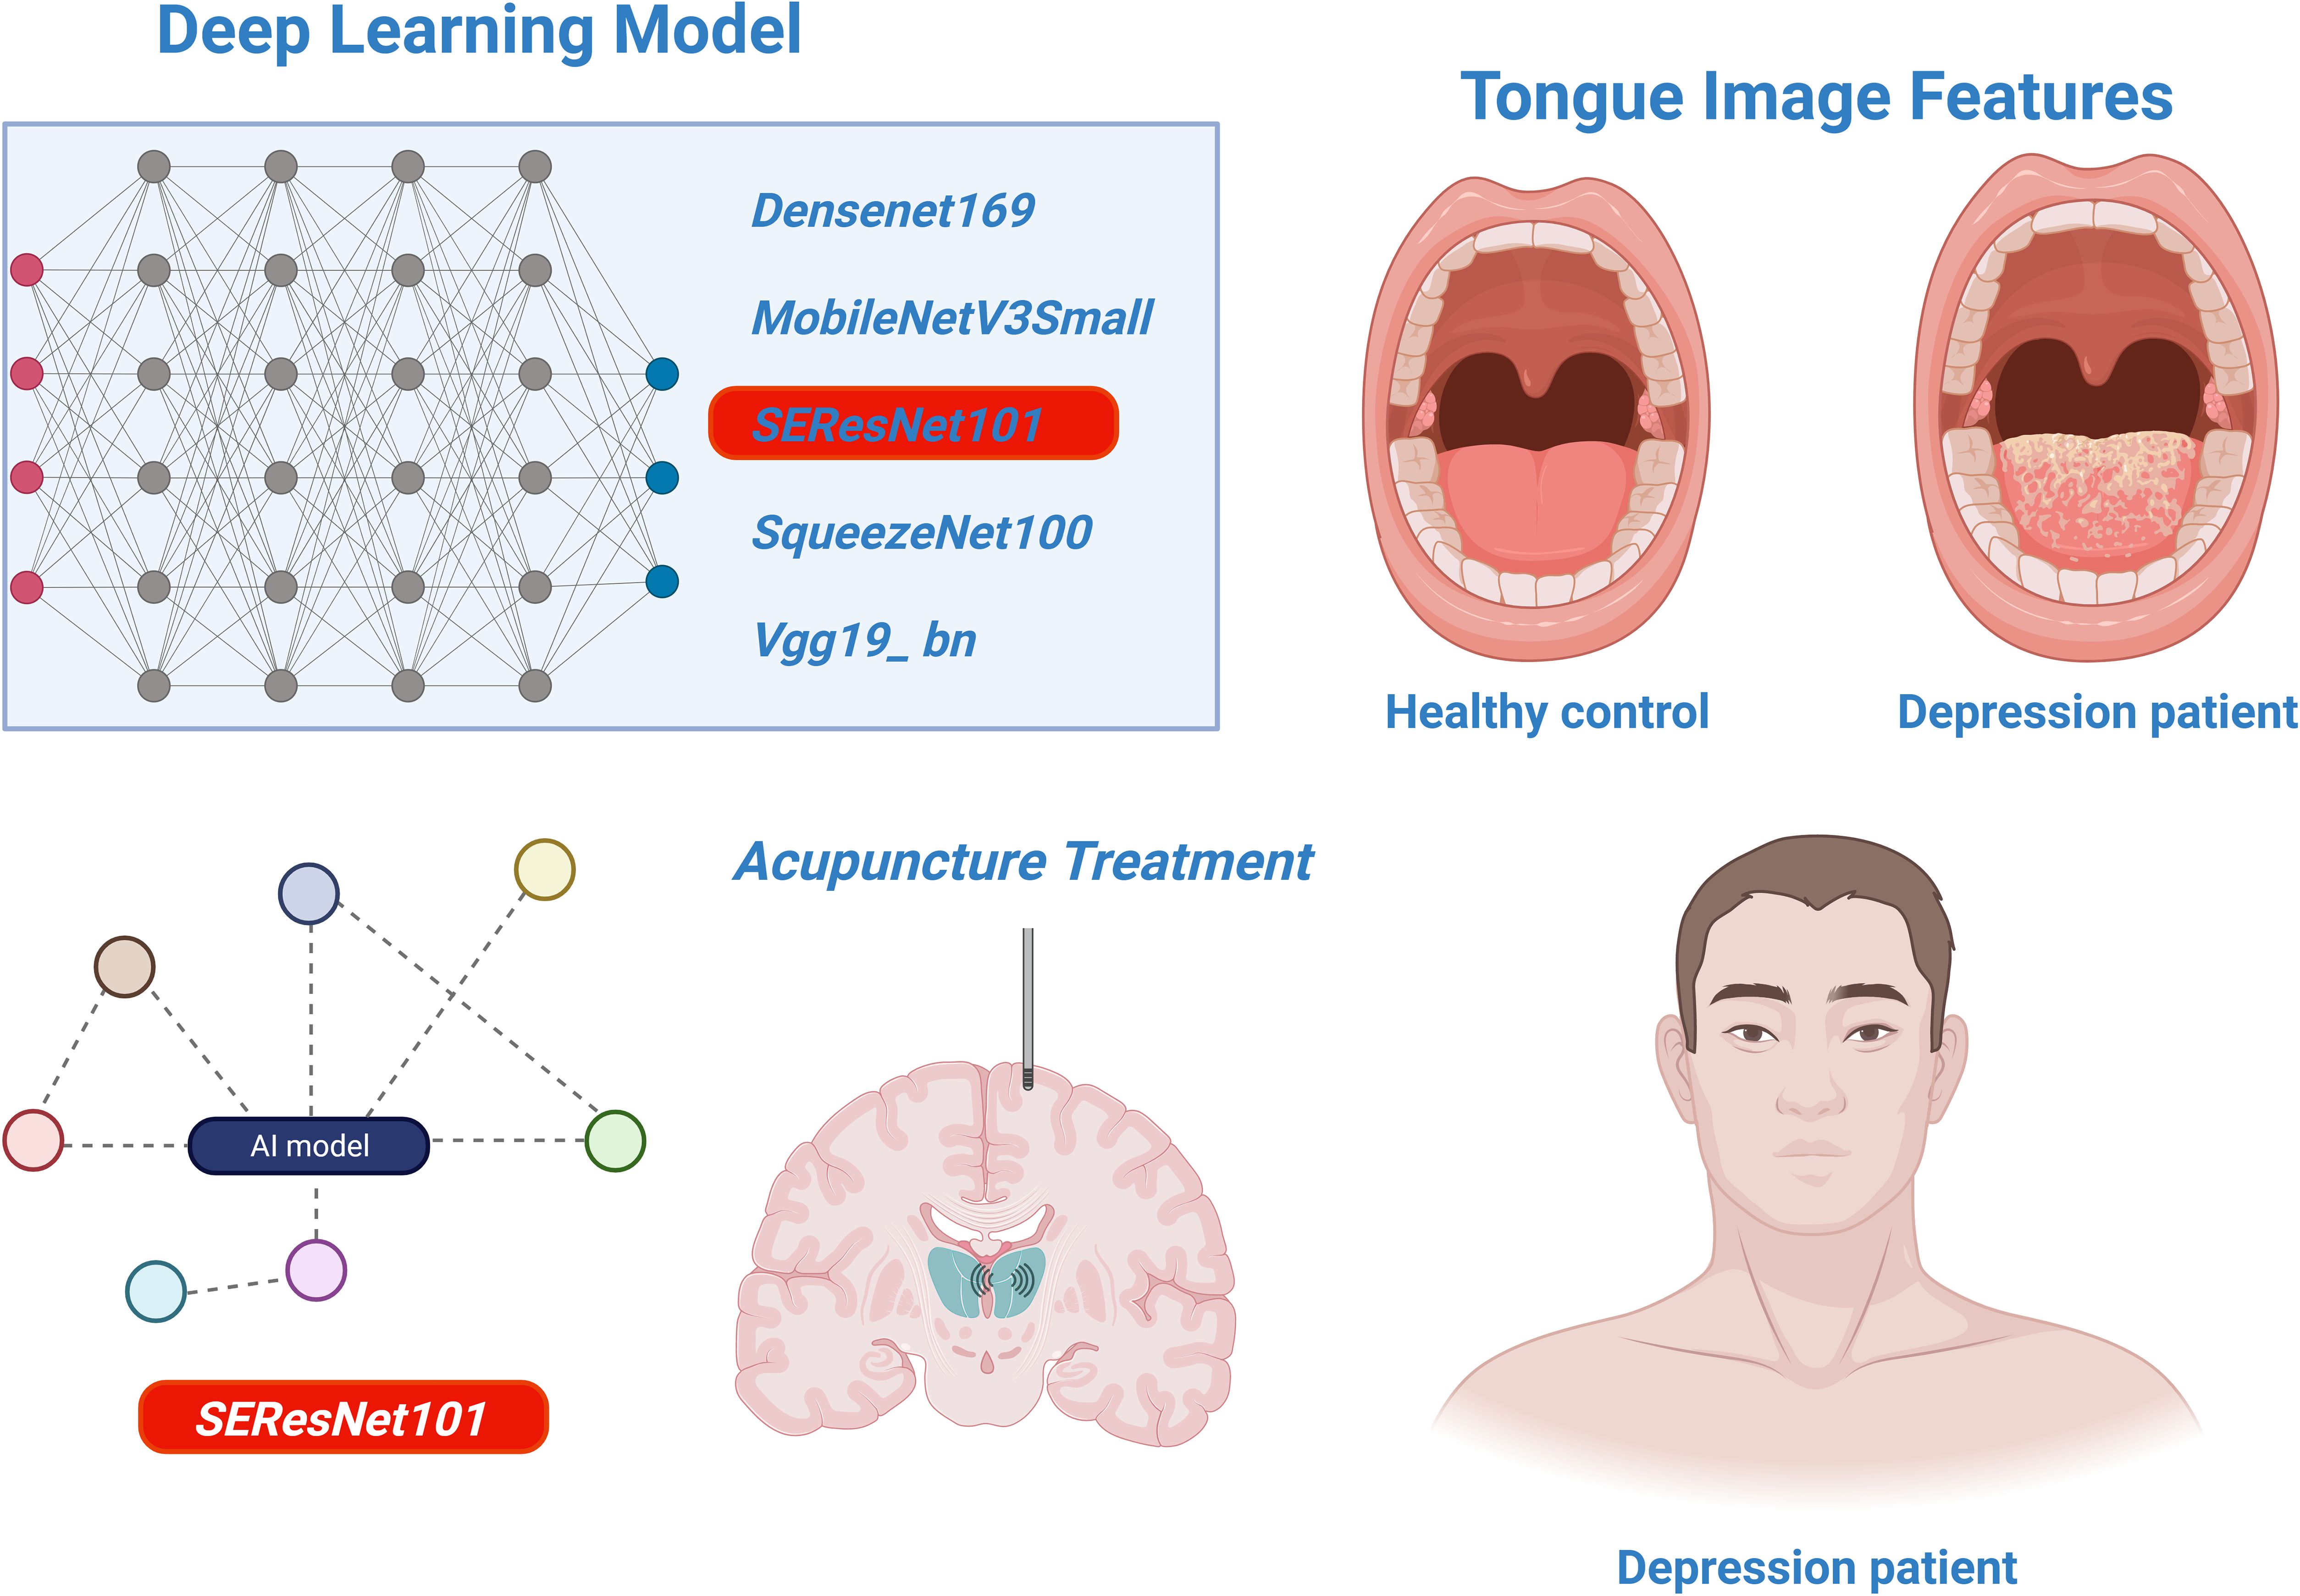
Figure 8 The analysis of deep learning models for identifying tongue image features of depression and assessing the efficacy of acupuncture treatment.
Data availability statementThe original contributions presented in the study are included in the article/supplementary material. Further inquiries can be directed to the corresponding author.
Ethics statementThe studies involving humans were approved by the ethics committee of the Shenzhen Bao’an Authentic TCM Therapy Hospital. The studies were conducted in accordance with the local legislation and institutional requirements. The participants provided their written informed consent to participate in this study.
Author contributionsBH: Investigation, Methodology, Project administration, Resources, Writing – original draft. YC: Investigation, Project administration, Supervision, Visualization, Writing – review & editing. R-RT: Conceptualization, Data curation, Formal Analysis, Funding acquisition, Writing – review & editing. CH: Conceptualization, Data curation, Formal Analysis, Funding acquisition, Writing – review & editing.
FundingThe author(s) declare financial support was received for the research, authorship, and/or publication of this article. This study was supported by Shenzhen Science and Technology Program (Project No. JCYJ20220530162613030), Project of Guangdong Provincial Administration of Traditional Chinese Medicine (Project No.: 20241282), Research and development funded by Shenzhen Bao’an Traditional Chinese Medicine Development Foundation (Project No. 2022KJCX-ZJZL-13), Shenzhen Municipal Government’s “Healthcare Three Project” - Prof Xu Nenggui’s Acupuncture Team from Guangzhou University of Chinese Medicine (SZZYSM202311015) and Scientific Research Project of Guangdong Provincial Acupuncture and Moxibustion Society (Project No. GDZJ2022002).
Conflict of interestThe authors declare that the research was conducted in the absence of any commercial or financial relationships that could be construed as a potential conflict of interest.
Publisher’s noteAll claims expressed in this article are solely those of the authors and do not necessarily represent those of their affiliated organizations, or those of the publisher, the editors and the reviewers. Any product that may be evaluated in this article, or claim that may be made by its manufacturer, is not guaranteed or endorsed by the publisher.
References2. Wang S, Liu X, Zhao J, Liu Y, Liu S, Liu Y, et al. Computer auxiliary diagnosis technique of detecting cholangiocarcinoma based on medical imaging: A review. Comput Methods Prog Biomed. (2021) 208:106265. doi: 10.1016/j.cmpb.2021.106265
CrossRef Full Text | Google Scholar
3. Al-Hammuri K, Gebali F, Thirumarai Chelvan I, Kanan A. Tongue contour tracking and segmentation in lingual ultrasound for speech recognition: A review. Diagn (Basel). (2022) 12:2811. doi: 10.3390/diagnostics12112811
CrossRef Full Text | Google Scholar
5. Zheng S, Guo W, Li C, Sun Y, Zhao Q, Lu H, et al. Application of machine learning and deep learning methods for hydrated electron rate constant prediction. Environ Res. (2023) 231:115996. doi: 10.1016/j.envres.2023.115996
PubMed Abstract | CrossRef Full Text | Google Scholar
6. Onyema EM, Shukla PK, Dalal S, Mathur MN, Zakariah M, Tiwari B. Enhancement of patient facial recognition through deep learning algorithm: convNet. J Healthc Eng. (2021) 2021:5196000. doi: 10.1155/2021/5196000
PubMed Abstract | CrossRef Full Text | Google Scholar
7. Muhammad LJ, Haruna AA, Sharif US, Mohammed MB. CNN-LSTM deep learning based forecasting model for COVID-19 infection cases in Nigeria, South Africa and Botswana. Health Technol (Berl). (2022) 12:1259–76. doi: 10.1007/s12553-022-00711-5
PubMed Abstract | CrossRef Full Text | Google Scholar
8. Li J, Cui L, Tu L, Hu X, Wang S, Shi Y, et al. Research of the distribution of tongue features of diabetic population based on unsupervised learning technology. Evid Based Complement Alternat Med. (2022) 2022:7684714. doi: 10.1155/2022/7684714
PubMed Abstract | CrossRef Full Text | Google Scholar
9. Ramakrishnan R, Rao S, He JR. Perinatal health predictors using artificial intelligence: A review. Womens Health (Lond). (2021) 17:17455065211046132. doi: 10.1177/17455065211046132
Comments (0)