X-ray is the most widely used primary imaging technique for routine chest and bone radiography as it is widely available, low cost, has fast imaging speed, and easy to acquire (Liu et al., 2022). Because of its fast imaging (seconds after exposure), X-ray has become the preferred imaging device to improve the work efficiency and facilitate the diagnosis of critically ill and/or emergency patients in clinical practice (Howell, 2016; Seah et al., 2021).
The relationship analysis between the heart and lungs has been a hot topic in clinical or scientific research (Yang et al., 2022). The cardiothoracic ratio (CTR) is one of the most commonly used cardiac measurement methods and a commonly used indicator for evaluating cardiac enlargement (Saul, 1919; Hada, 1995; Chang et al., 2022). Specifically, various etiologies, such as pathological changes in the heart itself and increased adaptability secondary to hemodynamic changes leading to left and right heart enlargement, will increase the CTR. Chest X-rays (CXRs), as an economical and convenient routine examination, can better display the situation of the chest, lung tissue, pulmonary blood vessels, heart, chest blood vessels, etc., providing a reliable basis for clinical diagnosis (Howell, 2016; Seah et al., 2021; Liu et al., 2022). Although cardiac enlargement should be diagnosed through echocardiography, follow-up and treatment can be based on the postero-anterior (P-A) CXR images. P-A CXR must be performed for the initial cardiac examination (Hada, 1995). In addition, the CTR is also a predictor of heart failure progression in asymptomatic patients with cardiac diseases (Nochioka et al., 2023). Therefore, the accurate CTR measurement of these vulnerable populations is crucial for precision healthcare.
Manual CTR measurement based on the P-A CXR image requires experienced radiologists and is time-consuming and laborious. Therefore, with the rapid development of artificial intelligence, such as convolutional neural networks (CNNs), automatic CTR calculation methods or models based on P-A CXR images have been successively proposed in recent years (Li et al., 2019; Saiviroonporn et al., 2021; Jafar et al., 2022). Li et al. proposed a computer-aided technique that is more reliable and time- and labor-saving than the manual method in CTR calculation. In addition, Pairash et al. verified that the AI (artificial intelligence)-only method could replace the manual CTR measurement. Meanwhile, Abbas et al. proposed a CardioNet model that achieved acceptable accuracy and competitive results across all datasets. However, the above methods or models in references 9–11 are still limited by heart segmentation. Although heart segmentation techniques based on P-A CXR images have made significant progress (Lyu and Tian, 2023), whether the CTR calculation requires the specific morphology and structure of the heart remains to be studied. Anatomically, the heart is located within the chest cavity between the left and right lungs. Specifically, about one-third of the heart is on the right side of the midline, about two-thirds is on the left side, and the apex is on the lower left front (Weinhaus and Roberts, 2005). The transverse diameter of the heart in the cardiothoracic ratio refers to the sum of the maximum distances from the left and right cardiac margins to the midline. However, the heart in the P-A CXR images is not prominent. Therefore, if the heart segmentation needs to be more precise, the error of this heart segmentation may fail to calculate the CTR automatically based on the P-A CXR images.
Based on the above, a novel, fully automatic CTR calculation method based on the lung field should be proposed to overcome the limitations to heart segmentation. Specifically, we train a robust and standard segmentation model of pathological lungs based on multi-center training datasets of the P-A CXR images and image enhancement techniques for extracting lung fields in P-A CXR images. Then, the CTR is automatically calculated based on the lung field based on graphics. Our contributions in this paper are briefly described as follows:
(1) We propose a fully automatic CTR calculation method based on lung fields abstracted from the P-A CXR images using CNNs, overcoming the limitations to heart segmentation, avoiding errors in heart segmentation, and taking less time.
(2) We propose a novel localization method of the heart’s right and left border points based on the two-dimensional projection morphology of the lung field mask images using graphics.
(3) The proposed automatic CTR calculation method based on lung fields abstracted from the P-A CXR images may become an effective tool for initially evaluating cardiac diseases.
2 Materials and methods2.1 MaterialsHere, 789 (635 + 54 + 72 + 15 + 13) sets of the P-A CXR images from public CXR datasets, the Google website, and a case of P-A CXR video are collected in the study for training the CNNs of lung field segmentation and automatic CTR calculation. Specifically, 21 P-A CXR images are used as a test set for evaluating lung field segmentation models. In addition, these 21 P-A CXR images and 13 dynamic P-A CXR images are used to calculate the CTR.
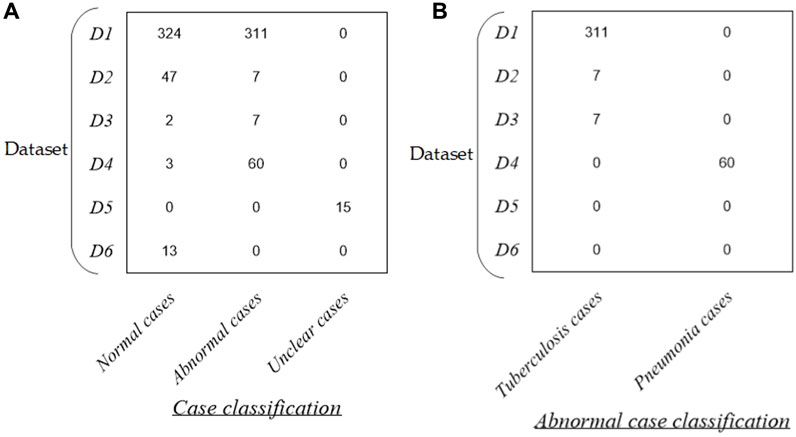
Figure 1 intuitively shows the detailed distribution of these 789 P-A CXR images in each dataset. Specifically, the dataset used in this study includes six sub-datasets (D1–D6). The public dataset D1 (The Shenzhen set — Chest X-ray database) includes 635 static P-A CXR images (324 normal cases and 311 cases with manifestations of tuberculosis). The public dataset D2 (The Shenzhen set — Chest X-ray database) includes 54 static P-A CXR images (47 normal cases and 7 cases with manifestation of tuberculosis). The public dataset D3 [NIAID TB portal program dataset (Online)] and D4 [kaggle. RSNA Pneumonia Detection Challenge (Online)] include 72 static P-A CXR images (7 cases with the manifestation of tuberculosis, 60 cases with the manifestation of pneumonia, and 5 normal cases). The public dataset D5 includes 15 static P-A CXR images collected from the Google website.

Figure 1. Distribution of the dataset in this study. (A) Distribution of case classification in each dataset and (B) distribution of abnormal cases in each dataset.
In addition, dataset D6 includes 13 dynamic P-A CXR images from the case of CXR video that were collected during free breathing. Specifically, the CXR video was collected from a female participant aged 53 using a digital X-ray imaging system (manufacturer: Lanmage, collection mode: sequence point slice, exposure parameters: 78 KV, 200 mA, 50 ms, and flat panel detector: IRAY) for chest photography. The ethics committee of the National Clinical Research Center for Respiratory Diseases in China approved this study. The subject has been provided written informed consent to the second affiliated hospital of Guangzhou Medical University before chest photography.
More specifically, the public CXR datasets D1 and D2 are collected from the website https://www.kaggle.com/datasets/kmader/pulmonary-chest-xray-abnormalities?select=ChinaSet_AllFiles. Meanwhile, the public CXR datasets D3 and D4 are collected from the websites https://data.tbportals.niaid.nih.gov/ and https://www.kaggle.com/c/rsna-pneumonia-detection-challenge/data, respectively.
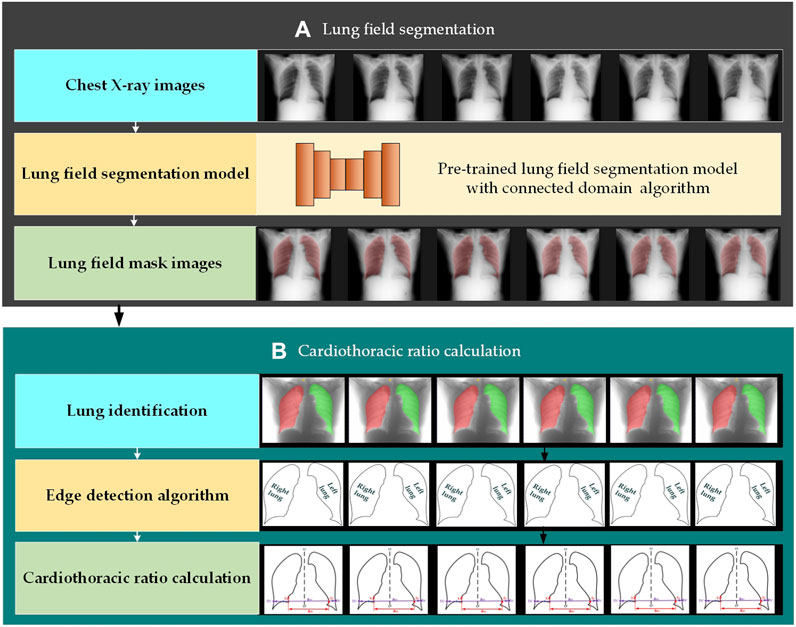
2.2 MethodsFigure 2 intuitively shows the schematic diagram of the automatic cardiothoracic ratio algorithm. Specifically, the proposed fully automatic CTR calculation method based on lung field abstracted from the P-A CXR images includes lung field segmentation and cardiothoracic ratio calculation. Figure 2A shows that the lung field mask images are abstracted from the P-A CXR images based on the trained CNNs with the connected domain (CD) algorithm. Meanwhile, Figure 2B shows the automatic CTR calculation method based on the lung field mask images.

Figure 2. Automatic cardiothoracic ratio algorithm schematic diagram. (A) Lung field segmentation and (B) cardiothoracic ratio calculation.
2.2.1 Lung field segmentationThe organ segmentation model of medical images based on CNNs has become an indispensable technology for quantitative analysis (Conze et al., 2023; Jiang et al., 2023; Ma et al., 2024). CNNs have even been applied to the lung segmentation of rats for measuring lung parenchyma parameters (Yang et al., 2021). In addition, automatic lung field segmentation in routine imaging is a data diversity problem not a methodology problem (Hofmanninger et al., 2020).
The SegNet, U-Net, and its improved networks have been widely applied in organ segmentation of medical images. Based on the above, we train four traditional and basic CNNs to test whether different CNN lung field segmentation models have differences in CTR calculation, including SegNet (Badrinarayanan et al., 2017), U-Net (Ronneberger et al., 2015), and its two improved networks, ResU-Net++ (Jha et al., 2019) and AttU-Net (Wang et al., 2021).
The training process of four lung field segmentation models based on CNNs is detailed below. First, the 755 P-A CXR images’ lung field label images (ground truth) are labeled and examined by three experienced radiologists using the software Labelme (v5.1.0) and ITK-SNAP (v4.0.2). Second, each CNN is trained by 755 P-A CXR images (755 × 512 × 512 × 1) with their lung field label images (ground truth). Specifically, 755 CXR cases include 371 normal cases, 380 abnormal cases with the manifestation of tuberculosis (N = 320) and pneumonia (N = 60), and 15 unclear cases. In addition, data augmentation techniques were adopted to avoid overfitting, further improving the robustness and generalization ability of the lung field segmentation models in the training process (Chlap et al., 2021). The standard cross entropy loss function is selected to calculate the model’s loss and dynamically adjust each CNN’s parameters. Finally, the CD algorithm (Zhao et al., 2010) is applied to the lung field mask images generated by each CNN to eliminate non-lung field masks not connected to the lung field masks.
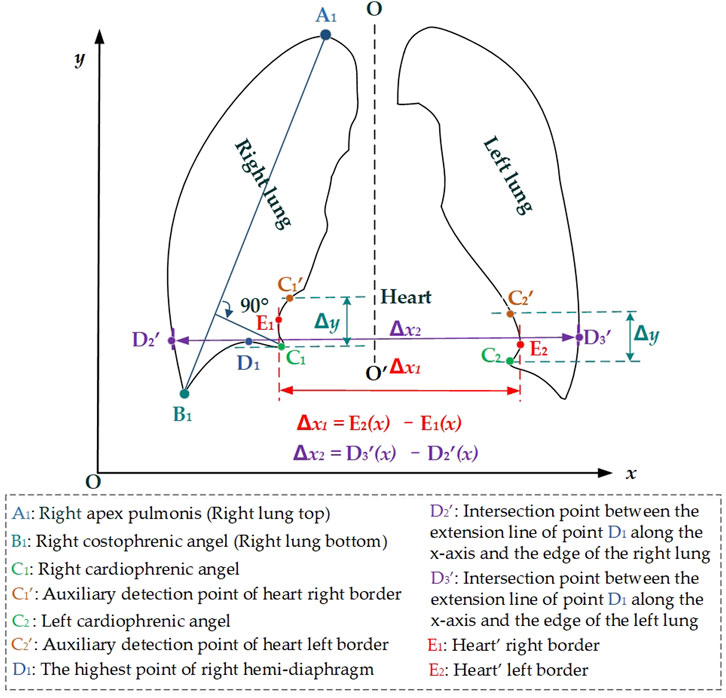
2.2.2 Automatic CTR calculationFigure 3 intuitively shows the schematic diagram of the automatic cardiothoracic ratio algorithm. First, the right and left lungs are identified based on lung field mask images. Specifically, the largest and the second largest lung field areas in each lung field mask image are identified as the right and left lung mask images, respectively. Second, edge detection is performed separately on left and right lung images, obtaining the right and left lung mask edge images. Finally, the right and left thoracic inner edge points (D2′ and D3′) and right and left heart border points (E1 and E2) are located based on the images of the right and left lung mask edge for the CTR calculation. The source code is available on the website: https://github.com/YingjianYang/Automatic-Cardiothoracic-Ratio-Calculation.

Figure 3. Schematic diagram of the automatic cardiothoracic ratio calculation is based on the images of the lung edge.
Then, the right and left cardiophrenic angles C1 and C2 are configured as detection starting points for the right and left cardiac margins. Two straight lines are drawn perpendicular to the y-axis based on the y2 and y3 coordinates of C1 (x2, y2) and C2 (x3, y3). The intersection points C1′ and C2′ of these two straight lines with the right and left lung mask edge are configured as the termination points for the right and left cardiac margins. The heart’s right border E1 is located by calculating the maximum distance from all pixels on the right side along the right lung mask edge from the right cardiophrenic angles C1, and the intersection points C1′ to the preset line O-O′. Meanwhile, the heart’s left border E2 is located by calculating the maximum distance from all pixels on the left side along the left lung mask edge from the left cardiophrenic angles C2 and the intersection points C2′ to the preset line O-O′. Furthermore, the above algorithm’s Equations 1–6 are provided.
O−O′:a0x+b0y+c0=0,(1)E1x,y←maxDC1−C1′→=maxdr1pr1,dr2pr2,dr3pr3,...,drnprn=maxdr1xr1,yr1,dr2xr2,yr2,dr3xr3,yr3,...,drnxrn,yrn=maxa0xr1+b0yr1+c0a02+b02,a0xr2+b0yr2+c0a02+b02,a0xr3+b0yr3+c0a02+b02,...,a0xrn+b0yrn+c0a02+b02,(2)where the vector DC1−C1′→=dr1pr1,dr2pr2,dr3pr3,...,drnprn presents the Euclidean distances dri of these coordinates pr1,pr2,pr3,...,prn=xr1,yr1,xr2,yr2,xr3,yr3,...,xrn,yrn to the preset line O-O′, and i = 1, 2, …, n. These coordinates xr1,yr1,xr2,yr2,xr3,yr3,...,xrn,yrn are extracted from all pixels in the left lung edge from the right cardiophrenic angles C1 and the intersection point C1′ on the left side of the preset line O-O′. The parameters a0,b0,c0 are the coefficients of the preset line O-O′.
E2x,y←maxDC2−C2′→=maxdl1pl1,dl2pl2,dl3pl3,...,dlnpln=maxdl1xl1,yl1,dl2xl2,yl2,dl3xl3,yl3,...,dlnxln,yln=max(a0xl1+b0yl1+c0a02+b02,a0xl2+b0yl2+c0a02+b02,a0xl3+b0yl3+c0a02+b02,...,a0xln+b0yln+c0a02+b02),(3)where the vector DC2−C2′→=dl1pl1,dl2pl2,dl3pl3,...,dlnpln presents the Euclidean distances dli of these coordinates pl1,pl2,pl3,...,pln=xl1,yl1,xl2,yl2,xl3,yl3,...,xln,yln to the preset line O-O′, and i = 1, 2, …, n. These coordinates xl1,yl1,xl2,yl2,xl3,yl3,...,xln,yln are extracted from all pixels in the left lung edge from the left cardiophrenic angles C2 and the intersection point C2′ on the right side of the preset line O-O′.
In addition, the preset line O-O′ is perpendicular to the x-axis (b1 = 0), so the formula (Liu et al., 2022) is converted to Equation 4. Based on Equation 4, Equations 2, 3 are further simplified to Equations 5, 6.
E1x,y←maxDC1−C1′→=maxdr1pr1,dr2pr2,dr3pr3,...,drnprn=maxdr1xr1,yr1,dr2xr2,yr2,dr3xr3,yr3,...,drnxrn,yrn=maxaoxr1+coao2,aoxr2+coao2,aoxr3+coao2,...,aoxrn+coao2=maxaoxr1+coao,aoxr2+coao,aoxr3+coao,...,aoxrn+coao,(5)E2x,y←maxDC2−C2′→=maxdl1pl1,dl2pl2,dl3pl3,...,dlnpln=maxdl1xl1,yl1,dl2xl2,yl2,dl3xl3,yl3,...,dlnxln,yln=maxaoxl1+coao2,aoxl2+coao2,aoxl3+coao2,...,aoxln+coao2=maxaoxl1+coao,aoxl2+coao,aoxl3+coao,...,aoxln+coao.(6)Finally, the distance between the right and left heart border points is configured as the maximum transverse diameter of the chest Δx1. In addition, the distance between the right thoracic inner edge point and the left thoracic inner edge point D3′ is configured as the maximum transverse diameter of the heart Δx2. Subsequently, the ratio of the heart’s maximum transverse diameter and the chest’s maximum transverse diameter Δx2 was configured as the CTR calculation. Furthermore, the above algorithm’s Equations 7–9 are rovided.
Δx1=xE1−xE2=xmaxDC1−C1′→−xmaxDC2−C2′→=xmaxdr1pr1,dr2pr2,dr3pr3,...,drnprn−xmaxdl1pl1,dl2pl2,dl3pl3,...,dlnpln=xmaxdr1xr1,yr1,dr2xr2,yr2,dr3xr3,yr3,...,drnxrn,yrn−xmaxdl1xl1,yl1,dl2xl2,yl2,dl3xl3,yl3,...,dlnxln,yln=xmaxa1xr1+c1a12,a1xr2+c1a12,a1xr3+c1a12,...,a1xrn+c1a12−xmaxa1xl1+c1a12,a1xl2+c1a12,a1xl3+c1a12,...,a1xln+c1a12=xmaxa1xr1+c1a1,a1xr2+c1a1,a1xr3+c1a1,...,a1xrn+c1a1−xmaxa1xl1+c1a1,a1xl2+c1a1,a1xl3+c1a1,...,a1xln+c1a1,(7)where xE1 and xE2 represent the horizontal coordinates x(E1) and x(E2) of the right and left heart border points E1 and E2, respectively. Similarly, xD2′ and xD3′ represent the horizontal coordinates x(D2′) and x(
Comments (0)