
Remember me


Cardiovascular disease remains the leading cause of mortality among patients with kidney failure receiving maintenance hemodialysis (HD), accounting for around 40% of deaths.1 As patients with kidney failure experience progressive loss of residual kidney function,2 they become increasingly reliant on HD for volume removal and BP control, with the goal of achieving or at least approaching euvolemia and normal or near-normal BP at the end of each HD treatment.
While most patients experience a decline in BP during HD as ultrafiltration progresses, some patients develop intradialytic hypertension, where BP increases from pre- to post-HD, which is also associated with adverse outcomes.3,4 Because hypervolemia is believed to be a major contributor to intradialytic hypertension,5–9 accurate assessment of volume status is required to inform ultrafiltration prescriptions and target (estimated dry) weight.
Recognizing the limitations of the physical examination,10 numerous studies have explored alternative methods of volume assessment in patients receiving HD.11–15 Among these, bioimpedance has received much attention, in part because of its relatively low cost and portability.16,17 Although studies have not consistently demonstrated a benefit of bioimpedance in guiding ultrafiltration,18,19 there are fewer data exploring the association of bioimpedance with changes in BP during HD, with prior studies mostly of a cross-sectional nature.7–9 In a secondary analysis of the Frequent Hemodialysis Network (FHN) Daily Trial, using repeated measures of bioimpedance20 and HD-related BP, we tested the hypothesis that vector length, a bioimpedance-derived proxy of volume status, is associated with post-HD BP and the development of intradialytic hypertension. In addition, we tested whether the association differed according to the randomized treatment arm (six times per week or three times per week HD).
Methods Study Design and PopulationThe study design and protocol,21,22 primary results,23 and results of several secondary analyses of the FHN Daily Trial have been published.20–24 The FHN Daily Trial protocol was approved by institutional review boards at each participating center, and written informed consent was obtained from all study participants. We obtained data for these analyses from the National Institute of Diabetes and Digestive and Kidney Diseases data repository.
In brief, the FHN Daily Trial was a multicenter, randomized, parallel-group trial comparing frequent (six times per week) with conventional (three times per week) in-center HD, performed in the United States and Canada. Patients receiving maintenance HD were eligible for inclusion if they were 13 years or older, achieved mean equilibrated Kt/V urea >1.0 for the past two baseline HD sessions, and weighed >30 kg. Notable exclusion criteria included poor adherence, contraindication to heparin, residual urea clearance >3 ml/min per 35 L, HD vintage <3 months, and inability to have cardiac magnetic resonance imaging. The trial was designed to examine two co-primary composite outcomes: (1) death or change (from baseline to 12 months) in left ventricular mass and (2) death or change (from baseline to 12 months) in the physical health composite score of the RAND 36-item health survey.
Exposure VariablesWe considered vector length, measured by single-frequency bioelectrical impedance analysis, as the primary exposure of interest. We calculated vector length indexed to height in meters (Z/H) from the raw measurements of resistance (R) and reactance (Xc), where R represents the opposition to the flow of an alternating current through ionic solutions and Xc is the capacitance produced by interfaces across tissues (e.g., cell membranes), according to the following formula: |Z/H| = √[(R/H)2 + (Xc/H)2].20,25 A shorter vector length reflects a higher degree of soft-tissue hydration. Bioimpedance measurements were obtained at baseline (month 0) and follow-up visits (months 1, 4, and 12), with the patient in a recumbent position before a mid-week HD treatment. We considered vector length as continuous and categorical (tertiles) variables. In companion analyses, we considered derived extracellular and intracellular water compartments (in L) and the ratio of extracellular water/total body water as exposures of interest.
Outcome VariablesThe primary outcome for this analysis was post-HD systolic BP. Other outcomes of interest included development of intradialytic hypertension, defined as any increase >0 mm Hg from pre- to post-HD26; nadir intradialysis BP; and development of intradialytic hypotension, defined as any occurrence of a minimum intradialytic systolic BP <90 mm Hg if pre-HD systolic BP was <160 mm Hg or minimum intradialytic systolic BP <100 mm Hg if pre-HD systolic BP was ≥160 mm Hg.27,28 In a sensitivity analysis, we considered an alternate definition of intradialytic hypertension (any increase >10 mm Hg in systolic BP from pre- to post-HD).
Statistical AnalysesWe examined continuous variables graphically and recorded data as means (±SDs) for normally distributed variables or medians (with 25th–75th percentiles) for non-normally distributed variables. We examined categorical variables by frequency distribution and recorded data as proportions. We compared baseline characteristics across tertiles of the vector length using tests for trend on the basis of linear regression, χ2 trend test, and Cuzick nonparametric trend test, as appropriate for data distribution.
We assessed the association between vector length and post-HD and nadir intradialytic systolic BP using unadjusted and adjusted random-effects linear regression to account for repeated measures within patients. We used analogous approaches using random-effects logistic regression to assess the association with binary outcomes of intradialytic hypertension and intradialytic hypotension. Model 1 was adjusted for randomized treatment assignment and the pre-HD systolic BP. Model 2 was additionally adjusted for age, sex, self-reported race (collected per original study protocol), Quételet (body mass) index, and access type. Model 3 was additionally adjusted for vintage (<2, 2–5, >5 years); history of hypertension, heart failure, and diabetes; and baseline residual urea clearance (0, ≤1, >1–3, >3 ml/min), hemoglobin, serum phosphate, equilibrated Kt/Vurea, serum-dialysate sodium gradient, and ultrafiltration rate (ml/kg per h). All variables were time-updated as appropriate for each visit. We examined for potential effect modification by randomized treatment arm by inclusion of the corresponding cross-product term in the fully adjusted model. We used restricted cubic splines to model the association of mean vector length (as a continuous variable) with mean post-HD systolic BP.
We considered two-tailed P values < 0.05 as statistically significant. We conducted analyses using Stata MP (version 16.0, Stata Corp., College Station, TX).
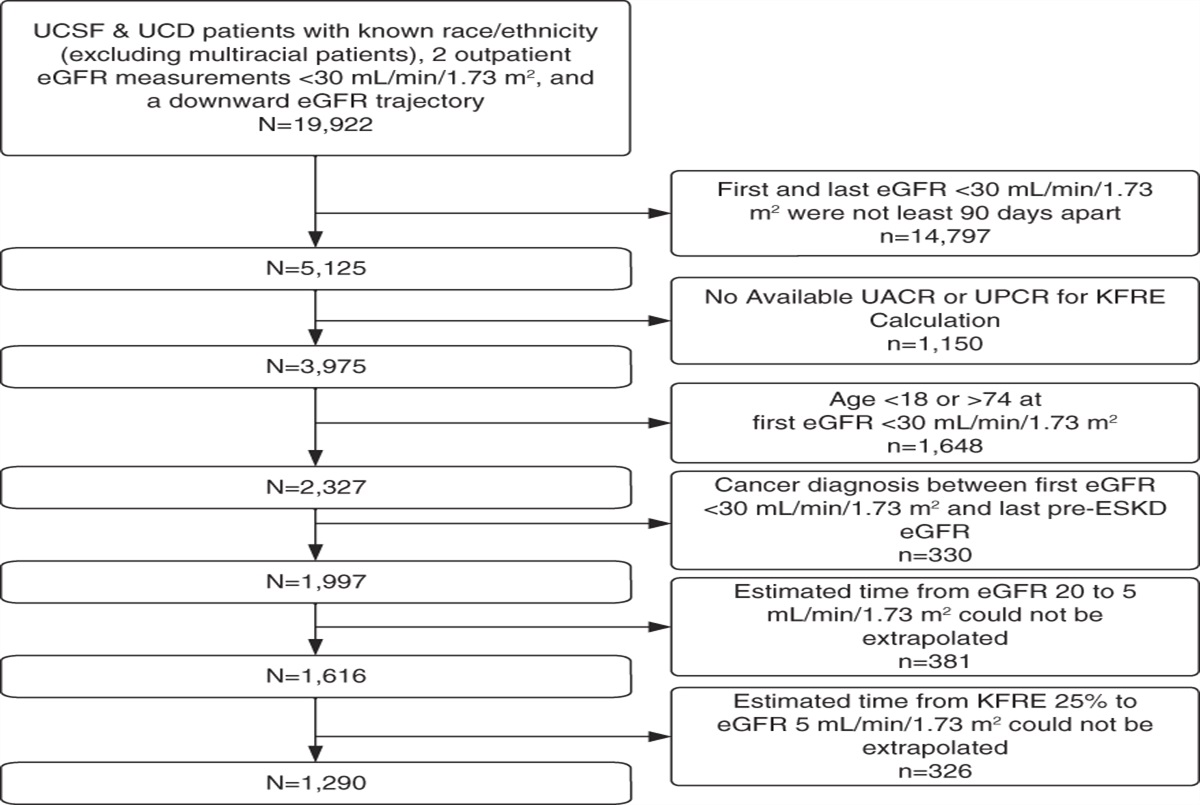
Results Baseline CharacteristicsData were available for 234 randomized patients (96%) and 800 study visits for this analysis (Figure 1). The median number of sessions with available bioimpedance measures was four (interquartile range, 3–4) per patient. The mean age of participants was 50±14 years, 39% were female, and 43% were Black. Differences in baseline characteristics of included and excluded participants are presented in Supplemental Table 1.
 Figure 1:
 CONSORT diagram. FHN, Frequent Hemodialysis Network.
At baseline, patients in lower tertiles of vector length were more likely to be male; have a history of hypertension; and have a higher body mass index, lean body mass, phase angle, and residual kidney function. Patients in lower tertiles of vector length had a shorter HD vintage, were more likely to use a fistula, and had lower ultrafiltration rates and Kt/Vurea (Table 1).
Table 1 - Baseline characteristics according to categories of vector length Characteristica Tertile 1, n=78 Tertile 2, n=78 Tertile 3, n=78 Vector length, Ω/m 223±20 226 (211–237) 276±15 273 (264–288) 356±48 342 (319–379) Lean body mass, kg 53±8 45±7 35±5 Phase angle, ° 5.9±1.7 5.5±1.4 4.8±1.2 Age, yr 49±12 51±14 51±16 Female, n (%) 8 (10) 27 (35) 55 (71) Race or ethnic group, n (%) Asian 4 (5) 6 (8) 6 (8) Black 35 (45) 31 (40) 34 (44) Multiracial, unknown or not reported 7 (9) 6 (8) 10 (13) Native American, Aboriginal Canadian, Alaskan Native, or First Nation 4 (5) 3 (4) 0 (0) Native Hawaiian or another Pacific Islander 4 (5) 0 (0) 0 (0) White 24 (31) 32 (41) 28 (36) BMI, kg/m2 29.4±6.1 28.2±6.5 25.3±6.9 Dialysis access, n (%) Fistula 56 (72) 52 (67) 40 (51) Graft 10 (13) 11 (14) 20 (26) Catheter 12 (15) 15 (19) 18 (23) Duration of kidney failure, n (%) <2 yr 27 (35) 24 (31) 14 (18) 2–5 yr 28 (36) 22 (28) 26 (33) >5 yr 23 (29) 32 (41) 38 (49) Coexisting medical conditions, n (%) Hypertension 76 (97) 68 (87) 68 (87) Heart failure 18 (23) 14 (18) 16 (21) Diabetes mellitus 35 (45) 34 (44) 26 (33) KrU ml/min, n (%) Anuria 44 (56) 51 (65) 58 (74) >0–1 14 (18) 11 (14) 11 (14) >1–3 17 (22) 15 (19) 9 (12) >3 3 (4) 1 (1) 0 (0) Pre-dialysis systolic BP, mm Hg 151±16 144±18 146±18 Pre-dialysis laboratory measurements Hemoglobin, g/dl 12.0±1.2 11.8±1.3 12.2±1.3 Phosphate, mg/dl 6.2±1.6 5.8±1.7 5.3±1.3 Equilibrated Kt/V urea 1.31±0.2 1.40±0.2 1.57±0.3 Ultrafiltration volume, L 3.6±0.9 3.1±0.9 2.8±0.9 Ultrafiltration rate, ml/kg per h 11±4 11±4 13±5 Sodium gradient, mmol/L −2 (−4 to 1) −1 (−4 to 1) −2 (−4 to 1) Randomized to 6/wk HD, n (%) 47 (60) 35 (45) 35 (45)Sodium gradient calculated as pre-dialysis serum sodium minus prescribed dialysate sodium. BMI, body mass index; HD, hemodialysis; KrU, residual urea clearance.
aResults are presented as mean±SD or median (25th–75th percentiles) for continuous variables.
During the follow-up period, the mean patient-level pre-dialysis vector length was 289±59 Ω/m. The median patient-level change (decrease) in systolic BP (pre-dialysis minus post-dialysis) was 13 (6–20) mm Hg; systolic BP increased from pre- to post-HD in 14% of participants.
In unadjusted analyses, shorter vector length (per 50 Ω/m) was associated with 3.7 mm Hg higher post-HD systolic BP (95% confidence interval [CI], 2.4 to 4.9). In the fully adjusted model, this association was attenuated such that shorter vector length (per 50 Ω/m) was associated with 2.9 mm Hg (95% CI, 1.6 to 4.3) higher post-HD systolic BP (Table 2). There was no evidence for effect modification according to the randomized treatment arm (P-interaction = 0.19). In fully adjusted categorical analyses, the lowest tertile of vector length was associated with 4.8 mm Hg (95% CI, 1.0 to 8.5) higher post-HD systolic BP compared with the highest tertile (Table 2). A monotonic association was also noted in spline analyses (Figure 2).
Table 2 - Association of vector length with post-dialysis systolic BP Model Difference in Post-Dialysis Systolic BP (95% CI) in mm Hg Per 50 Ω/m Lower Vector Length Tertile 1 Tertile 2 Tertile 3 Unadjusted 3.7 (2.4 to 4.9) 7.2 (3.6 to 10.7) 3.1 (−0.1 to 6.3) Ref Model 1 1.9 (1.0 to 2.9) 4.5 (1.9 to 7.2) 2.2 (−0.2 to 4.7) Ref Model 2 3.2 (2.1 to 4.3) 6.7 (3.8 to 9.7) 3.7 (1.1 to 6.3) Ref Model 3 2.9 (1.6 to 4.3) 4.8 (1.0 to 8.5) 1.6 (−1.6 to 4.8) RefModel 1 was adjusted for randomized treatment assignment and pre-dialysis systolic BP. Model 2 was additionally adjusted for age, sex, race, body mass index, and access type. Model 3 was additionally adjusted for vintage (<2, 2–5, >5 years), hypertension, heart failure, diabetes, residual urea clearance (0, ≤1, >1–3, >3 ml/min), hemoglobin, serum phosphate, equilibrated Kt/V, ultrafiltration rate, and serum-dialysate sodium gradient. Analyses include 800 visits from 234 patients. CI, confidence interval.
 Figure 2:
 Association of mean vector length with mean post-dialysis systolic BP. The solid black line represents the association of mean vector length with mean post-dialysis systolic BP; the dashed lines are the 95% confidence intervals; the histogram in the background represents the frequency of patients with various mean vector lengths. HD, hemodialysis.
Association of Vector Length with Intradialytic HypertensionDuring the follow-up period, the average patient-level frequency of intradialytic hypertension (defined as any increase >0 mm Hg from pre- to post-dialysis) was 19% of HD sessions. In unadjusted analyses, shorter vector length (per 50 Ω/m) was not associated with odds of intradialytic hypertension (odds ratio [OR] 1.03; 95% CI, 0.81 to 1.32). In the fully adjusted model, shorter vector length was associated with 66% higher odds of development of intradialytic hypertension (OR 1.66; 95% CI, 1.07 to 2.55) (Table 3). There was no evidence of effect modification according to randomized treatment arm (P-interaction = 0.39). In fully adjusted categorical analyses, the lowest tertile of vector length was associated with 68% higher odds of intradialytic hypertension (OR 1.68; 95% CI, 0.56 to 5.03) compared with the highest tertile (Table 3).
Table 3 - Association of vector length with development of intradialytic hypertension (any increase >0 mm Hg from pre- to post-dialysis systolic BP) Model Odds of Intradialytic Hypertension (95% CI) Per 50 Ω/m Lower Vector Length Tertile 1 Tertile 2 Tertile 3 Unadjusted 1.03 (0.81 to 1.32) 0.98 (0.48 to 1.98) 0.85 (0.44 to 1.64) Ref Model 1 1.18 (0.90 to 1.55) 1.29 (0.61 to 2.73) 0.91 (0.46 to 1.82) Ref Model 2 1.65 (1.17 to 2.33) 2.35 (0.97 to 5.65) 1.32 (0.63 to 2.79) Ref Model 3 1.66 (1.07 to 2.55) 1.68 (0.56 to 5.03) 0.85 (0.34 to 2.12) RefModel 1 was adjusted for randomized treatment assignment and pre-dialysis systolic BP. Model 2 was additionally adjusted for age, sex, race, body mass index, and access type. Model 3 was additionally adjusted for vintage (<2, 2–5, >5 years), hypertension, heart failure, diabetes, residual urea clearance (0, ≤1, >1–3, >3 ml/min), hemoglobin, serum phosphate, equilibrated Kt/V, ultrafiltration rate, and serum-dialysate sodium gradient. Analyses include 800 visits from 234 patients. CI, confidence interval.
A >10 mm Hg increase in pre- to post-dialysis systolic BP was observed in 7% of sessions. Using this more stringent definition, shorter vector length (per 50 Ω/m) was associated with a 2.2-fold higher odds of developing intradialytic hypertension (OR 2.17; 95% CI, 0.88 to 5.36; Supplemental Table 2).
Association of Vector Length with Nadir Systolic BP and Intradialytic HypotensionDuring the follow-up period, the median patient-level change (decrease) in systolic BP (pre-HD minus nadir) was 27 (20–36) mm Hg, while the average patient-level frequency of intradialytic hypotension was 8% of sessions. Shorter vector length, both as a continuous and categorical variable, was associated with a higher nadir systolic BP. These effect estimates were accentuated with multivariable adjustment (Supplemental Table 3). Shorter vector length was not associated with the development of intradialytic hypotension (Supplemental Table 4).
Association of Intracellular Water and Extracellular Water with OutcomesIn companion analyses, derived intracellular and extracellular water and the ratio of extracellular water/total body water were considered separately as exposures of interest. In the fully adjusted models, extracellular water and the ratio of extracellular water/total body water were associated with a higher post-dialysis systolic BP, with a trend toward a higher risk of intradialytic hypertension. There was no association of intracellular water with any of the outcomes considered (Supplemental Table 5).
DiscussionIn this post hoc analysis of the FHN Daily Trial, we observed an association of shorter vector length (a proxy for increased tissue hydration) with higher post-HD systolic BP and higher odds of developing intradialytic hypertension.
Although there are several potential etiologies,29,30 hypervolemia is hypothesized to be a major contributor to the development of intradialytic hypertension. In a post hoc analysis of the dry weight reduction in the hypertensive hemodialysis patient trial, patients whose dry weight decreased the most had the largest magnitude of intradialytic BP decline, which in turn was associated with a reduction in interdialytic ambulatory BP measurements.31 Prior studies using bioimpedance have reported similar results. For example, Nongnuch et al. measured multifrequency bioelectrical impedance during a single mid-week HD session in 531 patients in the United Kingdom. They reported that patients who experienced a ≥10% rise in systolic BP had a higher ratio of bioimpedance-derived extracellular water/total body water at pre- and post-HD time points compared with those who did not.7 Similar findings were noted in a smaller case–control study (n=18 in each group) where post-HD multifrequency bioimpedance measures of extracellular volume (at a single mid-week HD session) were higher among patients with intradialytic hypertension (defined as four of six screening sessions with an increase in systolic BP >10 mm Hg) compared with those without.9 Consistent findings were also noted in a multicenter observational study (n=190) from South Africa.8
Our data extend the prior knowledge base by examining repeated measures of volume status over time and by exploring the association with changes in intradialytic BP measurements that were carefully collected as part of a randomized controlled trial. We observed that shorter vector length is associated with higher post-HD systolic BP and the development of intradialytic hypertension. Furthermore, this proxy of hypervolemia was also associated with higher nadir intradialytic BP and a lower risk of intradialytic hypotension. Prior reports using the FHN Daily Trial data have noted that extracellular water decreased to a greater degree from baseline to 12 months among the 6 times/week group (with corresponding increases in vector length) compared with the 3 times/week group,20 suggesting that vector length may be a useful marker of extracellular water and a predictor of BP among patients receiving maintenance HD. Notably, vector length correlates directly with body cell mass, that is, shorter vector length correlates with higher body cell mass, necessitating some caution in reliance on vector length as a sole metric of volume status. However, in this respect, we also noted in companion analyses that only derived extracellular water and the ratio of derived extracellular/total body water were significantly associated with a higher post-dialysis systolic BP, providing some modicum of reassurance of the presence of the relationship of hypervolemia with postdialysis BP.
Objective measures of volume status have been promulgated as superior to clinical examination.32 A systematic review and meta-analysis of randomized trials of technology-assisted target weight reductions (published in 2019) reported some benefit of technology-related interventions in relation to reduction in systolic BP, with a lower risk of hospitalization in subgroup analyses of bioimpedance studies. However, there was a large degree of heterogeneity and risk of bias with many of the studies, which were generally underpowered for hospitalization and mortality-related outcomes.18 More recently, the open-label Lung Water by Ultrasound Guided Treatment in Hemodialysis Patients trial tested a lung ultrasound-guided treatment strategy versus usual care, reporting relief of lung congestion, but a nonsignificant reduction in the composite of all-cause death, nonfatal myocardial infarction, or decompensated heart failure (hazard ratio 0.88; 95% CI, 0.63 to 1.24). However, this trial under-recruited and overestimated the potential risk reduction in determining the original sample size calculations, necessitating caution in the interpretation of the primary results. Indeed, there were fewer intradialytic hypotensive events in the intervention arm compared with standard care, suggesting that data from objective volume assessment may lead to provider responses (e.g., lengthening of HD sessions) that promote hemodynamic stability.32 Some have commented on the variability of the relationship of BP and volume among patients receiving HD,33 while others have reported that the association of extremes of pre-dialysis systolic BP with clinical outcomes may differ according to the concomitant volume status.34,35 In the context of our current results, whether such objective volume assessments can be used to target patients at risk of intradialytic hypertension with the goal of improving clinical outcomes remains to be seen.
There are several strengths to our study, including the availability of repeated measures of bioimpedance and BP, which were carefully collected in the setting of a randomized controlled trial, and the ability to adjust for several potential confounders that were also time-updated. However, our study has several important limitations. The FHN Daily Trial was not designed to test the association of bioimpedance measures with BP changes, and despite multivariable adjustment, the potential for residual confounding remains. Data regarding the exact timing of BP measurements and peri-HD medication use were lacking, as were post-HD bioimpedance measurements and changes in plasma osmolality, which limited our ability to assess the association of changes in these parameters with changes in BP. There are also limitations in the generalizability of our findings to non-North American patient populations and to those not represented within the inclusion/exclusion criteria of the FHN Daily Trial.
In conclusion, we observed that shorter pre-HD vector length was associated with higher post-HD systolic BP, a higher odds of intradialytic hypertension, and a lower risk of intradialytic hypotension among patients enrolled in the FHN Daily trial. Whether population-based or individualized vector lengths could be used to guide the volume and pace of ultrafiltration and associated outcomes will require prospective testing, preferably in an adequately powered randomized clinical trial.
DisclosuresG.M. Chertow reports consultancy for Akebia, Ardelyx, AstraZeneca, Calico, Gilead, Miromatrix, Reata, Sanifit, Unicycive, and Vertex; ownership interest in Ardelyx, CloudCath, Durect, DxNow, Eliaz Therapeutics, Outset, Physiowave, PuraCath, Renibus, and Unicycive; research funding from CSL Behring, NIAID, and NIDDK; advisory or leadership roles for Satellite Healthcare Board of Directors and as a Co-Editor of Brenner & Rector's The Kidney (Elsevier); and other interests or relationships with DSMB service: Bayer, Gilead, Mineralys, NIDDK, and ReCor. G.M. Chertow served as Chair or Co-Chair of Trial Steering Committees with Akebia, AstraZeneca, CSL Behring, Sanifit, and Vertex. He has served as an advisor to CloudCath, Durect, Eliaz Therapeutics, Miromatrix, Outset, Physiowave, Renibus, and Unicycive. He has served on Data Safety Monitoring Boards with Bayer, Mineralys, and ReCor. Y.M.K. Farag reports employment with Bayer US, LLC. F.R. Mc Causland reports consultancy for GlaxoSmithKline and Zydus Therapeutics Inc.; research funding paid to institution from Advanced Medical, Fifth Eye, Lexicon, NIH, Novartis, and Satellite Healthcare; and expert witness fees from Rubin Anders Scientific. K.S. Ravi reports research funding from the NIH (K23 DK127248). K.S. Ravi's spouse reports ownership interest in Halo LLC. The remaining author has nothing to disclose.
FundingThis work is supported by NIDDK from DK129749 (F.R. Mc Causland).
Author ContributionsConceptualization: Glenn M. Chertow.
Data curation: Enass Elsayed.
Formal analysis: Enass Elsayed, Finnian R. Mc Causland.
Investigation: Glenn M. Chertow.
Methodology: Glenn M. Chertow, Youssef M.K. Farag, Finnian R. Mc Causland, Katherine Scovner Ravi.
Resources: Glenn M. Chertow.
Supervision: Glenn M. Chertow, Finnian R. Mc Causland.
Validation: Finnian R. Mc Causland.
Writing – original draft: Enass Elsayed, Finnian R. Mc Causland.
Writing – review & editing: Glenn M. Chertow, Youssef M.K. Farag, Katherine Scovner Ravi.
Data Sharing StatementAnonymized data created for the study are or will be available in a persistent repository upon publication.
Supplemental MaterialThis article contains the following supplemental material online at https://links.lww.com/CJN/B835.
Supplemental Table 1. Baseline characteristics of included study participants and those excluded for lack of bioelectrical impedance analysis (BIA) data.
Supplemental Table 2. Association of vector length with development of intradialytic hypertension (any increase >10 mm Hg from pre- to post-dialysis systolic BP).
Supplemental Table 3. Association of vector length with nadir intradialytic systolic BP.
Supplemental Table 4. Association of vector length with development of intradialytic hypotension.
Supplemental Table 5. Association of intracellular water and extracellular water with outcomes on interest.
References 1. Johansen KL, Chertow GM, Foley RN, et al. US renal data system 2020 annual data report: epidemiology of kidney disease in the United States. Am J Kidney Dis. 2021;77(4 suppl 1):A7–A8. doi:10.1053/j.ajkd.2021.01.002 2. Jansen MAM, Hart AAM, Korevaar JC, et al. Predictors of the rate of decline of residual renal function in incident dialysis patients. Kidney Int. 2002;62(3):1046–1053. doi:10.1046/j.1523-1755.2002.00505.x 3. Inrig JK, Oddone EZ, Hasselblad V, et al. Association of intradialytic blood pressure changes with hospitalization and mortality rates in prevalent ESRD patients. Kidney Int. 2007;71(5):454–461. doi:10.1038/sj.ki.5002077 4. Inrig JK, Patel UD, Toto RD, Szczech LA. Association of blood pressure increases during hemodialysis with 2-year mortality in incident hemodialysis patients: a secondary analysis of the Dialysis Morbidity and Mortality Wave 2 Study. Am J Kidney Dis. 2009;54(5):881–890. doi:10.1053/j.ajkd.2009.05.012 5. Parfrey PS, Harnett JD, Griffiths SM, Gault MH, Barré PE. Congestive heart failure in dialysis patients. Arch Intern Med. 1988;148(7):1519–1525. doi:10.1001/archinte.1988.00380070037010 6. Agarwal R. Hypervolemia is associated with increased mortality among hemodialysis patients. Hypertension. 2010;56(3):512–517. doi:10.1161/HYPERTENSIONAHA.110.154815 7. Nongnuch A, Campbell N, Stern E, El-Kateb S, Fuentes L, Davenport A. Increased postdialysis systolic blood pressure is associated with extracellular overhydration in hemodialysis outpatients. Kidney Int. 2015;87(2):452–457. doi:10.1038/ki.2014.276 8. Sebastian S, Filmalter C, Harvey J, Chothia MY. Intradialytic hypertension during chronic haemodialysis and subclinical fluid overload assessed by bioimpedance spectroscopy. Clin Kidney J. 2016;9(4):636–643. doi:10.1093/ckj/sfw052 9. Van Buren PN, Zhou Y, Neyra JA, et al. Extracellular volume overload and increased vasoconstriction in patients with recurrent intradialytic hypertension. Kidney Blood Press Res. 2016;41(6):802–814. doi:10.1159/000450565 10. Park JH, Jo YI, Lee JH. Clinical usefulness of bioimpedance analysis for assessing volume status in patients receiving maintenance dialysis. Korean J Intern Med. 2018;33(4):660–669. doi:10.3904/kjim.2018.197 11. Steuer RR, Germain MJ, Leypoldt JK, Cheung AK. Enhanced fluid removal guided by blood volume monitoring during chronic hemodialysis. Artif Organs. 1998;22(8):627–632. doi:10.1046/j.1525-1594.1998.06036.x 12. Yanagiba S, Ando Y, Kusano E, Asano Y. Utility of the inferior vena cava diameter as a marker of dry weight in nonoliguric hemodialyzed patients. ASAIO J. 2001;47(5):528–532. doi:10.1097/00002480-200109000-00026 13. Lee SW, Song JH, Kim GA, Lim HJ, Kim MJ. Plasma brain natriuretic peptide concentration on assessment of hydration status in hemodialysis patient. Am J Kidney Dis. 2003;41(6):1257–1266. doi:10.1016/s0272-6386(03)00358-5 14. Kuhlmann MK, Zhu F, Seibert E, Levin NW. Bioimpedance, dry weight and blood pressure control: new methods and consequences. Curr Opin Nephrol Hypertens. 2005;14(6):543–549. doi:10.1097/01.mnh.0000185983.48319.00 15. Kyle UG, Bosaeus I, De Lorenzo AD, et al. Bioelectrical impedance analysis—part I: review of principles and methods. Clin Nutr. 2004;23(5):1226–1243. doi:10.1016/j.clnu.2004.06.004 16. Hannan WJ, Cowen SJ, Fearon KC, Plester CE, Falconer JS, Richardson RA. Evaluation of multi-frequency bio-impedance analysis for the assessment of extracellular and total body water in surgical patients. Clin Sci. 1994;86(4):479–485. doi:10.1042/cs0860479 17. Khalil SF, Mohktar MS, Ibrahim F. The theory and fundamentals of bioimpedance analysis in clinical status monitoring and diagnosis of dis
Comments (0)